
In Chapter 7, we spoke about packers and how malware author uses them to hide his real malware payload by obfuscating it and generating a new packed malware executable/binary that contains within the original malware payload but now in obfuscated form. This packed binary is created by passing a malicious payload to a packer program. We also saw that static string analysis of packed samples barely gives you anything meaningful that we can connect to any malicious behavior to classify the sample as malicious.
To accurately analyze packed samples, we need to extract the actual payload out of the packed binary by using a process called unpacking. There are two types of unpacking techniques, manual and automatic. With manual unpacking, we extract the payload by manually debugging/reversing a packed binary with the help of debuggers and disassemblers. With automatic unpacking, we extract the payload with the aid of unpacking tools.
But these automated unpacking tools are created by automating the steps involved in the process of manually unpacking a sample. Hence manual unpacking still forms the foundation of unpacking a sample, using which we can then build other automated tools so that we can then automatically unpack other samples that have been packed using the same packer.
But manual unpacking can be a tedious and time taking process. It requires debugging and reversing through the packed binary until we locate the payload. Before you can even reach the payload, there can be thousands of lines of code that you have to sift through before you discover the payload.
In this chapter, we are going to teach you some debugging tricks that you can use in the manual unpacking debugging process that help you fast unpack samples and reach the payload easily. Before we get into learning these tricks, let’s first understand the internals of how a packed sample unpacks itself and then sets/configures the payload up before executing it.
Unpacking Internals
In this section, we explain the unpacking process in depth that should help us set the fundamentals up before we start reversing packed samples. But before we can do that, let’s learn two very important terminologies related to packed samples and the unpacking process: OEP and payload.
OEP and Payload
We know when an executable/payload is packed by a packer program, a new packed binary is created. The newly created packed binary has the original executable payload embedded in it, in the compressed form. You can say that the payload is delivered to the system or rather executed when the packed binary/sample is executed.
Apart from the obfuscated payload embedded within the packed sample, the packer also embeds a loader code into the packed binary, which sometimes is also referred to as unpacking stub, bootstrap code, and so forth. Now in a packed sample, the entry point (EP) of the packed binary points to the loader code . So, when the packed sample is executed, the loader code is the one that is first executed, which is responsible for decompressing the obfuscated payload into the memory. You can say that the loader is the one that unpacks the compressed payload to its original form.
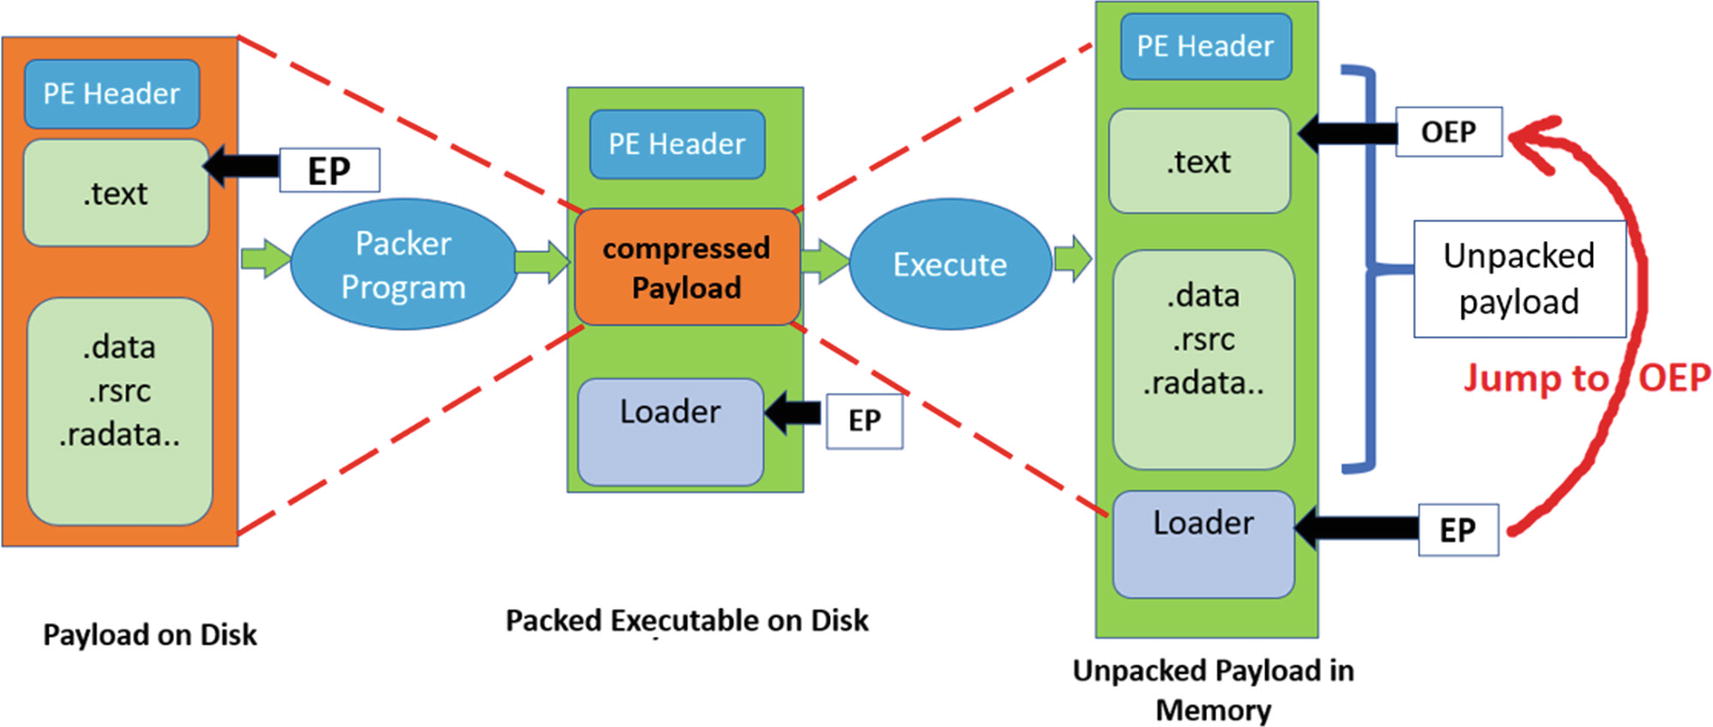
The various conversions in the packing and unpacking process that finally decompresses and reveals the original payload and executes it
We now know that the loader code is the one that unpacks the compressed payload to memory and then transfers the control to the OEP inside the unpacked payload. So, from a reverse engineering perspective, if we want to unpack a packed binary, we need to debug and skip through the loader code and figure out the point of transition into the unpacked payload. But before we do that, let’s understand how a packed executable executes at the code level so that we can identify this transition from the loader code to the payload.
Execution of a Packed Binary
Memory allocation: The loader allocates memory to dump the decompressed payload into
Payload decompression: The loader decompresses the packed payload to the allocated memory in (1)
Import resolution: The various addresses inside the decompressed payload , including the addresses of the Win32 APIs needed by the payload, are resolved
Jump to OEP: The loader transfers control to the OEP which is the start of the payload
Payload execution: The payload now runs, carrying out its malicious activity
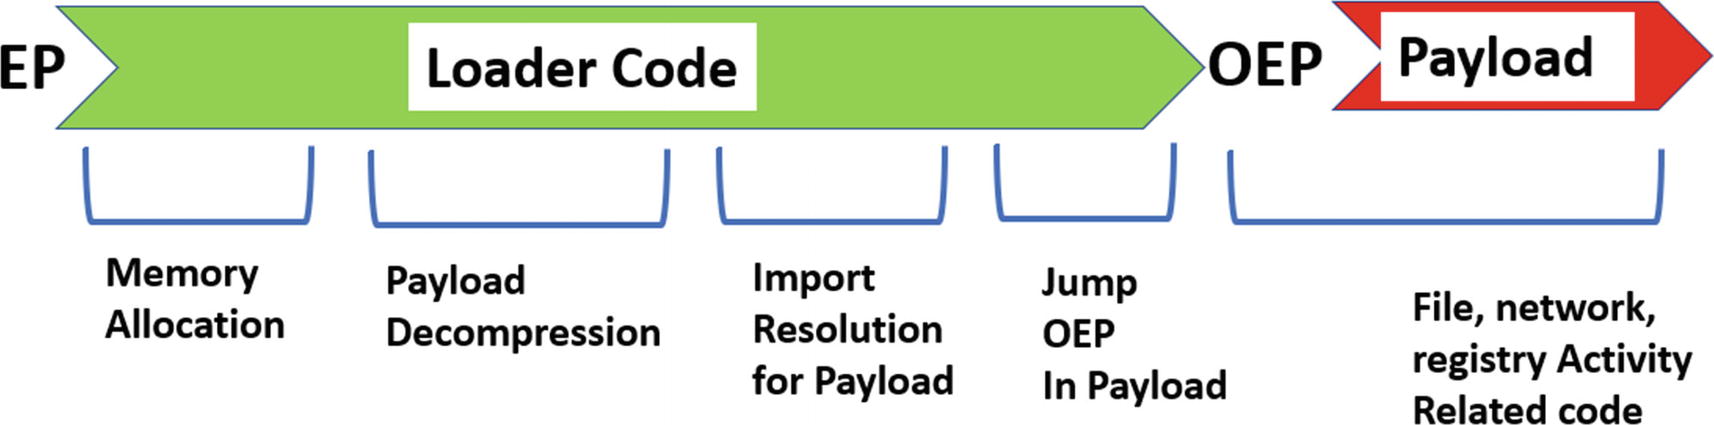
Various stages that occur when a packed binary is executed
Now while you are reversing packed samples, it can be a lot harder to distinguish between the various stages of the sample’s execution, just by looking at bare assembly instructions. But if you combine the assembly instructions you are debugging and relate them to the Win32 API calls made by the sample, you find it a lot easier to identify these various stages, and also figure out and understand how they work.
In this chapter, we are going to take the help of our APIMiner tool to obtain the Win32 APIs involved in various phases of execution. Do note that APIMiner logs the ntdll(NT) variant of Win32 APIs. So, if you are used to working and seeing non-NT versions of Win32 APIs, you might have to mentally convert these NT API names logged by APIMiner to its corresponding non-NT version. In the end, they are all the same, because Win32 APIs, in the end, are wrappers that end up calling their corresponding NT version of Win32 APIs. Finally, what we want to learn is the functionality of the API that is invoked, which reveals the intention of why the malware sample invoked it.
Mapping of Some ntdll NT APIs and Their Corresponding Win32 Wrapper APIs
NTDLLl API | Corresponding Wrapper API |
|---|---|
LdrLoadDll | LoadLibrary |
LdrGetProcedureAddress | GetProcAddress |
NtAllocateVirtualMemory | VirtualAlloc |
NtProtectVirtualMemory | VirtualProtect |
NtFreeVirtualMemory | VirtualFree |
NtWriteFile | WriteFile |
NtReadFile | ReadFile |
In the next set of sections, let’s look at the stages of execution and learn the various Win32 APIs called in each stage and how the code in a stage uses these APIs to satisfy the functionality of that stage.
Memory Allocation
When the packed sample runs, the loader first starts by allocating memory to store the unpacked payload. Allocation of memory can be done using APIs like VirtualAlloc, HeapAlloc, GlobalAlloc, RtlAllocateHeap, and NtAllocateVirtualMemory, but the most frequently used one is VirtualAlloc.
Some of these APIs might be NT versions of Win32 APIs, but when you see an API you need to understand its functionality. The functionality of the API reveals its intention and thereby the intention of the malware.
Do note that a single block of memory doesn’t need to be allocated for storing the decompressed payload. The loader may place the payload across multiple memory blocks. In that case, multiple memory blocks are allocated, and you encounter memory allocation APIs invoked multiple times in the loader code. Other than to store the payload, memory blocks can also be allocated for placing intermediate code or data that are required during various stages of the unpacking/decompression process.
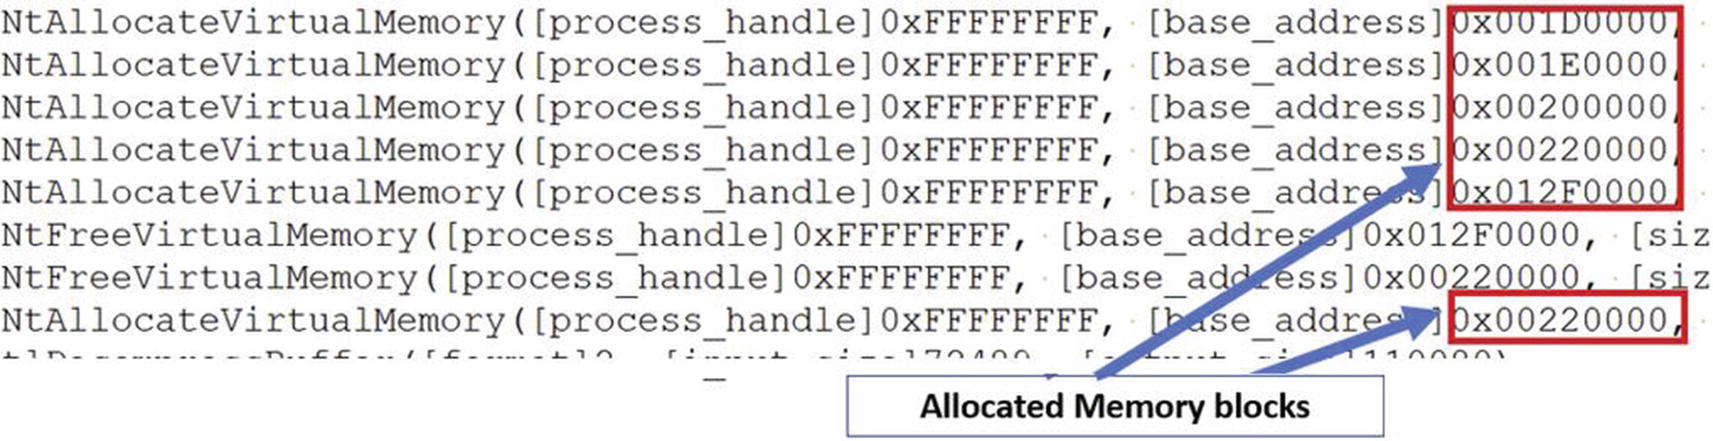
APIMiner logs for Sample-17-1.exe that shows memory allocations by the loader
Alternatively, some of the loaders may prefer to overwrite some existing memory space already available in the sample’s running process memory space, which means you may not see any calls to allocate memory, or at least not as many memory allocation-related API calls. For such cases, instead, you might encounter APIs like VirtualProtect and NtProtectVirtualMemory, that change the permission of a memory region to writable and executable so that the loader can write and execute code from it.
Decompression
In this stage, the loader unpacks/decompresses the compressed payload to the allocated memory regions from the previous step. The payload is unpacked into the allocated memory using decompression algorithms . These algorithms perform a lot of mathematical operations, and you see only raw assembly code instead of any Win32 APIs being invoked by this piece of decompression code. If you are lucky enough, you might encounter some malware using RtlDecompressBuffer Win32 API, which implements certain decompression algorithms.
Now the unpacked payload that is written to memory is usually an executable. It also has a PE header and an entry point, which we call the OEP. Do note that it’s not necessary to accommodate the entire payload into a single memory block. The headers, individual sections can be in separate memory blocks.
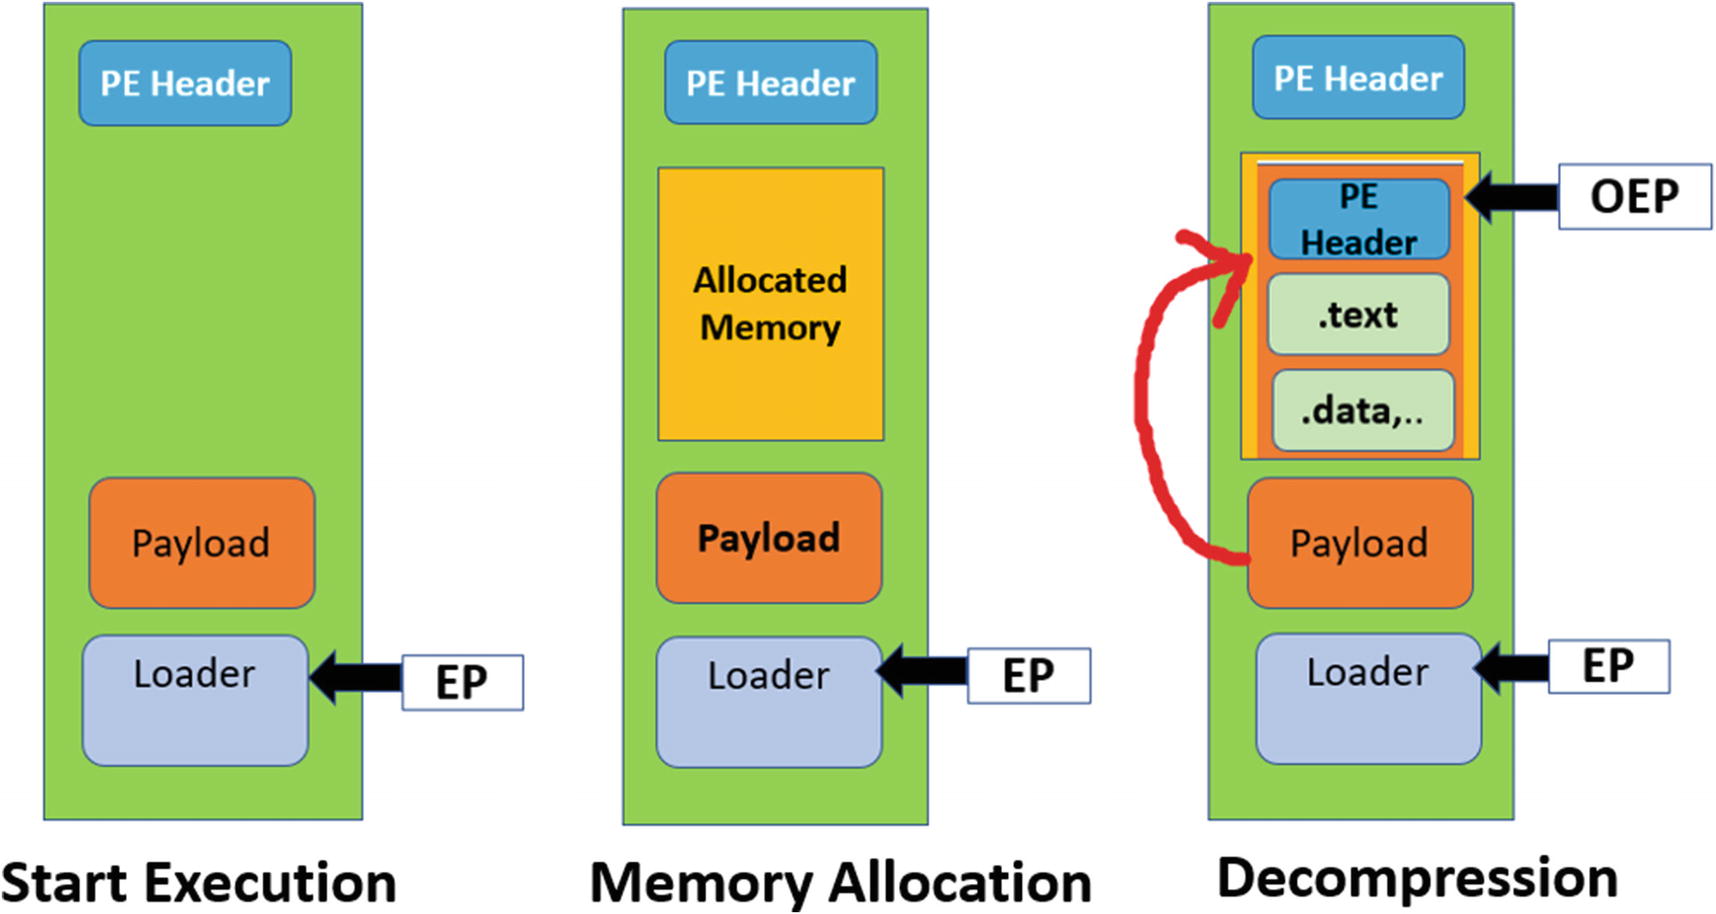
State of virtual memory map during the execution of packed sample process in the memory allocation and decompression stages of unpacking
Import Resolution
Since the payload has been unpacked into the memory, it’s time to make some fixes so that code inside it can be executed.
A PE Executable depends on various Win32 APIs to execute certain functionalities that it might need. You learned in Chapter 5 that these APIs are imported by the executable, which are present in the executable’s import table. If you look at the traditional process creation mechanism when the executable/program is executed, the Windows loader goes through, all the APIs that the program depends on by parsing through the program’s import table list, loads into memory the various DLLs the process needs and then resolves the addresses of these APIs in the import table. This mechanism of finding and resolving the addresses of the imported APIs that a program depends on is called import resolution. Without import resolution, a process can’t invoke any API it needs, since it won’t know where in memory it is located.
Let’s connect to the packed samples and the unpacking process. A packed binary-only imports a few APIs that are required by the loader. But from our previous decompression stage, the payload, which has been decompressed, depends on a lot of WIn32 APIs to carry out its malicious intentions. Who handles the import resolution for this unpacked payload? It won’t be the Windows loader because it is only called for help by the OS when it needs to load a new process from a program on disk. So, in our case, it’s our loader stub code inside our packed binary, which must do the import resolution for the unpacked payload.
Getting into the internals of how the loader does import resolution, the loader reads the import table of the unpacked payload to find out the names of the imported APIs the payload depends on. But before it can find the address of an API, the loader first needs to load the DLL that contains the API. This is done by using the LoadLibrary API. The LoadLibrary API returns the address of the DLL after successfully loading the dependency DLL into memory. This address is then used by the loader as a parameter to the GetProcAddress API to find the address of the API located in the DLL.
Example Set of API Calls to Load and Resolve VirtualAlloc Address in Memory
A malware payload depends on multiple APIs that might be spread across multiple DLLs. So, while using APIMiner or any other API logging tool, you might encounter multiple instances of the API calls, where a call to a single LoadLibrary API is followed by multiple calls to GetProcAddress API. Similarly, you might see multiple calls to LoadLibrary to load various dependency DLLs.
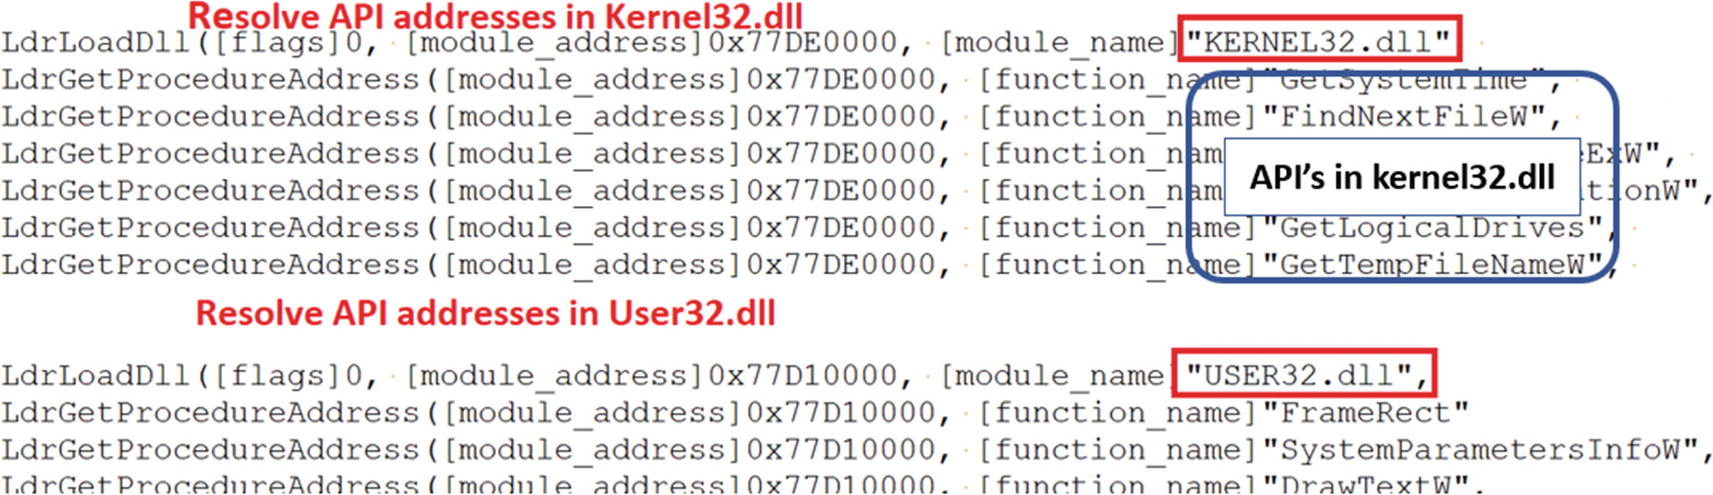
APIMiner logs for Sample-17-1.exe that shows Import Resolution related API calls
Please note that in the API logs, the LoadLibrary and GetProcAddress APIs are logged by APIMiner as their NT API variants LdrLoadDLL and LdrGetProcedureAddress, which are just the same.
At the disassembly level, when you are debugging a packed sample, you might see the call to LoadLibrary, followed by a loop that calls GetProcAddress to resolve all the APIs addresses in the DLL the payload depends on.
Now with the API resolution , the payload has everything that it needs to execute. The role of the loader code is over, and now it has to hand over the execution to the payload and to do so, the loader code needs to transfer the control to the OEP in the payload.
Jump to OEP
OEP is the address of the instruction that is supposed to be executed first when the loader transfers the execution to the unpacked payload. The loader transfers the control to the OEP, usually using an unconditional jump instruction . The target of this unconditional jump is usually to a different memory block. We check an example of this in the subsequent sections when we start reversing some samples.
The loader usually unpacks the entire payload in one chunk to a single big memory block, so you can say that the loader and payload are in separate memory blocks. When the loader jumps to the OEP, it transfers the control from one memory block to another. But the loader can carry out decompression in multiple stages as well, where it unpacks the payload into multiple separate memory blocks, and there might be several jumps across these memory blocks to transfer control to the OEP. You need various techniques to figure out that you have landed at the OEP.
The Payload Execution
With the control now transferred to the unpacked payload’s OEP, the payload now executes carrying out its malicious functionality. In our chapters on malware components, dynamic analysis, and payload classification, you learned the various kinds of APIs that different types of malware could use.
While reversing malware samples, you can use your knowledge of the APIs that most malware (present in an unpacked payload) invoke, and search for the presence of API invocations in your APIMiner API logs, which indicate if you are inside the unpacked payload or still inside the loader code.
Creation of new files on the disk
Writing to files
Creation of registry keys and values
Network connections
New process creation
Opening and writing into remote processes
Creating threads in remote processes

APIMiner logs showing the invocation of RegCreateKeyExA API from the unpacked payload in Sample-17-1.exe
Figure 17-6 shows that the RegCreateKey API creates a new registry key "SoftwareuRyIZ15LWxSYAJ4". There is a rare chance that these kinds of APIs are called by the loader code, and hence these APIs must have been invoked by the unpacked payload.
Manual Unpacking Using Debuggers
Manual unpacking requires analysts to debug packed binaries and extract the payload out of it. Our understanding of the execution of packed binary and the various stages of unpacking can help us to locate the payload inside the packed binary. And a super important trick that can help us fast unpack a sample is using tools like APIMiner and API logs.
Locating the unpacked or decompressed payload in memory
Dumping the payload to disk for further analysis
The first step of unpacking is identifying the location of the unpacked payload in memory. The second step is saving the payload from the memory to the disk. This is known as dumping . Memory dumping tools can help you to dump the unpacked payload from memory to disk. OllyDbg has features and plugins that can help you to dump the payload to a file on disk. We are going to use the OllyDumpEx OllyDbg plugin to dump the payload from memory.
Now locating the payload in memory is the most important step as well as the most challenging step in the manual unpacking process. Packers are designed mostly not to reveal the embedded payload easily. But the weakness of packed samples lies in the fact that the payload has to be unpacked to execute it. In the upcoming sections, we are going to teach you certain debugging tricks that can help you to locate the payload with ease.
Fast Unpacking Using API Logs and APIMiner
The loader is the one that finally unpacks the payload into the memory. If we debug through the loader, we are certain to reach a point where it hands over the control to the payload. But debugging the entire loader is not a cakewalk. There can be thousands of lines of assembly code that we need to pass through before reaching the OEP in the payload. But as we said earlier, the knowledge of APIs used by most malware can help us form strategies to debug through large amounts of assembly loader code.
One strategy is to set breakpoints on APIs that are encountered during various stages of execution of the packed binary. This can help us automatically jump through a ton of unwanted loader code and warp straight into the various stages in the loader without debugging every line of assembly. Not only on APIs but placing breakpoints on certain memory areas and certain codes can also help us to locate important pieces of code or data needed during unpacking.
Combining this logic with API logs from a dynamic analysis of a sample can be helpful. With the knowledge of commonly used malware APIs you learned in our earlier chapters about malware components, and with the API logs you can obtain using API logging tools like APIMiner, you can play and quickly reverse malware in your favorite debugger. You can easily strategize your manual unpacking steps by referring to the API logs. Instead of debugging every code in the loader from start to end, you can instead set breakpoints at certain APIs and then start debugging from there till you reach the OEP. If you directly want to land in the middle of the payload, you can choose an API from the logs that are possibly a part of the payload, then set a breakpoint on that API and then execute until you hit the API.

APIMiner logs for sample-17-1.exe
As seen in the logs, you identify the presence of the API RegCreateKeyExA, but just before it is invoked, we can see that LdrGetProcedureAddress is also invoked. You learned earlier in this chapter that the loader invokes various Win32 APIs, with GetProcAddress being a popular one, which shows itself in the logs using its NT variant LdrGetProcedureAddress. We also learned that the unpacked payload calls other Win32 APIs, including ones that touch the registry, just like the RegCreateKeyExA. So, the LdrGetProcedureAddress in the sample must have been invoked by the loader, and the RegCreateKeyExA must have been invoked by the unpacked payload. Common sense dictates that the transition jump into the OEP of the unpacked payload from the loader has to be somewhere between these two API calls.
So how do you obtain the exact location of the OEP? If you notice, the LdrGetProcedureAddress API call invoked by the loader is called with the string parameter "CryptReleaseContext". So, you can start OllyDbg and set a conditional breakpoint on LdrGetProcedureAddress such that it breaks only if its parameter is "CryptReleaseContext". But there’s a catch here. In the logs, if you sift through the APIs, you might also notice that LdrGetProcedureAddress is invoked with the parameter "CryptReleaseContext" twice, which means if you debug the code using OllyDbg with the breakpoint set, it hit our breakpoint twice.
But we are only interested in the second LdrGetProcedureAddress invocation right before the RegCreateKeyExA call. So, run your code using OllyDbg with the breakpoint set on LdrGetProcedureAddress, but ignore the first time the breakpoint hits, and continue till you hit the breakpoint the second time. Once our breakpoint hits, you can start stepping through the code line by line, till we come across an unconditional jump into another memory block, which should be the OEP of the unpacked sample. This is better and faster than debugging line by line of the loader code to find the OEP.
Now that we know the OEP of the unpacked payload, we can thoroughly analyze it. You might also want to save a snapshot of the VM at this stage so that you can come back and re-analyze the sample from this (OEP) point later. Alternatively, you can also dump the unpacked payload using OllyDumpEx so that you can statically analyze the payload using an advanced disassembly tool like IDAPro.
Debugging Tricks for Known Packers
Malware authors also use well-known packers to pack malware. One of the commonly used packers is UPX. Other popular packers include aspack, ascompact, PEcompact, nspack, mpack, yoda, and so forth. The loader in the packed samples generated by these packers can have thousands of lines of assembly code, and going through each of these to reach the unpacked payload consumes. Malware researchers have developed debugging tricks over time that can help you to skip the loader code and reach the OEP of the unpacked payload directly.
Now the first step of unpacking known packers is to identify the packer. In Chapter 7, we discussed identifying packers using the entry point and section names. Let’s start with Sample-17-2.exe from our samples repo. Apply the static analysis technique from Chapter 7 on this sample, which should reveal that sample is packed using UPX. Now that we know the packer is UPX, if you Google unpacking UPX, you find a commonly used trick called the ESP trick that can locate the OEP for UPX packed samples. What is this ESP trick?
The entry point of a UPX packed binary starts with a PUSHAD instruction. In other words, PUSHAD is the first instruction in a UPX packed sample. A PUSHAD instruction pushes all the registers onto the stack. Once the loader in the UPX packed sample does its job of decompressing/unpacking the payload to memory, it restores the original state of the registers, which is pushed at the very start using the PUSHAD instruction. To do that, it uses the POPAD instruction, which accesses and reads the address locations on the stack to read them and restore the registers. Once it has restored the registers using the POPAD instruction, it then does an unconditional JMP into the OEP of the unpacked payload. So, you can conclude that for UPX packed samples, the loader code pretty much ends unpacking the payload at the POPAD instruction right after which it does the unconditional JMP to the OEP.
We can exploit this pattern in the UPX loader code to figure out the exact location of the OEP. If we can set a memory breakpoint on the stack address after the first PUSHAD instruction is executed, we can break at the exact point the loader code calls POPAD, thereby taking us to an instruction location in the loader code that is a few instructions behind the conditional JMP to the OEP. And that’s the ESP trick. Let’s now try this out hands-on.
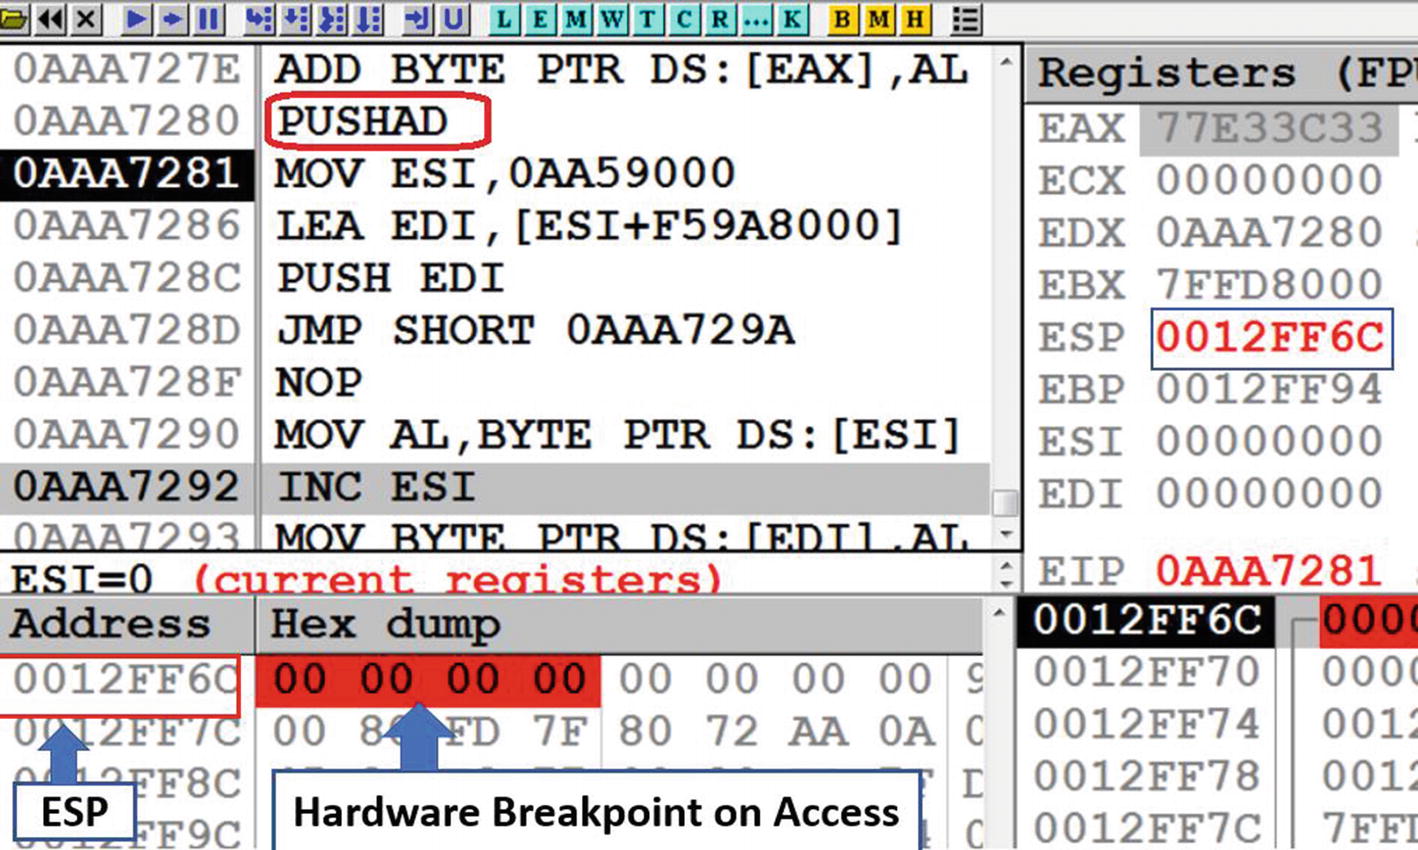
Set Hardware Breakpoint on the four bytes pointed to by the ESP
Now when the hardware breakpoint is set, you see the four bytes at address 0x12FF6C highlighted in red, as seen in Figure 17-8. This means that next time someone tries to access this memory location, OllyDbg pauses/breaks execution right after the instruction that accesses that memory location. But we also learned that with UPX packed loader code, it access this memory location when it does a POPAD, which is where we break. Let’s test it.
Debugger breaks on hardware breakpoint we have set on Sample-17-2.exe
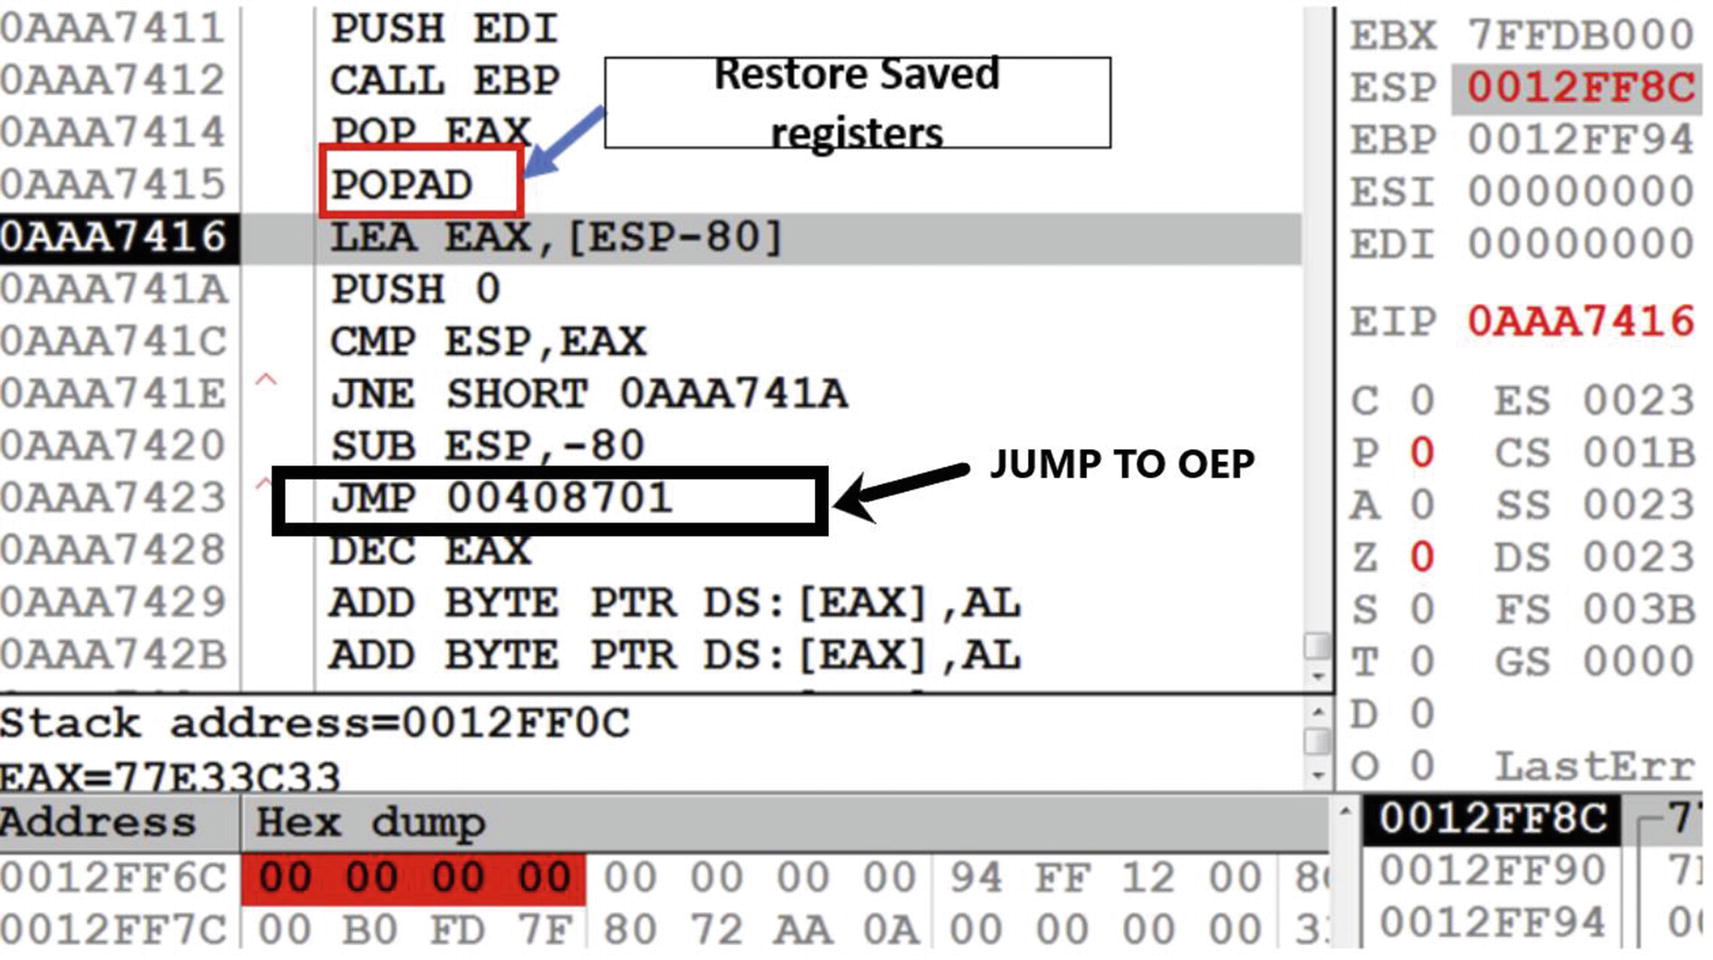
You learned from the ESP trick that the pattern used in UPX packed sample’s loader code is that when it hits the POPAD, the loader has finished decompressing the payload and shortly be jumping into the OEP. As you can see in Figure 17-9, if you scroll a few instructions down after the POPAD, you can locate an unconditional JMP instruction at address 0xAAA7423, which jumps into 0x00408701, which is the OEP of the unpacked payload.
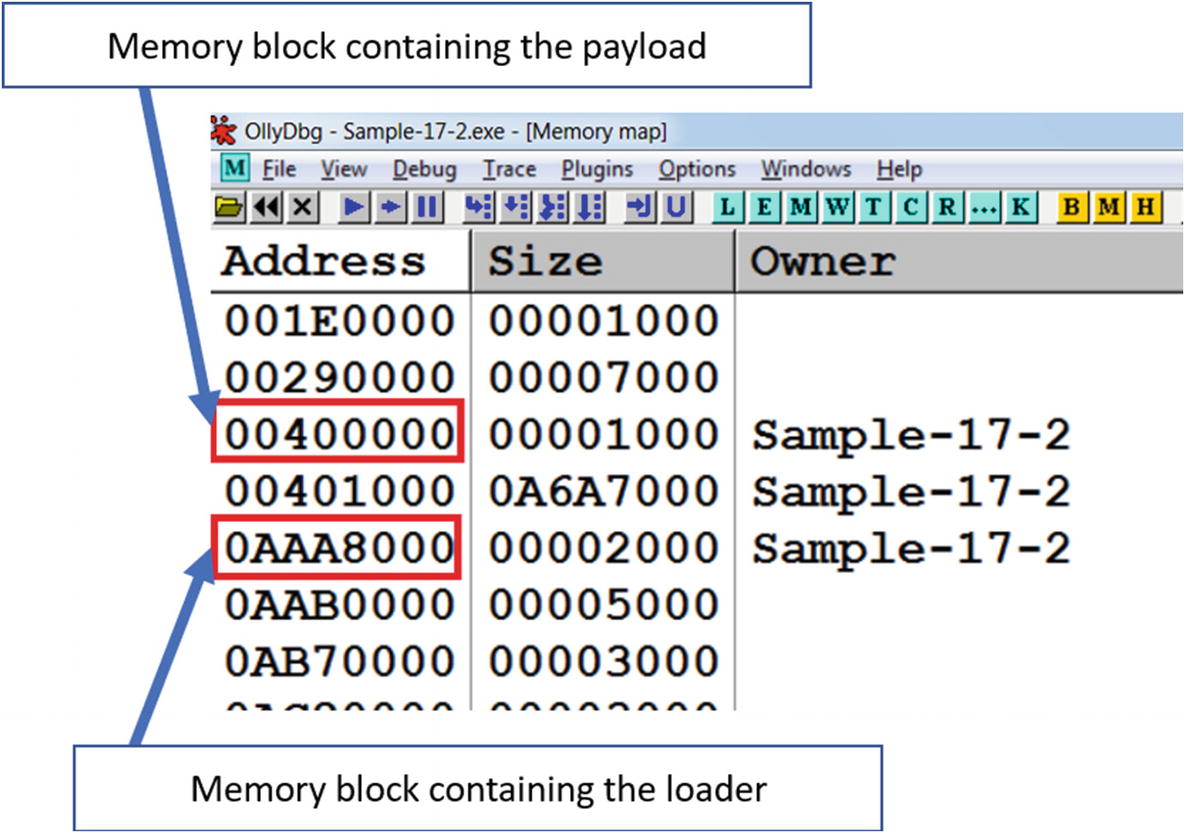
Memory blocks containing loader and payload
This reveals that the current unconditional JMP instruction at address 0xAAA7423 in Figure 17-9 lies in the loader code, and the target of the jump (i.e., 0x00408701) are in different memory blocks. From what you learned in the section Unpacking Internals a jump to OEP usually takes you to a different memory block, which also acts as a classic indicator that this JMP instruction transitions to the OEP of the unpacked payload.

Original entry point for Sample-17-2.exe
If you wish to debug further into the payload, you can debug further from here. If you want to extract the payload onto a file in the disk, you can use a memory dumping tool like OllyDump using the OllyDumpEx plugins, which you can then analyze using static analysis tools like IDA Pro.
OllyDumpEx to Dump Payloads

Dumping a payload with OllyDumpEx plugin
Step 1: The first step is to choose the base address of the payload from which the dumping should start. You can say this is the address of the first byte of the payload, which starts with the MZ header. In this case, the payload is the main module itself. If you find the payload in a memory block, OllyDumpEx gives an option to specify the memory block.
Step 2: In this step, you need to select the dump option. If you choose the rebuild option, OllyDumpEx tries to build a valid PE executable out of the payload in memory. We always prefer to choose this option. Rebuild option might not work in case the packer uses some anti-dumping tricks or has heavily tampered the import table. In such cases, you need to use other tools like Imprec to manually fix the imports.
Step 3: The next step is to choose the entry point of the payload. OllyDumpEx can guess the entry point if it knows the image base or base. In this case, we are dumping starting at the OEP, which we know is the Entry point of the payload. Hence, we can click the Get EIP as OEP button.
Step 4: OlldyDumpEx can also find sections in the payload by parsing the payload by assuming the payload is a PE executable. It displays the possible sections in the payload, and we can manually choose the sections which we want to be present in the output dump.
Now when we have set all the fields in the plugin window, we can dump the payload to the disk. You can now click the Dump button and then save it a folder of your choice. The same options we chose this time would not work for each kind of packer. You need to try out different options for different kinds of packed binaries.
Now you have the payload at your disposal for analysis. If the dumping has been correctly done, the payload demonstrates the same behavior as the packed binary. The API traces vary since the new entry point points to the OEP in the payload and not to the loader. So, all the Win32 APIs that previously were invoked by the loader in the packed sample are no longer present in the API logs, since the loader code has been removed from the dumped payload.
Do note that sometimes it is hard to accurately dump the payload. As a result, the dumped payload cannot be loaded in debuggers. In that case, you can perform static analysis on the dumped payload using tools like IDA Pro and also conduct string analysis on it.
The ESP trick applies to some other known packers like ASpack. The pattern of JMP to OEP we displayed is specific to UPX, but other known packers can have similar patterns. Like the ESP trick, researchers have devised other tricks to unpack known packers. If your packer identification tool like PEid can identify a packer used for an executable, you can look out for unpacking tricks on the web for the identified packer.
Other Tricks
Loaders can allocate memory areas to decrypt/decompress payloads or parts of payloads into these areas. As a debugging trick, you can set a breakpoint on memory allocation APIs like VirtualAlloc to find out what memory areas that are getting allocated. With the address of these allocated memory blocks known, we can keep a watch on these areas using hardware and memory breakpoints to see if anything interesting is getting written to these locations. You can inspect the content of the memory areas in the memory dump window of OllyDbg, or you can use Process Hacker for the purpose as well. If you have set a memory breakpoint on these address blocks, OllyDbg break execution if the loader writes any data to these memory blocks.
Other than placing breakpoints, you should look carefully for certain code constructs like loops in the loader code. The loader code can use loops for decompression or decryption purposes. If the memory write operation is happening in loops, you should look at the memory region that’s getting written into. It can be a payload or part of the payload.
Other interesting loops can be the import resolution loops. The import resolution loops indicate that we are toward the end of the loader code and are soon going to reach the OEP. After executing the import resolution, you can start stepping line by line and watch out for any unconditional jump instructions, which might be a jump to OEP.
Compiler Stubs to Identify OEP
Most of the time, malware payloads are compiled using a high-level language like C++, VB, Delphi, and so forth. Compilers have code known as a compiler stub in between the entry point of the program and the main()function written by the programmer. The main() function is not usually the OEP, since you have various other compiler stub and setup code that is first run before your main() function is called. This compiler stub code is usually the entry point of a program.
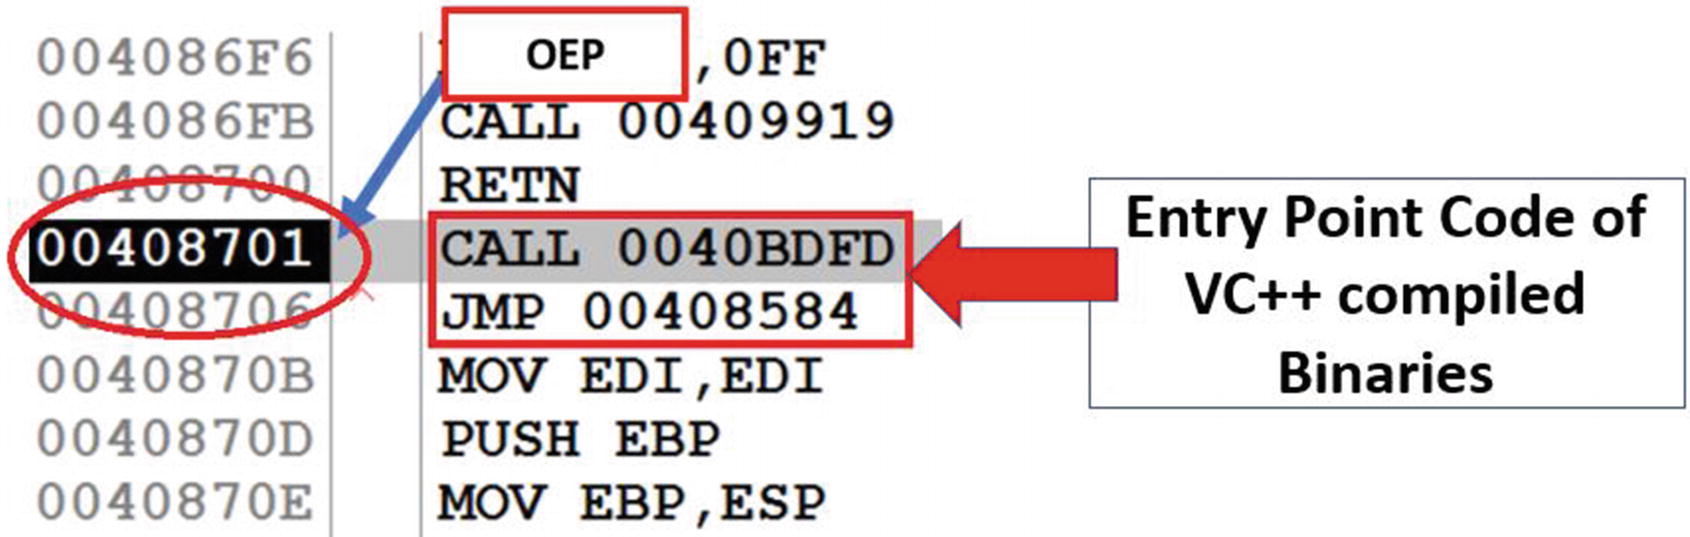
Compiler Stub identified at OEP of Sample-17-2.exe, indicate that the actual unpacked payload has been compiled using VC++
As you can see, the code at the OEP starts with a CALL instruction followed by a JMP instruction. This instruction sequence is usually a combination found at the entry points of VC++ compiled executables. Armed with the knowledge of compiler stub patterns, you can a lot of times easily notice the entry point of the payload.
But watch out for some corner cases. It can so happen that a payload has been packed with multiple layers of packers. If the packers themselves have been programmed in high-level languages and have been compiled using compilers like VC++, you see multiple compiler-related stubs as you go through multiple layers of unpacking, which can mislead you into thinking that you are at the OEP of the unpacked payload. So, you always need other double verification steps like the ones we talk about in the next few sections to confirm if you are finally inside the unpacked payload or not.
Back Tracing
The methods we discussed until now involved stepping through the loader code to some extent to reach the payload, which can be time-consuming to debug. What if we can land somewhere inside the payload and then walk backward in the code to locate the OEP of the payload. Debuggers do not allow debugging in a backward direction. But debuggers can give us an idea of what instructions or functions have been executed earlier. We can exploit this feature of debuggers to identify the payload as well as OEP.
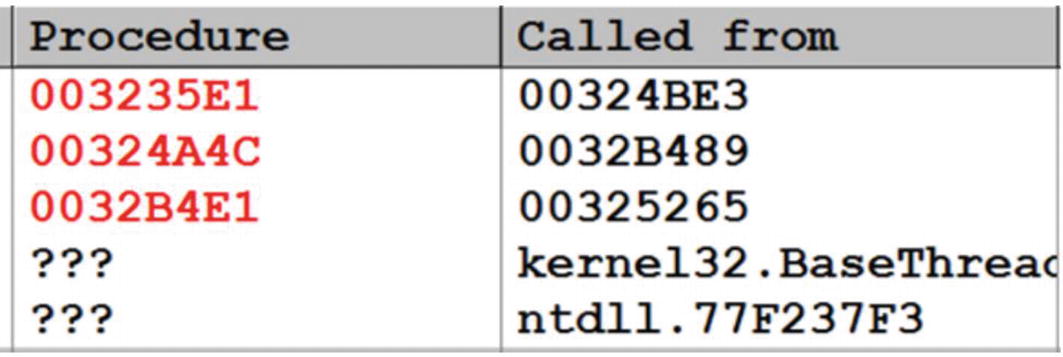
Call stack after hitting breakpoint on RegCreateKeyExA on Sample-17-1.exe

Memory Map of Sample-17-1.exe after hitting the breakpoint on RegCreateExA()
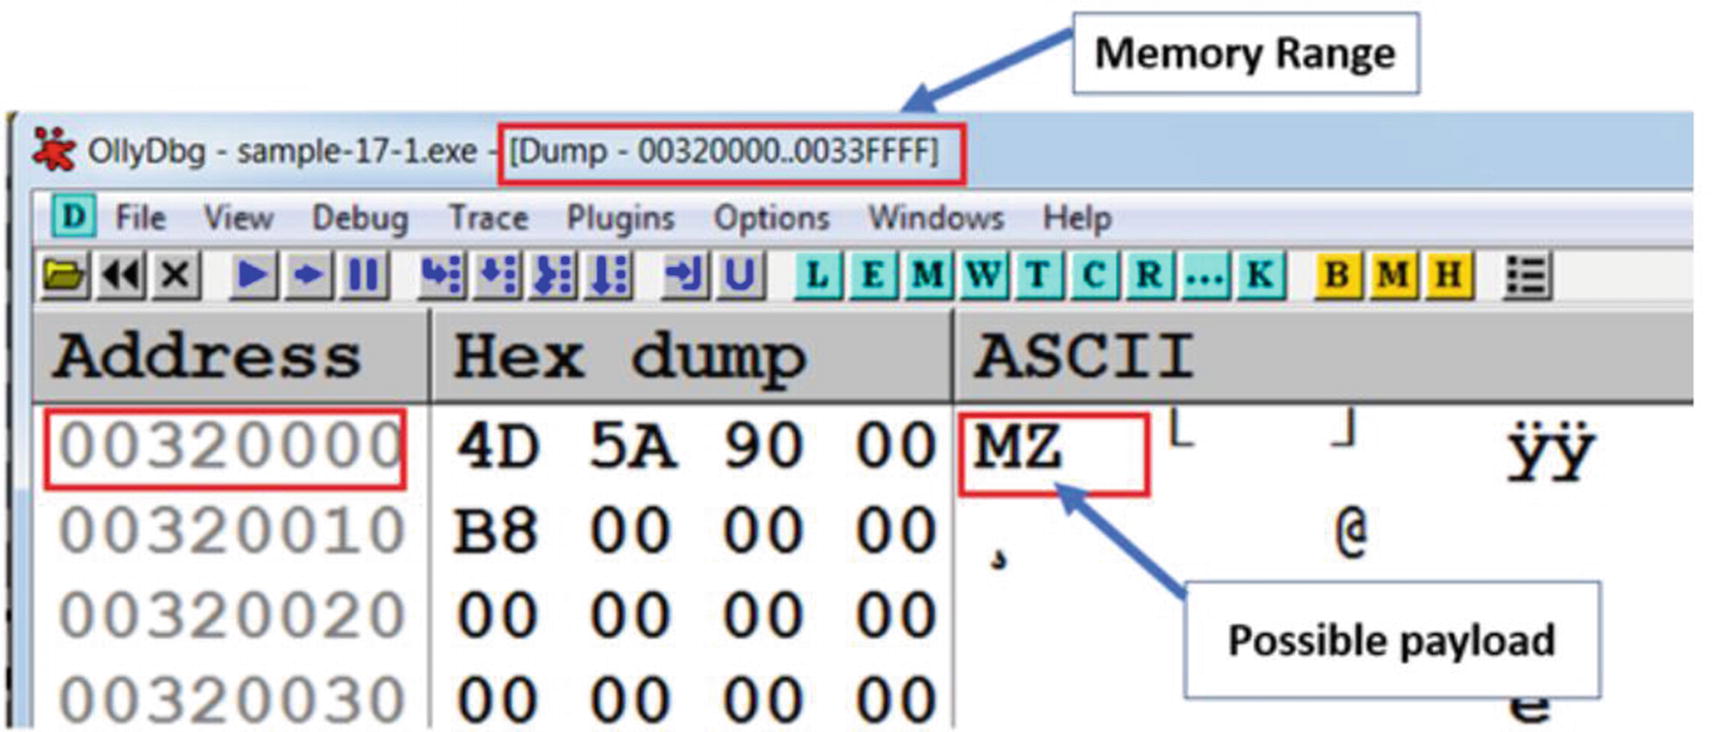
Contents of the suspicious RWE memory in Sample-17-1-exe suspected to contain an unpacked payload
As you can see, the memory region starts with an MZ header. If the memory region does not belong to any module (i.e., an executable main module or a DLL module), then where does this MZ come from? Well, this can/must be the unpacked payload.
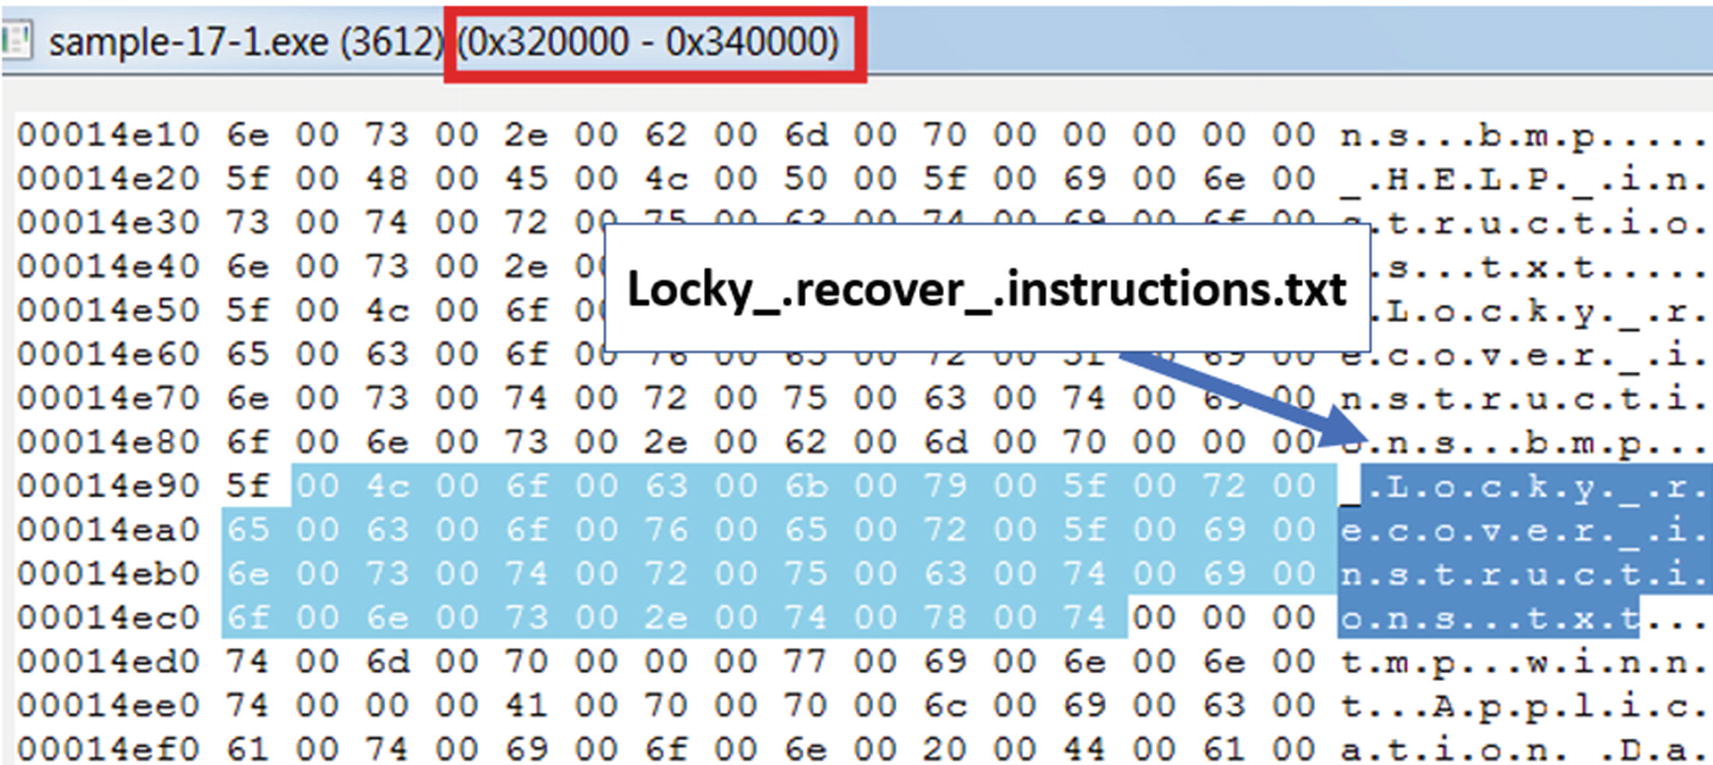
Strings from the memory region we suspected to hold the unpacked payload, shows us various strings that indicate it is unpacked and is most likely Lock ransomware
Some of the strings you are going to see in the memory region are Locky_.recover_.instructions.txt, &act=getkey&affid=, \_HELP_instructions.bmp, vssadmin.exe Delete Shadows /All /Quiet, all of which indicate that this is Locky ransomware.
Now since we have verified the location of payload, we can dump the payload to disk using OllyDumpEx for further analysis.
The address of the memory block holding the unpacked payload is going to change from system to system, and even when you restart the program on the same system like the memory allocated for the payload using VirtualAlloc() depends on the availability of the memory region at a particular point of time. But though the addresses might vary while you run and debug the sample on your system, the concepts we explained remain the same.
Are We Inside the Payload?
In the last section, we explained two tricks to reach the OEP in the payload of a UPX packed binary, one by using ESP trick and other by looking at the compiler stub pattern around the jump to OEP instruction. These tricks are specific to UPX and well tested, so we are sure that we have landed at the OEP. As malware analysts, we are certain to get malware that is packed by different kinds of packers. When debugging, are there any alternative ways for us to be sure that we have landed into the OEP or gone past the OEP and are now inside the unpacked payload?
One method that you can use is to look at the kind/type of API calls invoked in and around the code you have landed and are now debugging. If the Win32 API calls are related to usual malware related functionalities like file creation, process creation, registry changes, network activity around the code you are currently debugging, it indicates that you are probably located inside and around the unpacked payload.
Alternatively, using Process Hacker, you can also look at the memory region which bounds the OEP you have found out and check for various factors like memory permissions and strings analysis to figure out if it unpacked. For example, an unpacked payload has a decent amount of strings that can identify if it is malware. If the memory region of the code you are currently debugging in, has a decent amount of unpacked strings in Process Hacker, it indicates that you are currently debugging inside the unpacked payload.
Variations in Unpacking Techniques
The unpacking technique employed inside a packed sample is dependent on how the loaders work and vary between different packed binaries packed using different packers. For example, across different packer generated samples, the unpacked payload can be decompressed into different memory locations in the process memory. Sometimes it can be found in new memory locations allocated with the help of VirtualAlloc. Other times you might find that the payload has been written over the main module of the packed binary process, basically overwriting it, thereby not needing to allocate any new memory blocks.
Some other times the loaders can inject the compressed payload itself into another process along with another loader, where the final unpacking happens in the remote process. Some loaders can also decompress the entire payload into a single memory block while others can decompress and split the payload into different memory blocks. Some of the loaders also have various anti-debugging tricks embedded in them to dissuade analysis as well as debugging, which we cover in Chapter 19.
Hence a lot of times, you might have to figure out various new techniques and tricks to fast unpack samples because none of the tricks you already know might work. But the trick where you combine API logs from tools like APIMiner generally works great for most cases. Another great way to speed up the reverse engineering process is to automate various unpacking related tasks using tools built using binary instrumentation frameworks, which we talk about in Chapter 25 of this book.
Summary
In this chapter, we covered the internals of how packed samples unpack themselves and how the loader code goes through various stages to finally decompress the packed payload and write out the unpacked payload into memory and execute it. We covered various unpacking tricks that we can use while using debuggers to fast unpack samples. We explored using dynamic analysis tools like APIMiner and Process Hacker and combining it into our reverse engineering process to further accelerate the process of unpacking samples. We also covered how to use the OllyDumpEx plugin in OllyDbg to help dump the payload to a file on disk, which we can then analyze statically using various techniques.