
A process is defined as a program under execution. Whether a program is clean or malicious, it needs to execute as a process to carry out its desired intention. In this chapter, we go through the various steps involved in loading a program as a process. We also explore the various components of a process and understand important concepts like virtual memory, which is a memory-related facility that is abstracted by the operating system (OS) for all processes running on the system. We also dissect the PE file format, which is used by all executable files in Windows, and explore how its various headers and fields are used by the OS to load the PE executable program as a process. We also cover other types of PE files, such as DLLs, and explore how they are loaded and used by programs.
Process Creation
Simple Hello World C Program Compiled into Sample-4-1 in Our Samples Repo
To execute this program, you can start by renaming the file and adding an extension of .exe, after which it should now be named Sample-4-1.exe. Please note that all samples in this book in the sample repository don’t have the file extension for safety reasons, and some of the exercises might need you to add an extension suffix. Also, you need to make sure you have extension hiding disabled to add an extension suffix, as explained in Chapter 2.
Executing the Program

Windows Task Manager shows our Sample-4-1.exe process under execution
The preceding process was not created until we double-clicked on the .exe file in the folder. Do note that without the .exe file extension, double-clicking it wouldn’t launch it as a process because of no file association, as we learned in Chapter 3. The Sample-4-1.exe file is a program, and after double-clicking it, the OS created a process out of this program, as you can now see in the Task Manager. Let’s now dig into more details of our process using Process Hacker, a tool that substitutes as an advanced Task Manager. Alternatively, you can also use Process Explorer (an advanced task manager) to dissect processes running on your system.
To double-click and run a program as a process, the program should have an .exe extension. To add an extension to a file, you must Disable Extension Hiding in Windows, as explained in Chapter 2.
Exploring the Process with Process Hacker

Process Hacker tool
Each process has a name, which is the name of the program from which it was created. The process name is not unique in the list of processes. Two or more processes can have the same name without conflict. Similarly, multiple processes from the same program file can be created, meaning multiple processes may not only have the same name but the same program executable path.
To uniquely identify a process, each process is given a unique ID called the process ID, or PID, by the OS. PID is a randomly assigned ID/number, and it changes each time the program is executed even on the very same system.
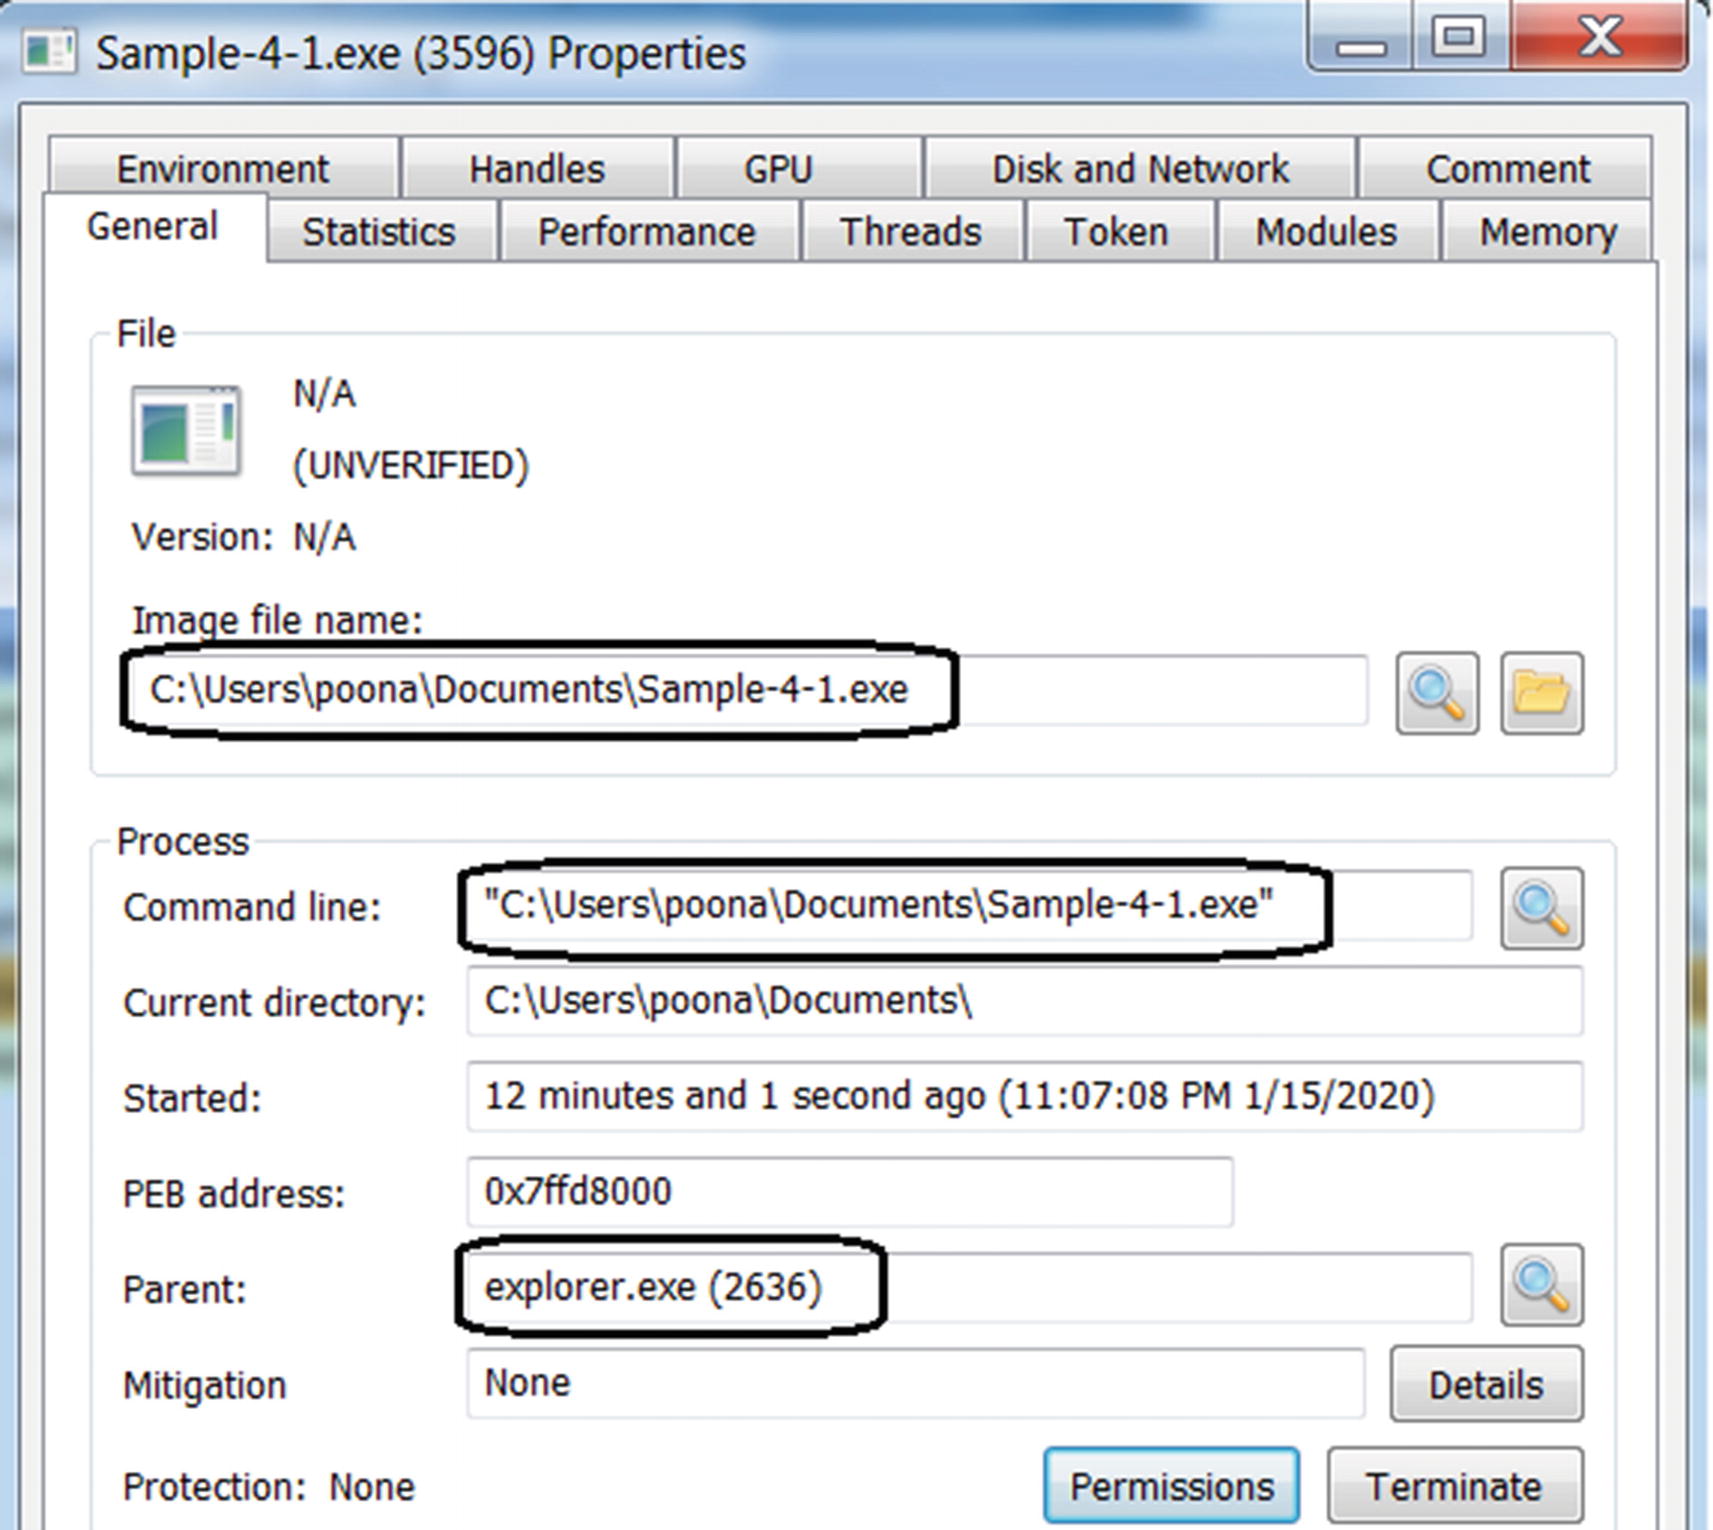
Properties window of a process by Process Hacker, with the General tab in view
As seen in Figure 4-3, the General tab displays information about how, when, and who has started the process.
Figure 4-3 shows the name and PID of the parent of our sample process as explorer.exe and 2636, respectively. How did explorer.exe end up as the parent of our process? We browse our folders and files on our Windows system using a graphical user interface. This user interface is rendered by Windows Explorer or File Browser, represented by the process explorer.exe. Using File Browser provided by explorer.exe, we double-clicked the Sample-4-1.exe program earlier to create a process out of it, thereby establishing explorer.exe as the parent of our Sample-4-1.exe process.
Other entries in the General tab to keep an eye on are Command-Line and Current Directory. The Command Line option shows the command line parameters provided to the process. While analyzing malware samples, it is important to keep an eye on the Command Line field since some malware accepts the command line to operate and exhibit malicious behavior. Without specific command-line options, malware may not function as intended, basically fooling analysts and anti-malware products. The Current Directory field shows the path to the root or the base directory which the process operates from.
In upcoming sections and chapters, we explore other aspects of a process, such as virtual memory, handles, mutexes, and threads, and investigate them via the various tabs and options provided by Process Hacker. You should familiarize yourself with an important tool called Process Explorer (installed in Chapter 2), which operates similarly to Process Hacker. Getting comfortable with these tools is important for malware analysis, and we encourage you to play with these tools as much as possible.
While dynamically analyzing malware, it’s very important to keep an eye on various processes started on the system, their parent processes, the command line used, and the path of the executable program.
Virtual Memory
Hardware has often posed a hindrance to creating cost-effective portable computers since inception. To overcome some of these constraints, computer scientists have often invented software-based solutions to simulate the actual hardware. This section talks about one such solution called virtual memory that has been implemented to abstract and simulate physical memory (RAM). Fritz-Rudolf Güntsch invented the concept of virtual memory, and it has been implemented in all modern operating systems today.
Virtual memory is a complex topic, and to get a better understanding of it, we recommend any OS book. In this section, we simplify this topic and explain it from a malware analysis perspective and reverse engineering workflow.
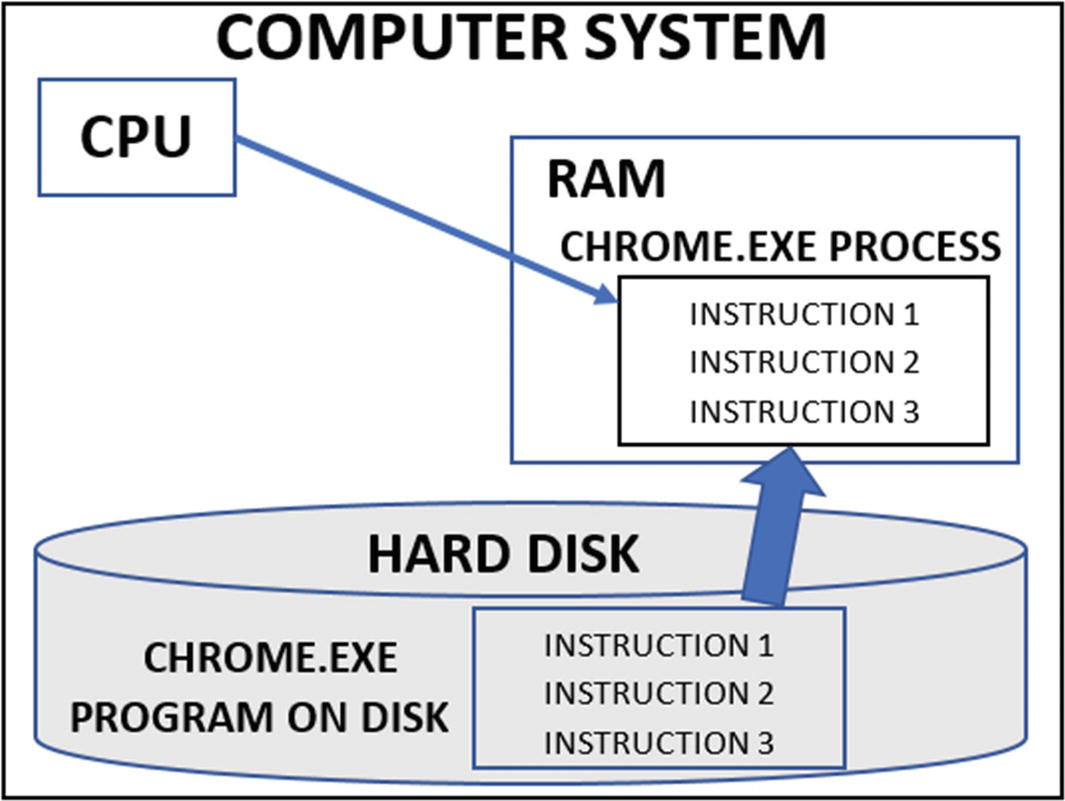
CPU executing a process after loading its program into RAM from hard disk
RAM is inexpensive today, but in the earlier days, it was expensive compared to a hard disk. Early computers were not meant for daily use by the common man. At the same time, they ran a limited number of processes compared to now. So, a limited amount of RAM could serve the purpose. But as processing needs evolved, computers were pushed to execute many more complex processes, thus pushing the requirement for a larger capacity RAM. But RAM was very expensive and limited, especially while compared to the hard disk. To the rescue virtual memory.
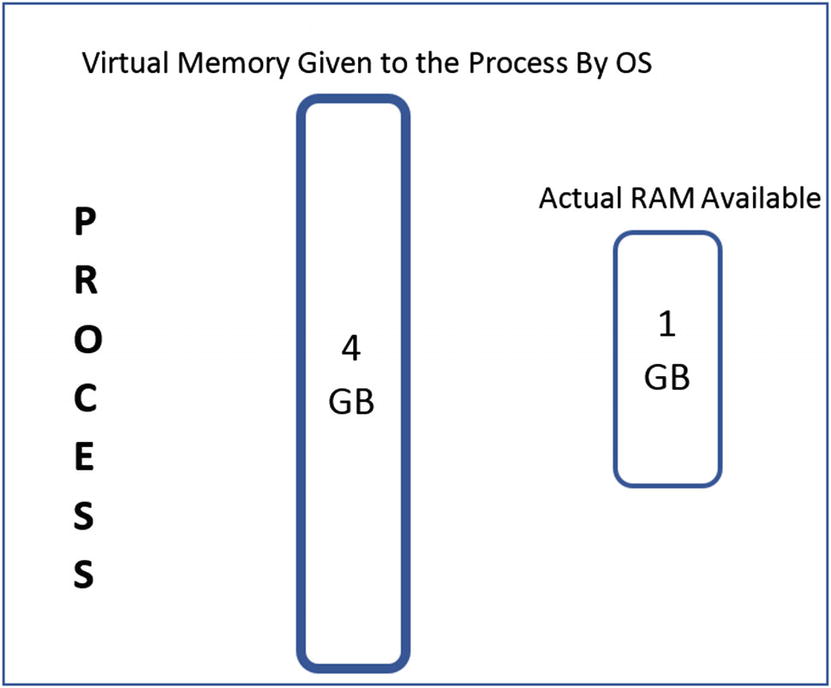
Virtual memory giving an illusion of more memory than what is physically available
Each process can see a fixed amount of memory or rather virtual memory, which is assigned to it by the OS, irrespective of the actual physical size of the RAM. As seen in Figure 4-5, though the system has 1 GB of physical memory, the OS gives the process 4 GB of exclusive virtual memory.
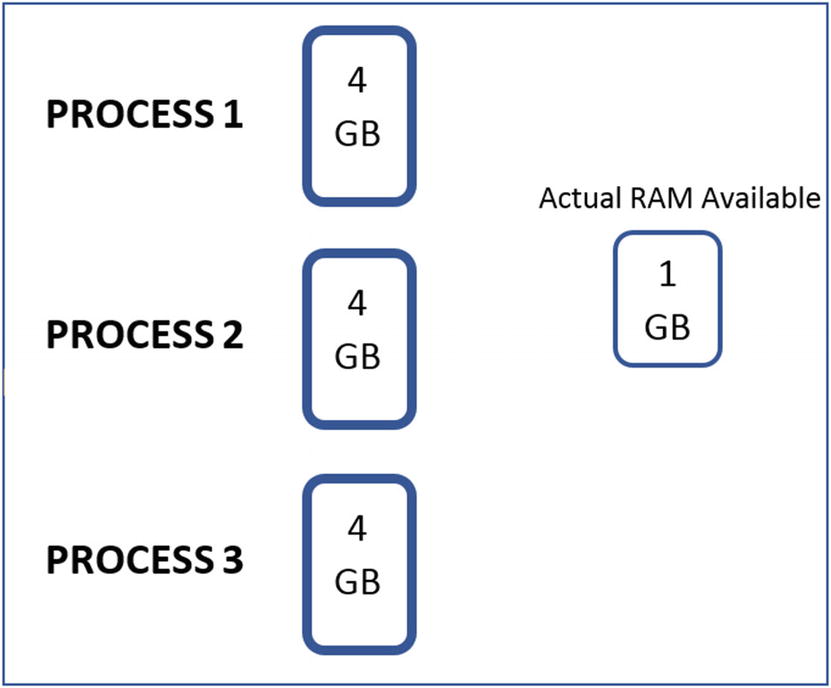
The same fixed amount of virtual memory made available to all processes
In the next section, we go into the details on how virtual memory is implemented in the background and explore concepts like pages that make this whole virtual memory concept possible.
Addressability
Virtual memory, just like physical memory or the RAM, is addressable (i.e., every byte in memory of the process has an address). An address in virtual memory is called a virtual address, and an address in physical memory or RAM is called a physical address. With 4 GB of virtual memory, the address starts at 0 and ends at 4294967295(2^32 – 1). But while dealing with various tools in malware analysis and reverse engineering, the address is represented in hex. With 32 bits used for the address, the first byte is 0x00000000 (i.e., 0), and the last byte is 0xFFFFFFFF (i.e., 4294967295(2**32 – 1)). Physical memory is also similarly addressable, but it is not of much importance since we always deal with virtual memory during the analysis process.
Memory Pages
The OS divides the virtual memory of a process into small contiguous memory chunks called pages. The size of a page is determined by the OS and is based on the processor architecture, but typically, the default page size is 4 KB (i.e., 4096 bytes).
Pages do not only apply to virtual memory but also physical memory. In the case of physical memory, physical memory is also split into these page-sized chunks called frames . Think of frames as buckets provided by physical memory that pages of process virtual memory can occupy.
To understand how a process’s memory translates to pages, let’s take the example of a program, which is made up of both data and instructions, which are present as part of the program PE file on disk. When the OS loads it as a process, the data and instructions from the program are transferred into memory by splitting it into several pages.
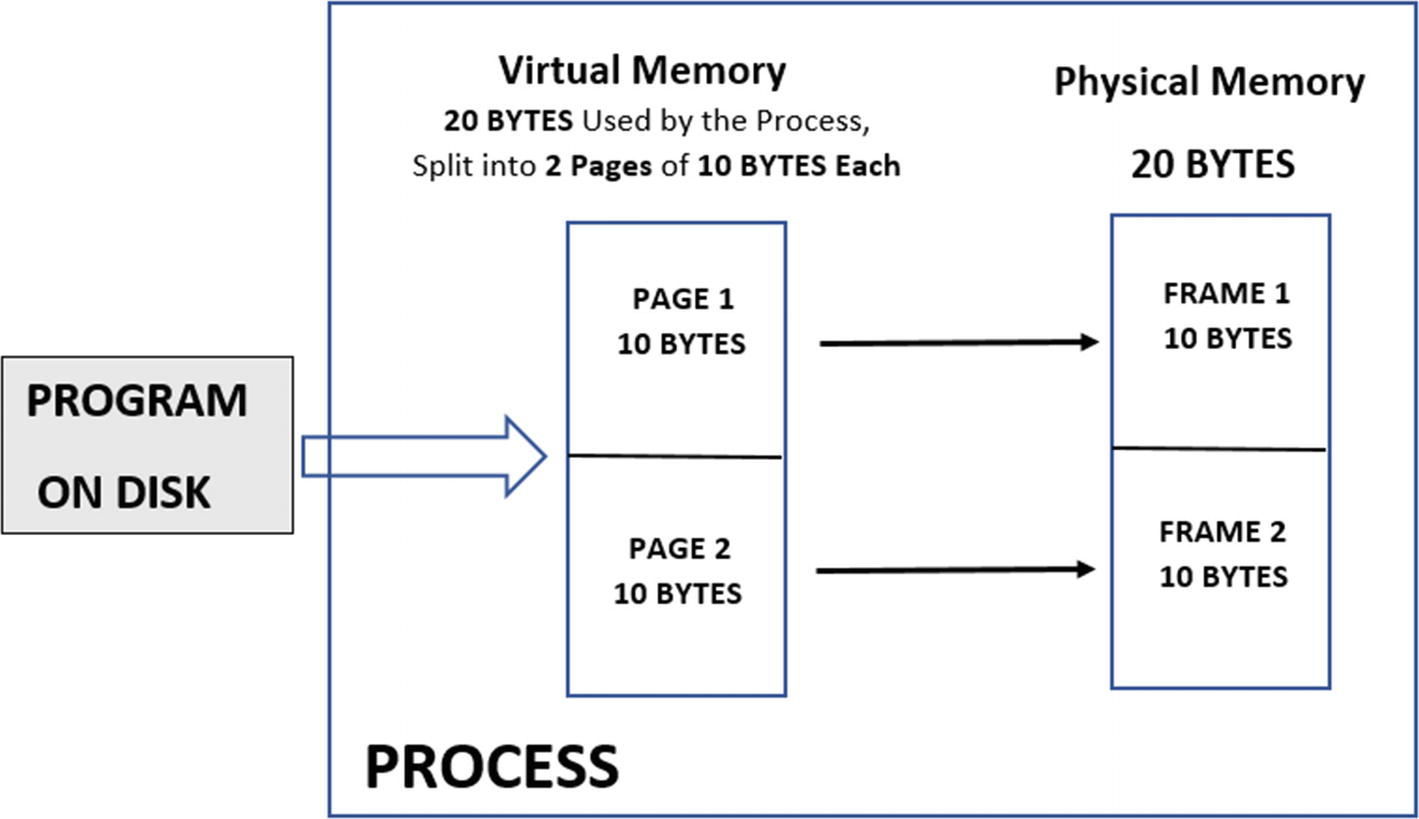
The memory of a process split and stored in pages/frames in virtual/physical memory
Demand Paging
Continuing from where we left off in the previous section, we have 20 bytes of physical RAM available on the system and Process1 using 20 bytes of virtual memory, which in turn ends up taking actual 20 bytes of physical memory as seen in Figure 4-7. Now there is a one-to-one mapping between the amount of virtual memory used by Process1 and the physical memory available on the system. Now, in comes another new process Process2, which now requests 10 bytes of virtual memory. Now the OS can assign one virtual memory page of 10 bytes to this process. But all the physical memory is occupied by frames of Process1. How would this new process run with no free physical memory available on the system? In comes demand paging and the page table.
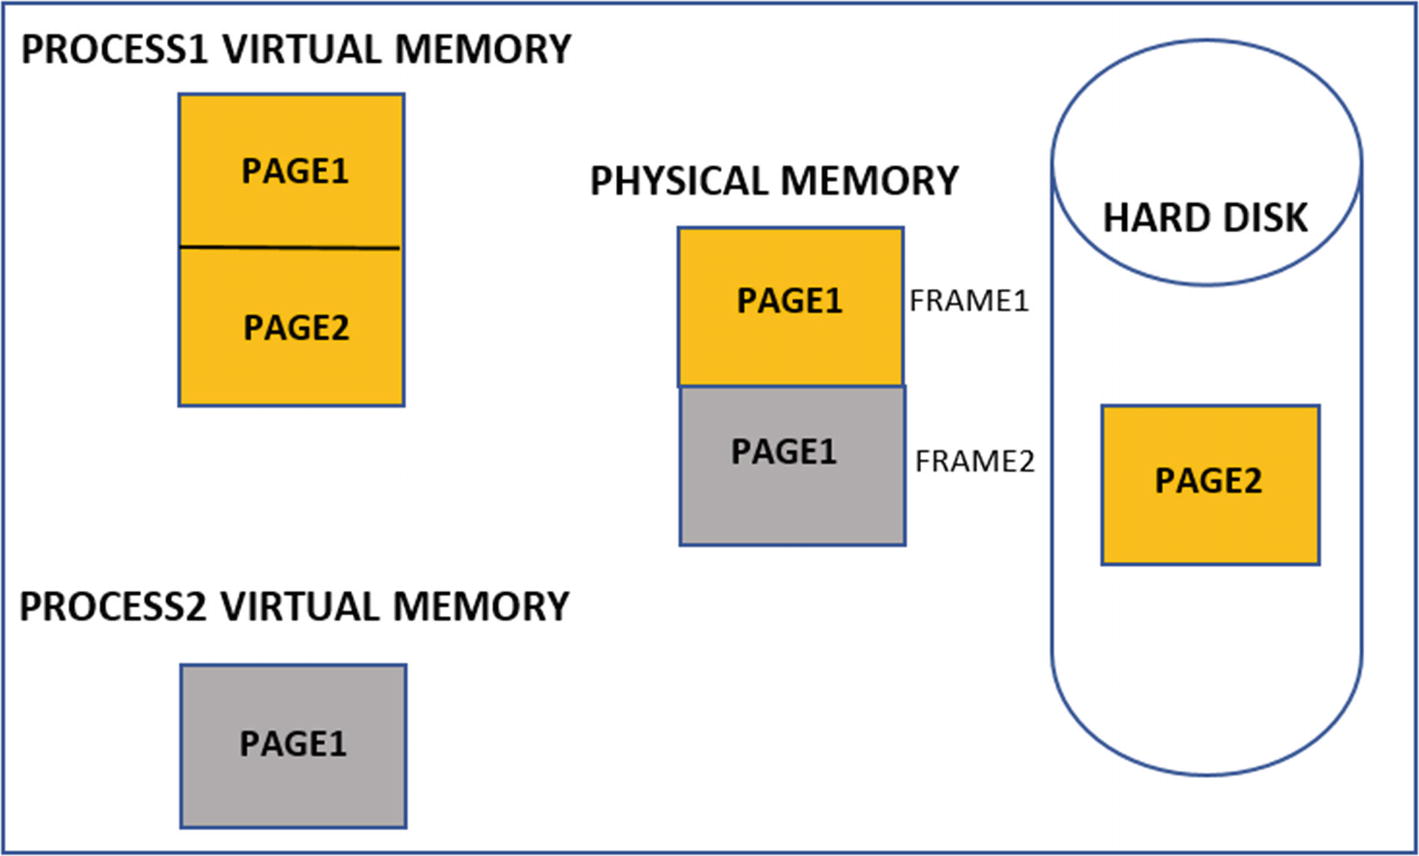
Demand paging allowing pages from multiple processes to use RAM simultaneously
But what happens if Process1 needs Page2 again in physical memory? Since Page2 is not currently mapped in any frame in the RAM, the OS triggers a page fault. This is when the OS swaps out from the RAM another idle page from the same or another process. Page2 of Process1 swaps back into RAM from the hard disk. Generally, if a page is not used in RAM for a long time, it can be swapped out to the hard disk to free the frames up for use by other processes that need it.
Page Table
virtual memory is an abstract memory presented by the OS, and so is the case with a virtual address. But while the CPU runs the instructions of the processes and accesses its data all using their virtual addresses, these virtual addresses need to be converted to actual physical addresses, since the physical address is what the CPU understands and uses. To translate the virtual address of a process into the actual physical address on physical memory, the OS uses a page table.

Page table to map pages in virtual memory to frames on physical memory
Division of Virtual Memory Address Space
You already saw that the virtual memory of a process is split into pages. Windows splits the address range of each process’s virtual memory into two areas: the user space and the kernel space. In 32bit Windows offering 4 GB virtual memory per process, the total addressable range is 0x00000000 to 0xFFFFFFFF. This total range is split into user space and kernel space memory by the OS. By default, the range 0x00000000 to 0x7FFFFFFF is assigned to user space and 0x80000000 to 0xFFFFFFFF.
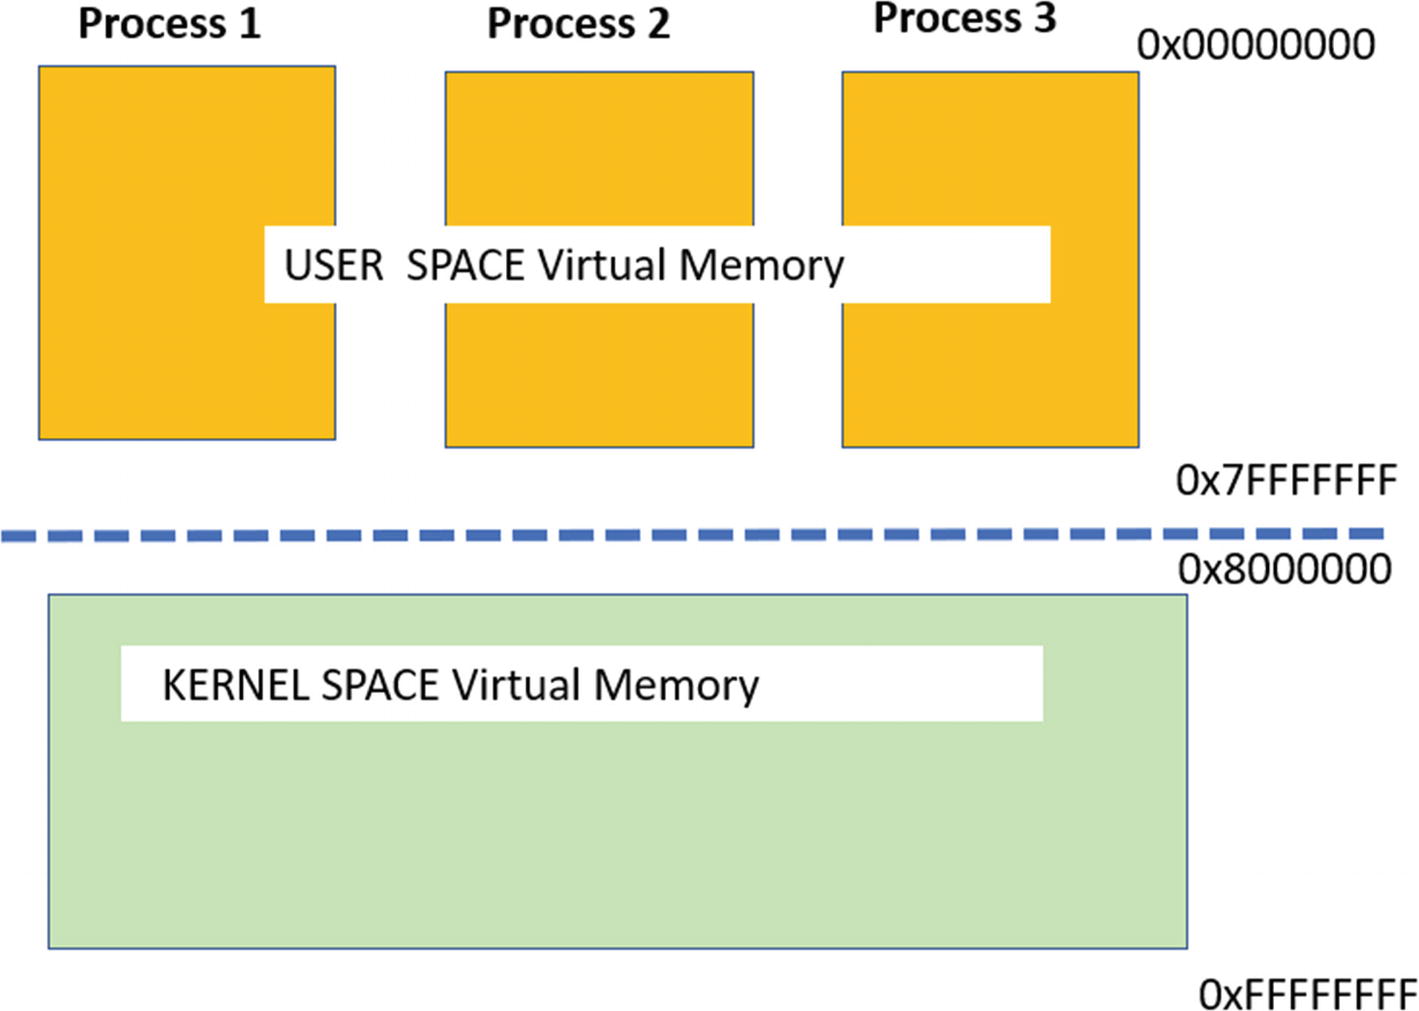
Division of virtual memory of a process into User and Kernel Space
Inspecting Pages Using Process Hacker
Resources in virtual memory are split across multiple pages, including code and data. A page can have various properties, including having specific protection (permissions) and type (state). Some of the best tools to visualize pages and view their properties are Process Hacker and Process Explorer. Using Process Hacker, you can view the virtual memory structure of a process, in the Memory tab of the Properties window of a process.

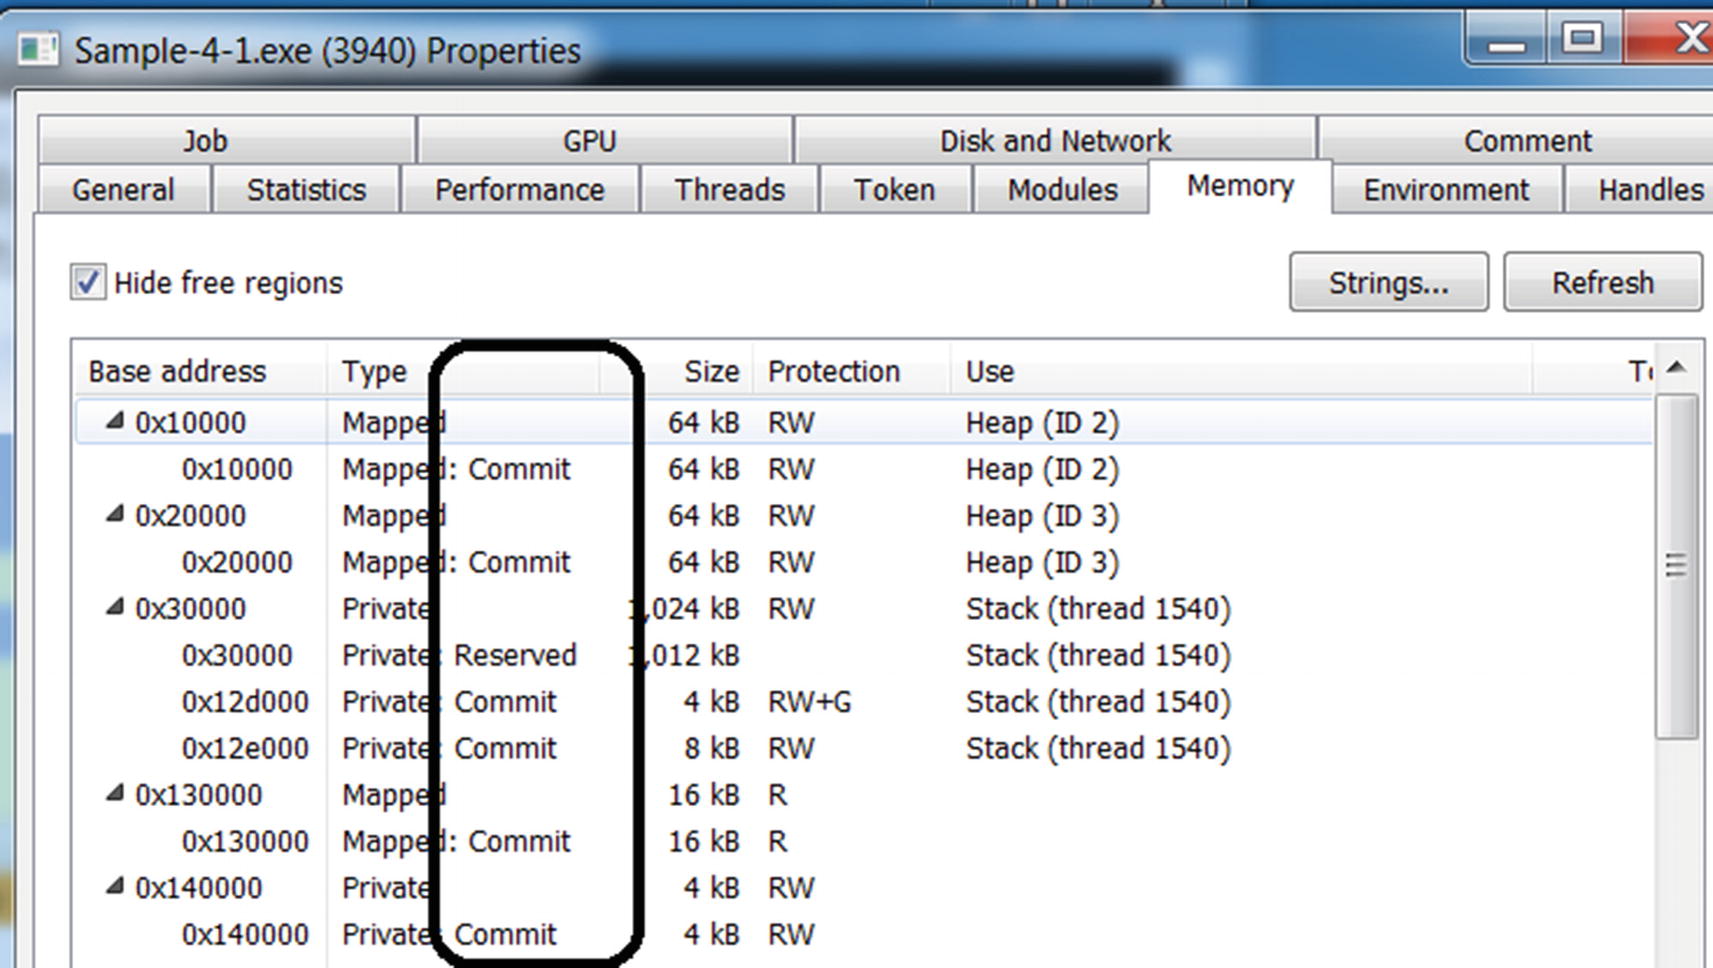
Visualization of a process’ memory and its various properties by Process Hacker

The Type of a page as shown by Process Hacker
The virtual memory of the process we are looking into using Process Hacker is only the user-space address. Process Hacker does not display the kernel space of the address. We use a Windows 7 32-bit OS. You see a different address space range with a 64-bit OS.
Types of Pages
Private pages: These pages are exclusive to the process and are not shared with any other process. For example, the pages holding a process stack, Process Environment Block (PEB), or Thread Environment Block (TEB) are all exclusive to a process and are defined as private pages. Also, pages allocated by calling the VirtualAlloc() API are private and are primarily used by packers and malware to hold their decompressed data and code. Private pages are important for us as you learn to dissect a malware process using its memory in later chapters.
Image pages: These pages contain the modules of the main executable and the DLLs.
Mapped pages: Sometimes, files or parts of files on the disk need to be mapped into virtual memory for use by the process. The pages that contain such data maps are called Mapped. The process can modify the contents of the file by directly modifying the mapped contents in memory. An alternate use of mapped pages is when a part of its memory needs to be shared with other processes on the system.
Using Process Hacker, we can view the types of pages in the Memory tab, as seen in Figure 4-12.
States of a Page
Reserved: A reserved page has virtual memory allocated in the process but doesn’t have a corresponding physical memory allocated for it.
Committed: A committed page is an extension of reserved pages, but now these also have the physical memory allocated to it.
Free: Free pages are address ranges for pages in virtual memory that are not assigned or made available to the process yet.
The State of a page as shown by Process Hacker
Page Permissions
Read: Contents of the page can be read, but you can’t write into this page, nor any instructions can be executed from this page.
Write: The contents of the page can be read, as well as the page can be written into.
Execute: Most likely, the page contains the code/instructions, and they can be executed.
A page that has execute permission does not indicate that it contains only code or instructions that need to be executed. It can contain nonexecutable data, as well.
A page can have a combination of permissions: R, RW, RWX, and RX. The program and the OS decide the page permission of a region in memory. For example, the stack and the heap of a process are meant to store data only and should not contain executable code, and hence the pages for these two should only have permissions RW. But sometimes exploits use the stack to execute malicious code and hence give the stack execute privileges as well, making it RWX. To avoid such attacks, Microsoft introduced Data Execution Prevention (DEP) to ensure that the pages in a stack should not have executable permissions.
The minute OS-related details are needed by malware analysts, reverse engineers, and detection engineers who write malware analysis and detection tools. Often page properties, permissions, and so forth are used in identifying injected and unpacked code in malware scanning and forensic tools, as you will learn in later chapters.
Strings in Virtual Memory
The memory of a process has a lot of data that is consumed by a process during execution. Some of the data in memory are human-readable strings like URLs, domain names, IP addresses, file names, names of tools, and so forth. You can view the data present in the various pages by double-clicking a memory block in Process Hacker’s Memory tab.

Viewing the contents of a Memory Block using Process Hacker
Figure 4-14 shows the memory block. The first column is the offset of the data from the start address of the memory block. The second column displays the data in hex form, and the third column shows the printable ASCII characters, otherwise known as strings.
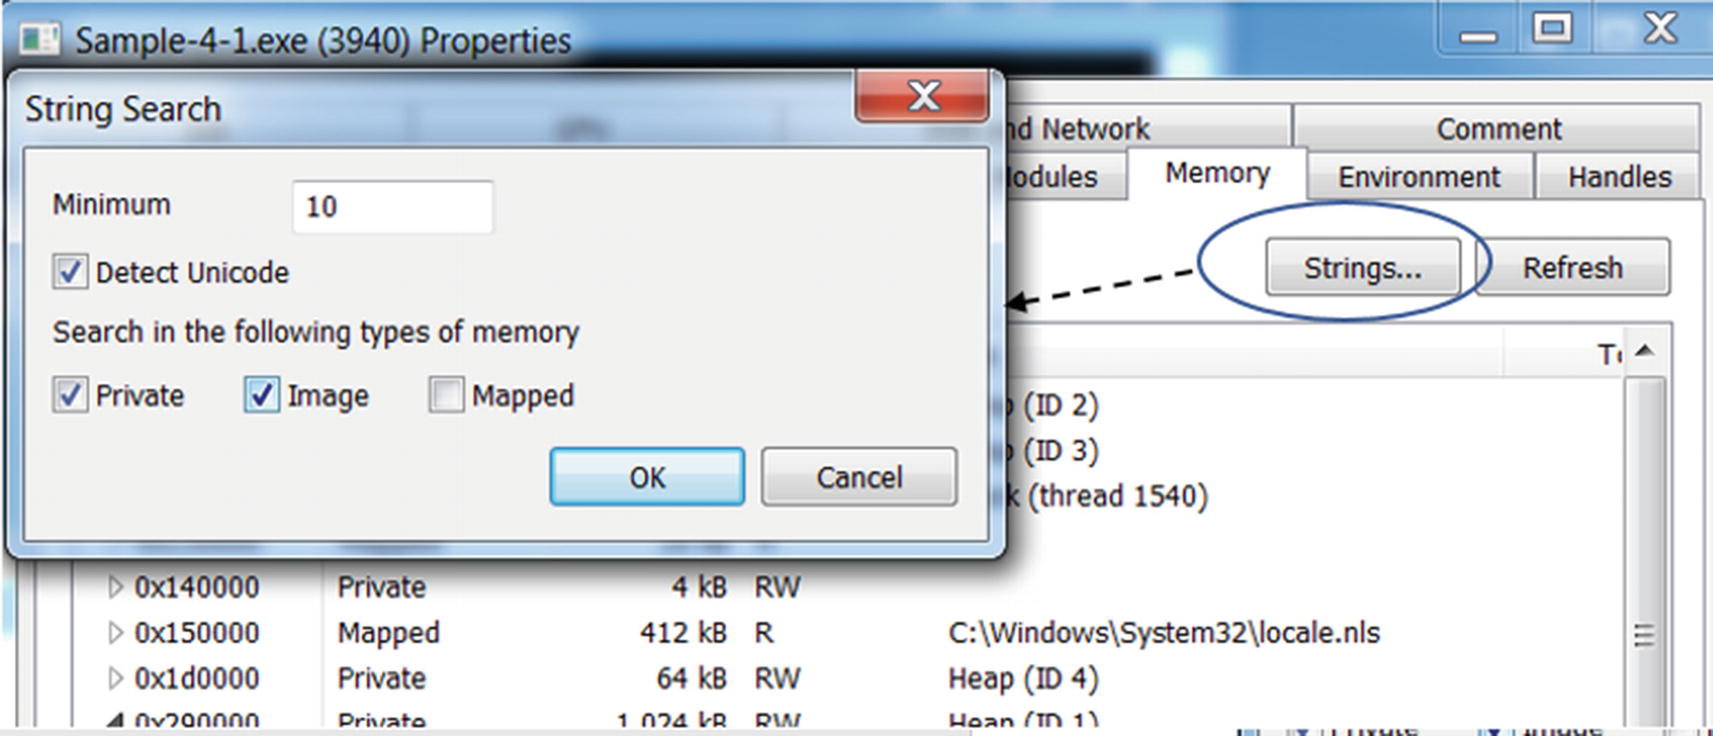
The Strings option in Process Hacker
The strings displayed by Process Hacker for private and image pages
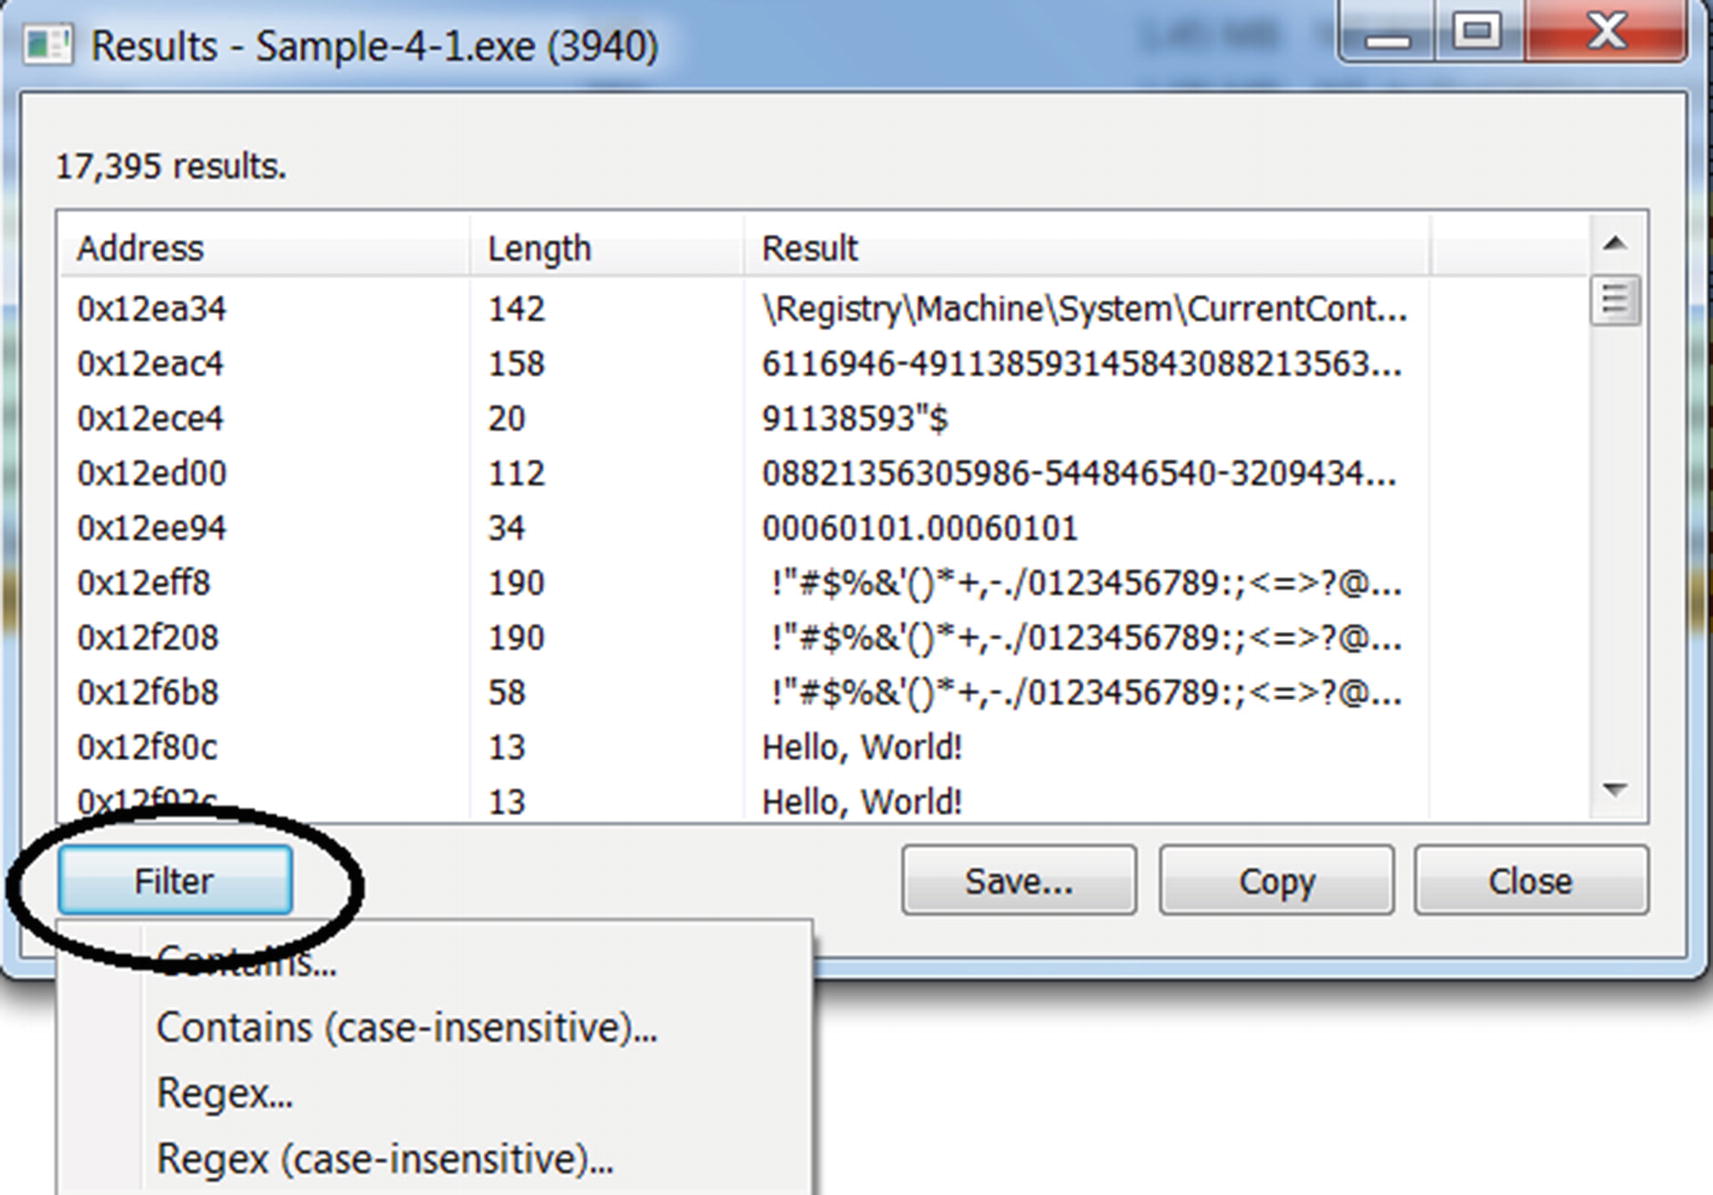
It also provides a Filter option, as seen in Figure 4-16, using which you can filter and only display strings matching a particular pattern or regular expression. We recommend you to play around with these various options to view the contents of a process’ memory and its strings, as this forms the foundation for a lot of our malware analysis process in our later chapters.
Using Virtual Memory Against Malware
Virtual memory provides extensive information for malware detection. You learn in Chapter 7 that encrypted or packed malware files need to decode themselves into the virtual memory at some point in time in their execution phase. Tapping into the virtual memory of a running malware can get you the decrypted malware code and data without much effort.
The virtual memory now with the decrypted malware code and data can contain important strings related to malware artifacts like malware name, hacker name, target destinations, URLs, IP addresses, and so forth. Many of these artifacts provide an easy way to detect and classify malware, as you will learn in the chapters on dynamic analysis and malware classification.
Many times, malware does not execute completely due to unsuitable environments, or the malware has suspected that it is being analyzed, or other reasons. In that case, strings can be helpful sometimes to conclude that the sample is malware, without having to spend time on reverse-engineering the sample.
One can also identify if code has been unpacked (more on this in Chapter 7) or injected (more on this in Chapter 10) by malware using the permissions/protections of memory blocks. Usually, injecting code malware allocates executable memory using various APIs that end up being allocated as private pages with read, write, and execute (RWX) protection, which is a strong indicator of code injection or unpacking.
So far, we have looked at a process and its properties in its virtual memory. In the next section, let’s go through the PE file format used by executable programs that are the source of these processes, and how they contain various fields and information that helps the OS loader create a process and set up its virtual memory.
Portable Executable File
At the start of this chapter, we showed you a listing for C code, which we compiled to generate an .exe program available as Sample-4-1. Running this program file created a process for it and loaded it into memory, as visible in Process Hacker. But who loaded this program file from the disk into memory, turning it into a process? We explained that it was the OS, but the specific component of the OS that did it is called the Windows loader. But how does the Windows loader know how to load a program as a process, the size of virtual memory it needs, where in the program file the code and the data exist, and where in virtual memory to copy this code and data?
In Chapter 3, you learned that every file has a file format. So does an executable file on Windows, called the PE file format. The PE file format defines various headers that define the structure of the file, its code, its data, and the various resources that it needs. It also contains various fields that inform how much of virtual memory it needs when it is spawned into a process and where in its process’s memory to copy its various code, data, and resources. The PE file format is a huge structure with a large number of fields.

The contents of a PE file as seen in a Notepad++ hex-editor
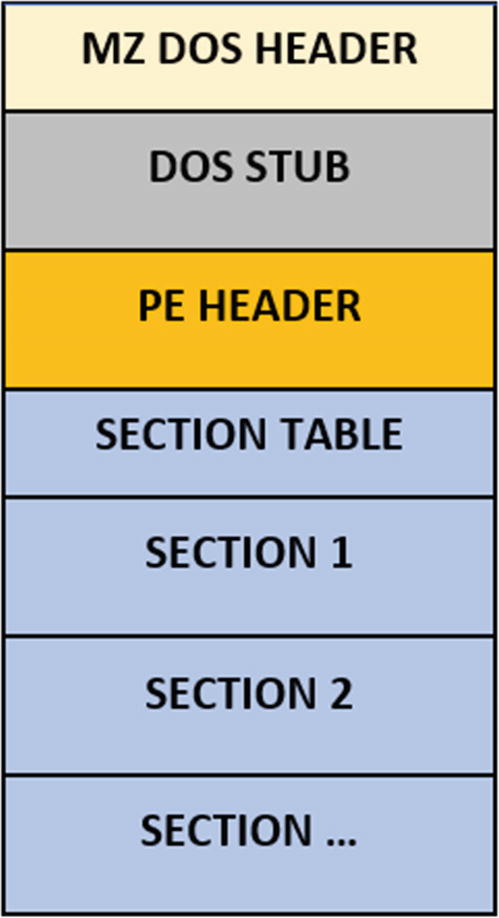
High-level structure of a PE file: its headers and sections
The first two characters that strike our attention are MZ. We have learned in Chapter 3 that these are magic bytes that identify it as an executable Windows file. MZ refers to Mark Zbikowski, who introduced MS-DOS executable file format. A Windows executable can also run on DOS. This Windows executable is called a portable EXE, or PE file. PE files can further be subgrouped as .exe, .dll, and .sys files, but we need to look deeper into the PE file contents and headers to determine this subgroup detail out.
But digging deeper into the PE file to figure out its various details in a simple hex editor is a tedious task. There are tools available that parse PE files and display their inner headers and structure. In the next few sections, we go through the PE file format using tools like CFF Explorer and look at the various fields that we encounter in the malware analysis and reverse engineering process.
Exploring Windows Executable
The PE file has two components: the headers and the sections. The headers are meant to store meta information, and the sections are meant to store the code, data, and the resources needed by the code to execute. Some of the meta-information stored by the headers include date, time, version of the PE file. The headers also contain pointers/offsets into the sections where the code and the data are located.
To dissect the contents of the PE file, we use the tool CFF Explorer (see Chapter 2). There are alternate tools as well, PEView and StudPE being the most popular ones. You can use a tool that you feel comfortable with. In this book, we use CFF Explorer.
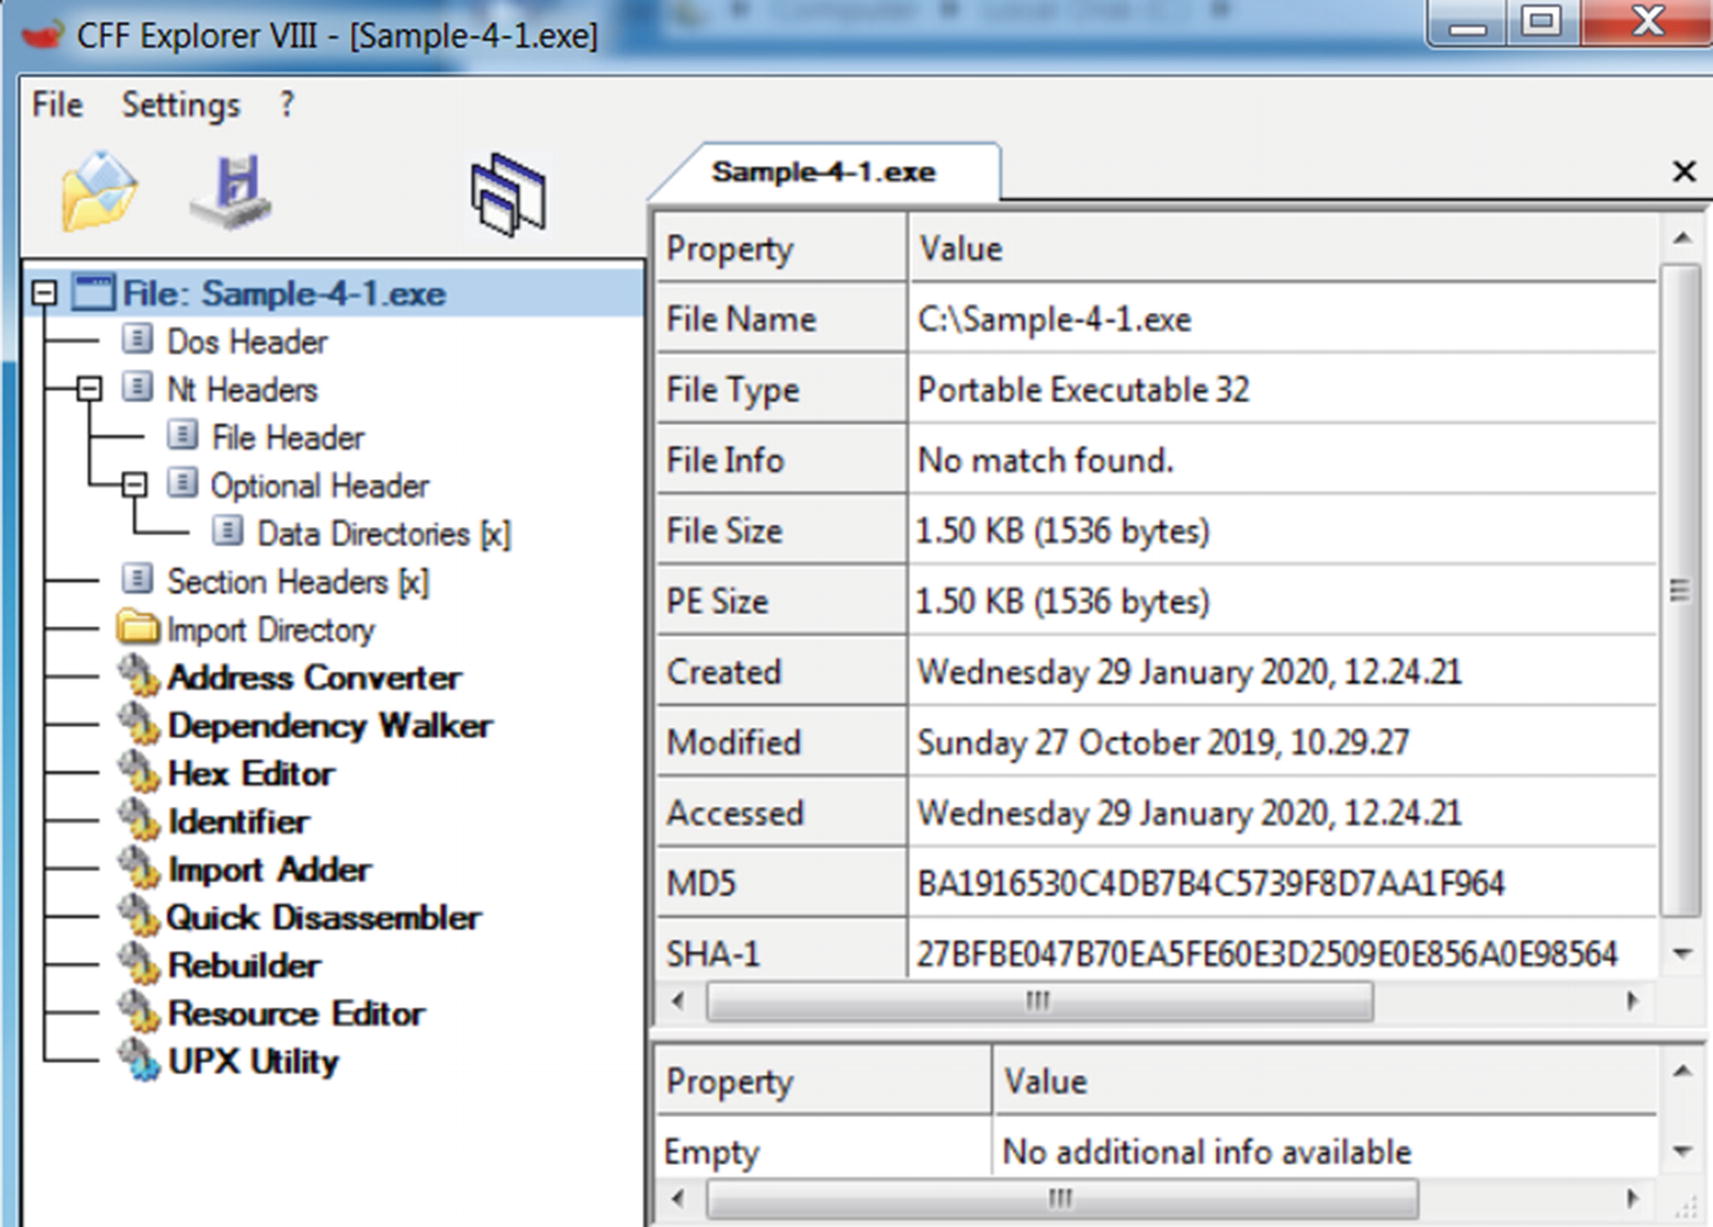
Sample-4-1 PE file opened using CFF Explorer
Opening an executable program(PE file) in CFF Explorer does not create a process for the sample program. It is only reading the contents of the PE file and displaying to us its structure and contents
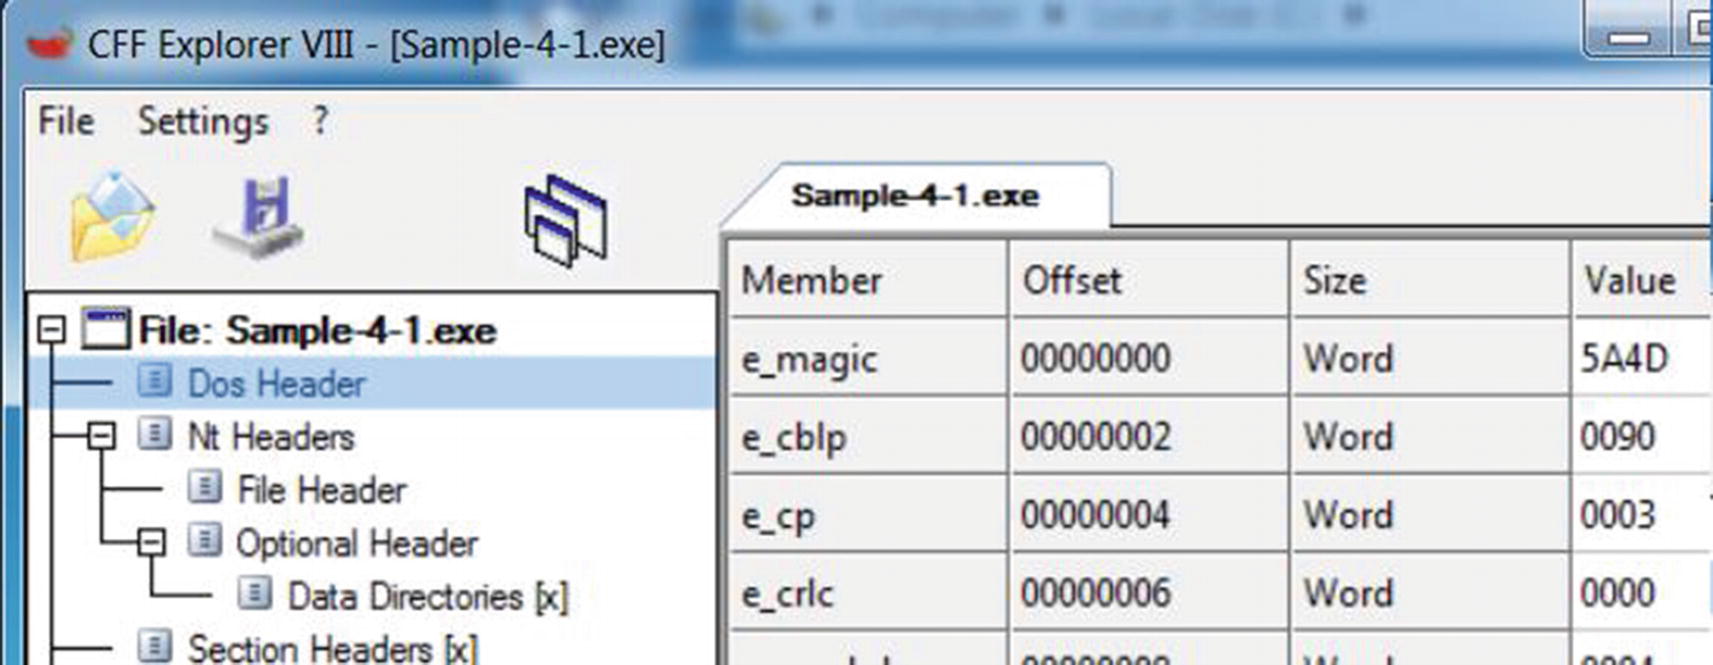
Dos Header fields of Sample-4-1 PE file shown using CFF Explorer
Member displays the name of the field. In Figure 4-20, the name of the first field e_magic, which holds as value the magic bytes that identifies the PE file format. The e_magic field is the same field that holds the MZ magic bytes at the start of the file, as shown in Figure 4-17 and Chapter 3.
Offset states the distance in the number of bytes from the start of the file. The e_magic field holds the value MZ, which are the first two bytes of the file (i.e., located at the very beginning of the file). Hence, it holds an offset value of 0(00000000).
Size tells the size of the field’s value (in the next column). The e_magic field is shown to have a size of a word, which is 2 bytes.
Value contains the value of the field. Value can contain the data itself, or it can contain the offset to the location in the virtual memory (we explain this in the “Relative Virtual Address” section), which contains the actual data. The value can be numerical or string. Numerical data can be an offset, size, or representation of some data. An example of a string is the value of e_magic, which is 5A4D. This is the equivalent of the ASCII string ZM but with the order reversed. (In the next section, we talk about why CFF Explorer displays it as 5A4D (i.e., ZM) instead of 4D5A (i.e., MZ).
Endianness
Let us look at the same e_magic field from Figure 4-20, which is the first field of the PE file and holds the first two bytes of the file. The value of this field is listed as 5A4D. But if you open the file using Notepad++ Hex Editor, you see the first two bytes as 4D5A (i.e., the bytes are reversed). Why is CFF Explorer showing it in the reverse order? It is because of a concept called endian , which is a way to store data in computer systems. The data can be stored in little-endian or big-endian format. In a PE file targeted to run on Windows, the field values are stored in little-endian format. In little-endian, the least significant byte of a field has the lowest address. In big-endian, the most-significant byte of a field occupies the lowest address.
The PE file format in Windows follows the little-endian scheme for storing various values in its fields. The value of e_magic field is shown as 5A4D (ZM), but the actual bytes in the file is 4D5A (MZ), where the value 4D has the lower address/offset in the file (i.e., offset 0) and the value 5A is at offset 1, as we can see in Figure 4-17. But CFF Explorer parses this value in little-endian format, which swaps the order while displaying it to us.
Endianness is a well-documented topic in computer science. You can find many resources that describe it in more detail. We recommend that you thoroughly understand how endianness works, and as an exercise, play around with some of the other header fields in CFF Explorer and Notepad++ Hex Editor to see how the data is represented in the file in comparison to how it’s displayed to you.
Image Base

ImageBase field under Optional Header of a PE file
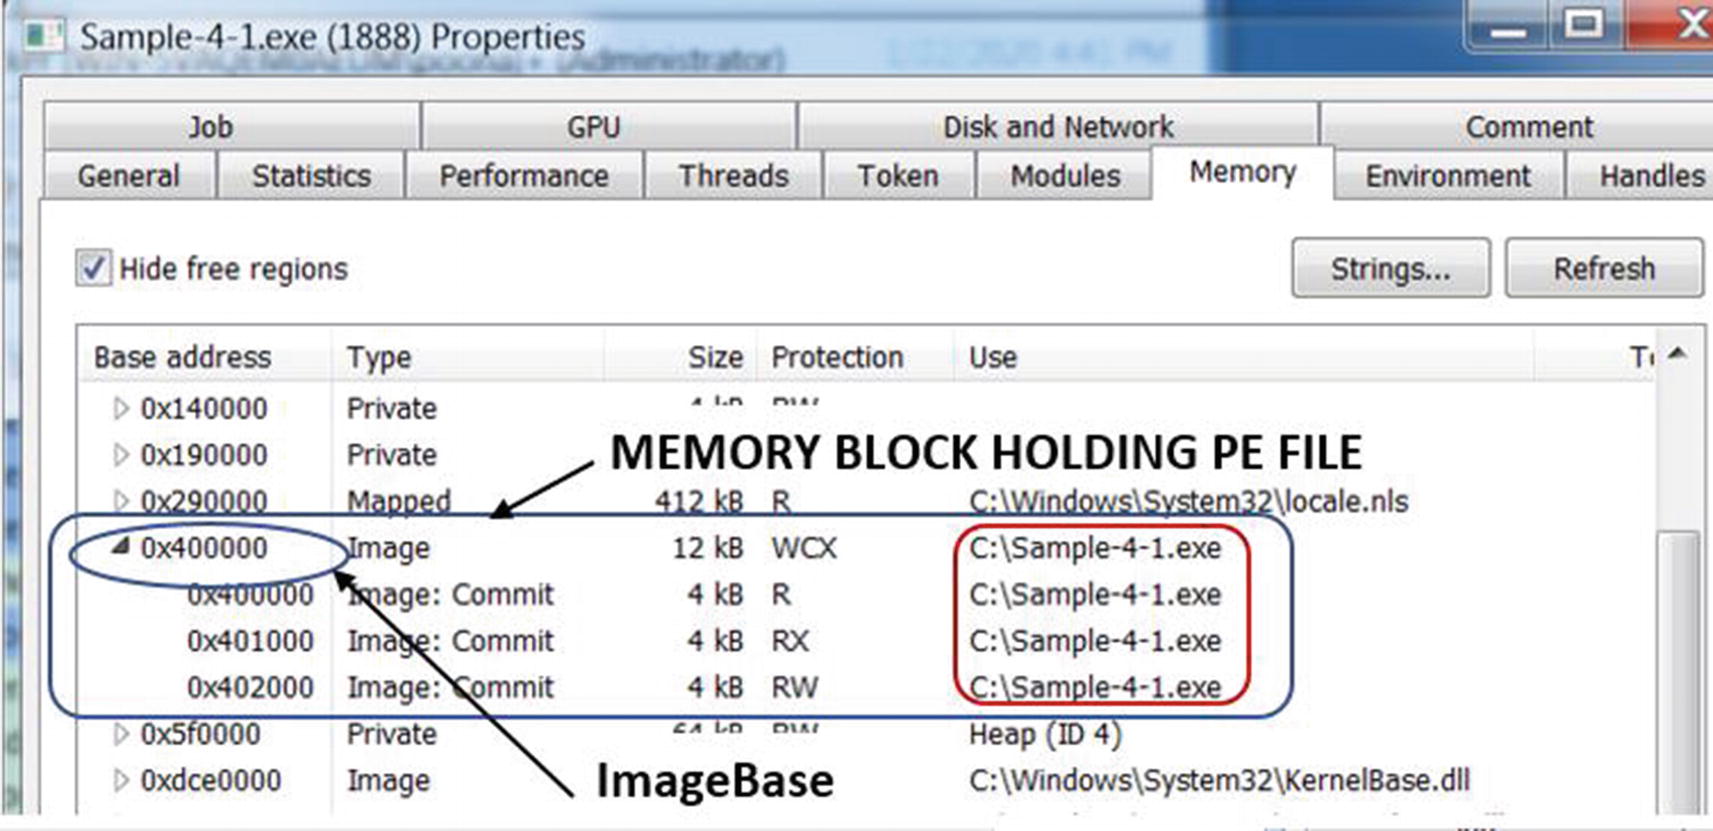
Locating the memory block and image base of Sample-4-1.exe PE file in memory
As seen in Figure 4-22, you can observe the 0x400000 starting address of the memory block for the Sample-4-1.exe PE file in virtual memory, matches the same values in the ImageBase field for the same file in Figure 4-21.
The Catch
There is a catch to what we explained in the previous section. The Windows loader uses the value of the virtual address in the ImageBase field as a recommendation for the starting address at which it should allocate space to load the PE file. But why is this a recommendation? Why can’t the Windows loader always allocate memory starting at this address?
If the memory in the process’s virtual address is already occupied by other contents, then the loader can’t use it to load the PE file. It can’t relocate the existing data into another address location and put the PE file at the image base location.
Instead, it finds another empty chunk of memory blocks, allocates space there, and copies the PE file and its content into it, resulting in a different image base for the PE file’s contents.
Relative Virtual Address (RVA)
We just learned that the PE file is loaded into the virtual memory at the image base. The PE file contains various fields and data that aim to point at various other data and fields at various addresses within its virtual memory. This makes sense if the actual loaded image base address of the process in virtual memory is the same as the image base that the process PE file recommends in its Optional Header ImageBase field. Knowing that the image base in virtual memory is now fixed, various fields can reference and use the addresses it needs with respect to this fixed image base. For example, if the image base in the header is 0x400000, a field in the headers can point to an address in its virtual memory by directly using an address like 0x400020, and so on.
But then we learned of the catch in the previous section. The ImageBase value in the Optional Header is a recommendation. Though it holds a value of 0x400000, the loader might load the entire file, starting at an image base address of 0x500000. This breaks all those fields in the PE file that directly use an absolute address like 0x400020. How is this problem solved? To the rescue relative virtual address (RVA).
With RVA, every reference to an address in virtual memory is an offset from the start of the actual image base address that the process is loaded in its virtual memory. For example, if the loader loads the PE file at virtual memory address starting at 0x500000, and a field/value in the PE file intends to reference data at address 0x500020, it achieves this by using 0x20 as the value of the field in the PE file, which is the offset from the actual image base. To figure out the true address, all the processes and the loader must do is add this offset 0x20 to the actual image base 0x500000 to get the real address 0x500020.

The RVA value held in AddressOfEntryPoint field under Optional Header
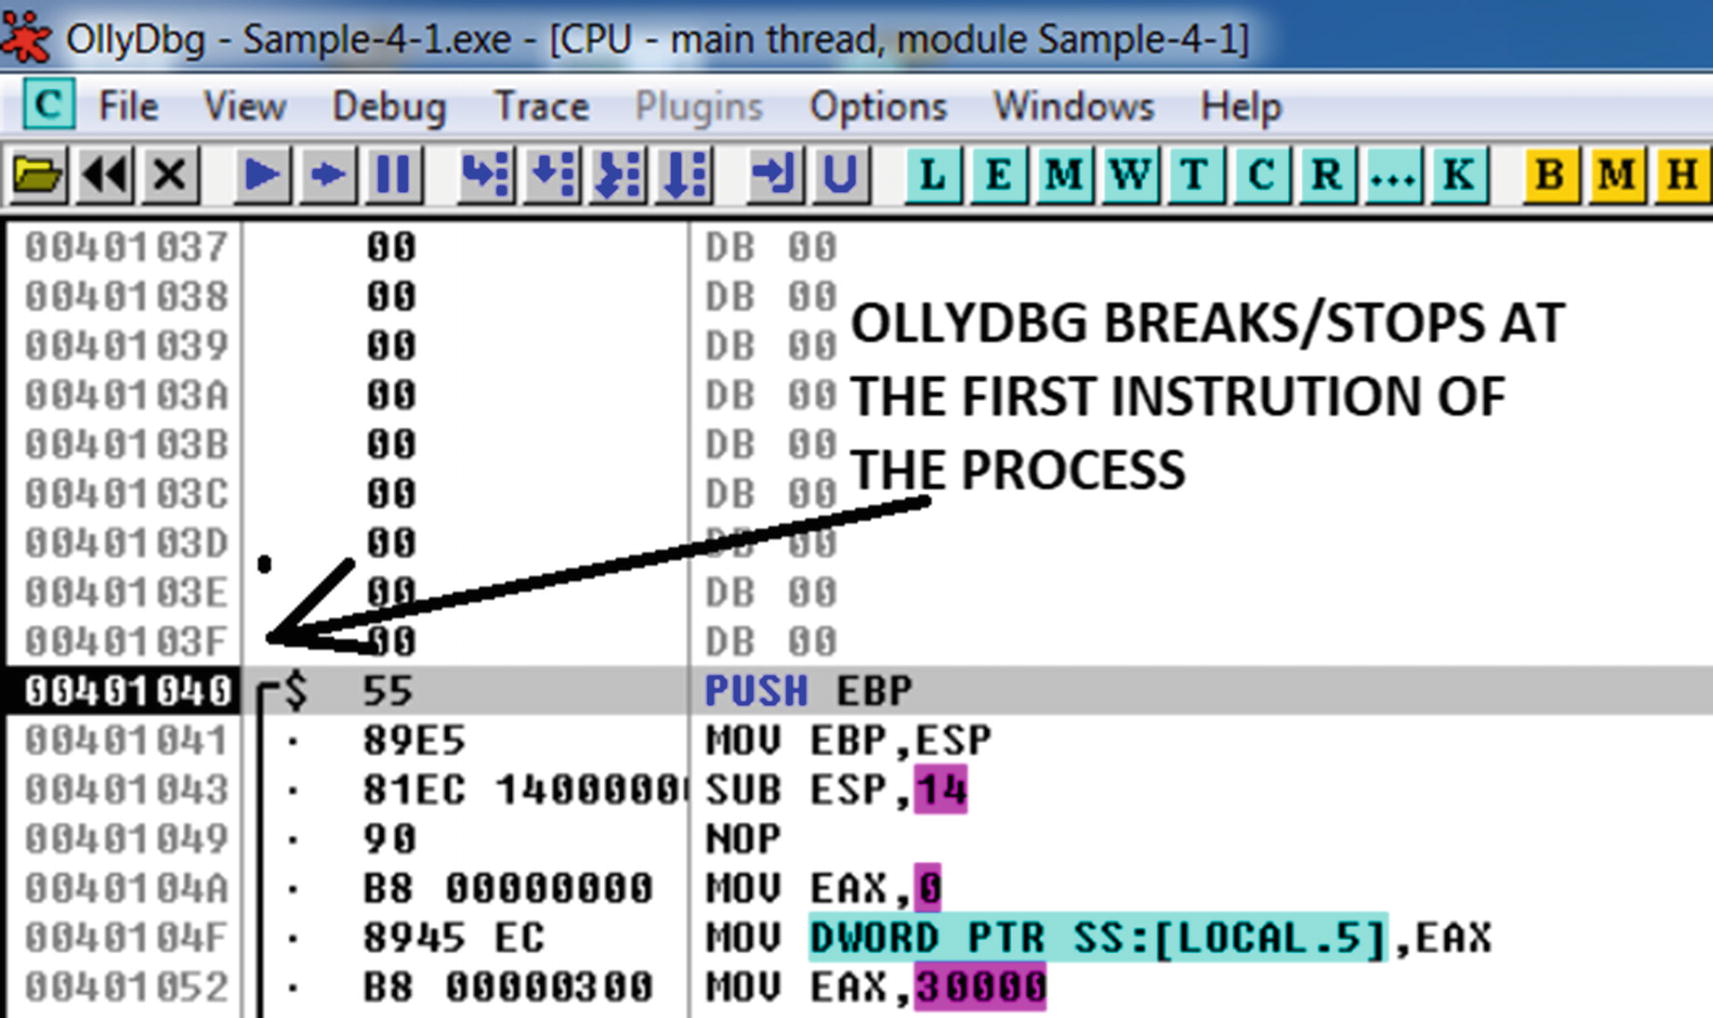
OllyDbg breaks/stop at the first instruction Sample-4-1.exe executes

The actual image base of Sample-4-1.exe PE file in its memory
Important PE Headers and Fields
There are three main headers in the PE file: DOS headers, NT headers, and section headers. These headers may have subheaders under them. All the headers have multiple fields in them that describe various properties. Let’s now go through the various header fields defined by the PE file format and understand their properties and the type of value held in them. To investigate all the various fields in this section, we use Samples-4-1 from the samples repository. You can load this sample into CFF Explorer and investigate the various fields as we run them in the following sections.
DOS Header
The DOS header starts with the e_magic field, which contains the DOS signature or magic bytes 4D5A, otherwise known as MZ. If you scroll down the list of fields, you find the e_lfanew field, which is the offset from the start of the file to the start of the PE header.
NT Headers/PE Header
A PE header is also called an NT header or a COFF header and is displayed as an NT header in CFF Explorer. The NT header is further split into the file header and optional header.
Signature

The Nt Headers Signature field for Sample-4-1.exe shown by CFF Explorer
File Header
File Header has seven fields, but the fields that we investigate are Machine, NumberOfSections, and Characteristics.
Machine
The CPU or the processor is the main component of a computer that executes instructions. Based on the needs of the device, various types of processors have been developed, each with its own features and instruction format/set that they understand. Some of the popular ones that are available today are x86 (Intel i386), x64 (AMD64), ARM, and MIPS.
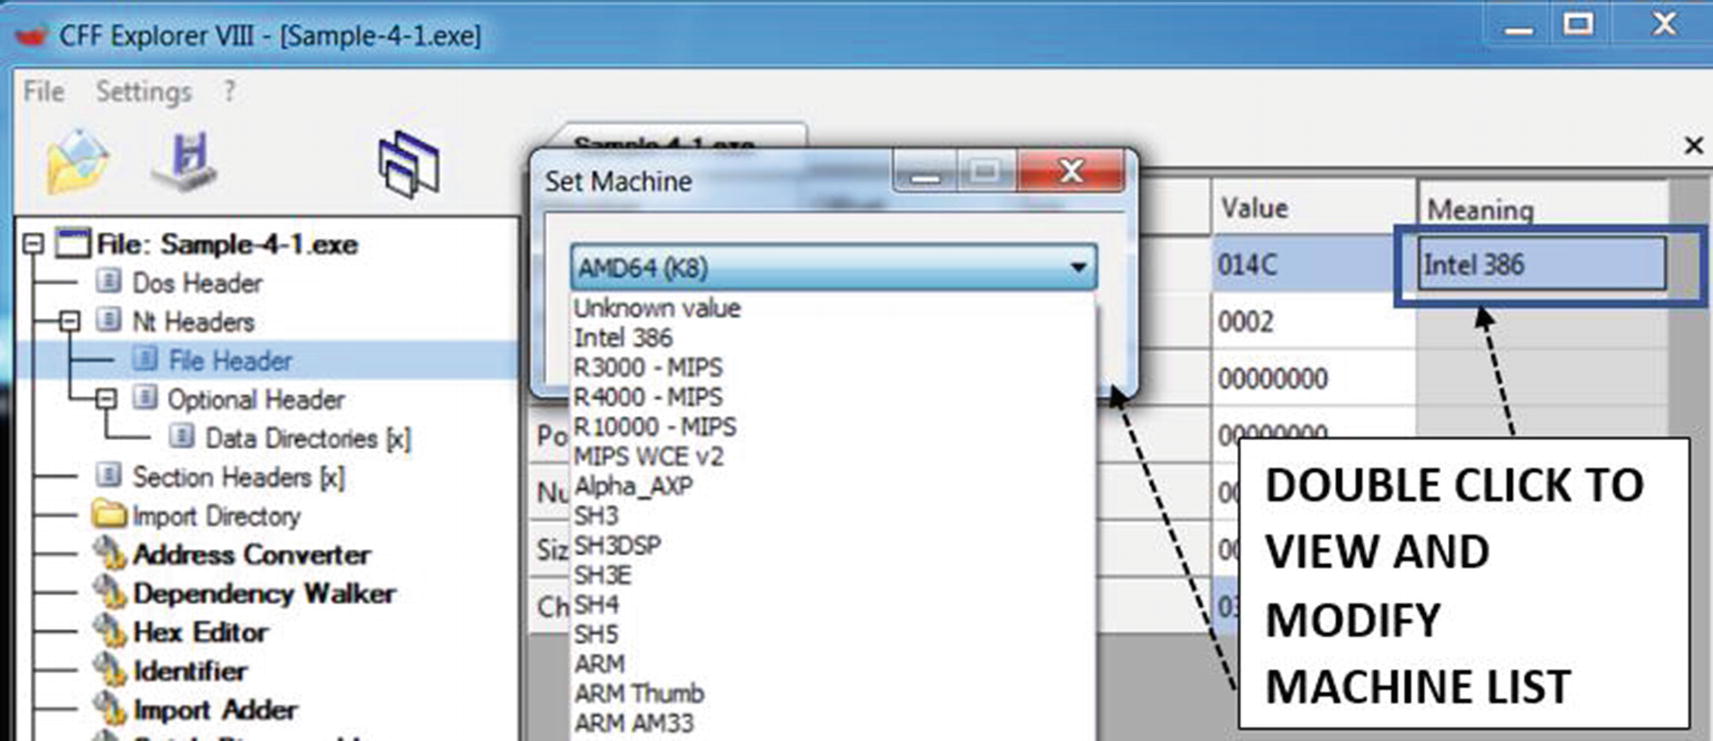
The processor/machine type that the PE file should run on
Modifying it to a wrong type results in a failure to create a process when you double-click it. As an exercise, you can try this out by setting a different type (like ARM) and save the file and then try to execute the sample program.
NumberOfSections
The NumberOfSections field holds the number of sections present in a PE file. Sections store various kinds of data and information in an executable, including the code and the data. Sometimes viruses, file infectors, and packers (see Chapter 7) modify clean programs by adding new sections with malicious code and data. When they do this, they also need to manipulate this field to reflect the newly added sections.
Characteristics

The Characteristics field visualization provided by CFF Explorer
File is executable: Indicates that the file is a PE executable file
File is a DLL: File is a dynamic link library (we talk about this later)
32-bit word machine: States if the PE file is a 32-bit or 64-bit executable file
Optional Header
An optional header is not optional, and it is important. The Windows loader refers to the many fields in this header to copy and map the PE file into the process’s memory. The two most important fields are AddressOfEntryPoint and ImageBase.
Data Directories

The Data Directories in a PE file which hold the RVA and Size of the directory
There is a total of 16 entries under Data Directories. If a table doesn’t exist in memory, the RVA and Size fields for that table entry are 0, as seen for Export Directory in Figure 4-29. The actual directories are in one of the sections, and CFF Explorer also indicates the section in which the directory is located, as seen for import directory, which it says is in the section data.
We go through some of these directories in later sections.
Section Data and Section Headers
Section data, or simply sections, contains code, data referenced by the import tables, export tables, and other tables, embedded resources like images, icons, and in case of malware, secondary payloads, and so forth. The RVAs in some of the header fields we saw in the earlier sections point to data in these very same sections.
All the section data is loaded into virtual memory by the loader. The section header contains information on how the section data is laid out on disk in the PE file and in virtual memory, including the size that should be allocated to it, the memory page permissions, and the section names. The loader uses this information from the section headers to allocate the right amount of virtual memory, assign the right memory permissions (check the section page permissions), and copy the contents of the section data into memory.
The section headers contain the following fields, as shown by CFF Explorer.
Name
The Name field contains the section name. The name of a section is decided by a compiler/linker and packers and any other program that generates these PE files. Sections can have names like .text that usually contains code instructions, .data that usually contains data/variables referenced by the code, and .rsrc that usually contains resources like images, icons, thumbnails, and secondary payloads in case of malware.
But an important point is the names can be misleading. Just because the name says .data, it doesn’t mean it only contains data and no code. It can contain just code or both code and data or anything else for that matter. The names are just suggestions on what it might contain, but it shouldn’t be taken at face value. In fact, for a lot of malware, you may not find sections with names like .text and .data. The packers used by both malware and clean software can use any name of their choice for their sections. You can refer to Table 7-1 in Chapter 7 for the list of section names used by popular packers.
Virtual Address
A virtual address is the RVA in which the section is placed in virtual memory. To get the actual virtual address, we add it to the actual image base of the PE file in virtual memory.
Raw Size
A raw size is the size of the section data in the PE file on the disk.
Raw Address
A raw address is an offset from the start of the PE file to the location where the section data is located.
Characteristics

Right-click a section header row in CFF Explorer to see section characteristics

The section characteristics in human-readable form displayed by CFF tool
One of the most important characteristics of a section is its permissions. But what are permissions? Pages in virtual memory have permissions. The permissions for the pages in memory that contain the loaded section data are obtained and set by the Windows loader from the permissions specified in the Characteristics field in the PE file on disk, as seen in Figure 4-31. As you can see, the section permissions in the PE file are specified as Is Executable, Is Readable, or Is Writeable permissions used by pages in virtual memory, as shown in Figure 4-11, Figure 4-12, and Figure 4-13.

The section data displayed by CFF Explorer
Windows Loader: Section Data—Virtual Memory
The Windows loader reads the data in the section from the disk file, as seen in Figure 4-32, using its Raw Address and Raw Size fields and then copies it into virtual memory. The section data in the file on the disk is at offset 0x200 from the start of the PE file and is 0x200 bytes in size. But at what address in memory does the Windows loader copy the section data into and how much size should it allocate in virtual memory in the first place?
You might think the second answer has an easy answer. The loader just needs to allocate raw size bytes in virtual memory because that’s how much of the section data is present on disk in the file. No! The size it needs to allocate for the section is given by the Virtual Size field, as seen in Figure 4-32. But where in memory should it allocate this space? It allocates it at the address suggested by the Virtual Address field, as seen in Figure 4-32, which is an RVA. It means the actual address at which it allocates this memory is image base + virtual address.

Section data loaded into virtual memory
Dynamic-Link Library (DLL)

2 C Programs that each have a HelperFunction() defined that are exact replicas
What you have is the same function HelperFunction() defined and used by both programs that looks the same. Why the duplication? Can’t we share this HelperFunction() between both programs?

DLLs now hold the common code that can be shared by all programs
A DLL is available as a file on Windows with the .dll extension . A DLL file also uses the PE file format to describe its structure and content, just like the Windows executable file with the .exe extension . Similar to the EXE file, DLL files also holds executable code and instructions. But if you double-click an EXE file, it launches as a process. But if you double-click a DLL file, it won’t launch a process. This is because a DLL file can’t be used independently and can only be used in combination with another EXE file. A DLL file is a dependency of another EXE file. Without another EXE file using it, you can’t make use of any APIs it defines.

The characteristics of Sample-4-2 shows that it is a DLL
Dependencies and Import Tables

The DLL dependency of Sample-4-1 as listed by the import directory in CFF tool

The DLL dependency msvcrt.dll loaded into a memory of Sample-4-1.exe by the loader
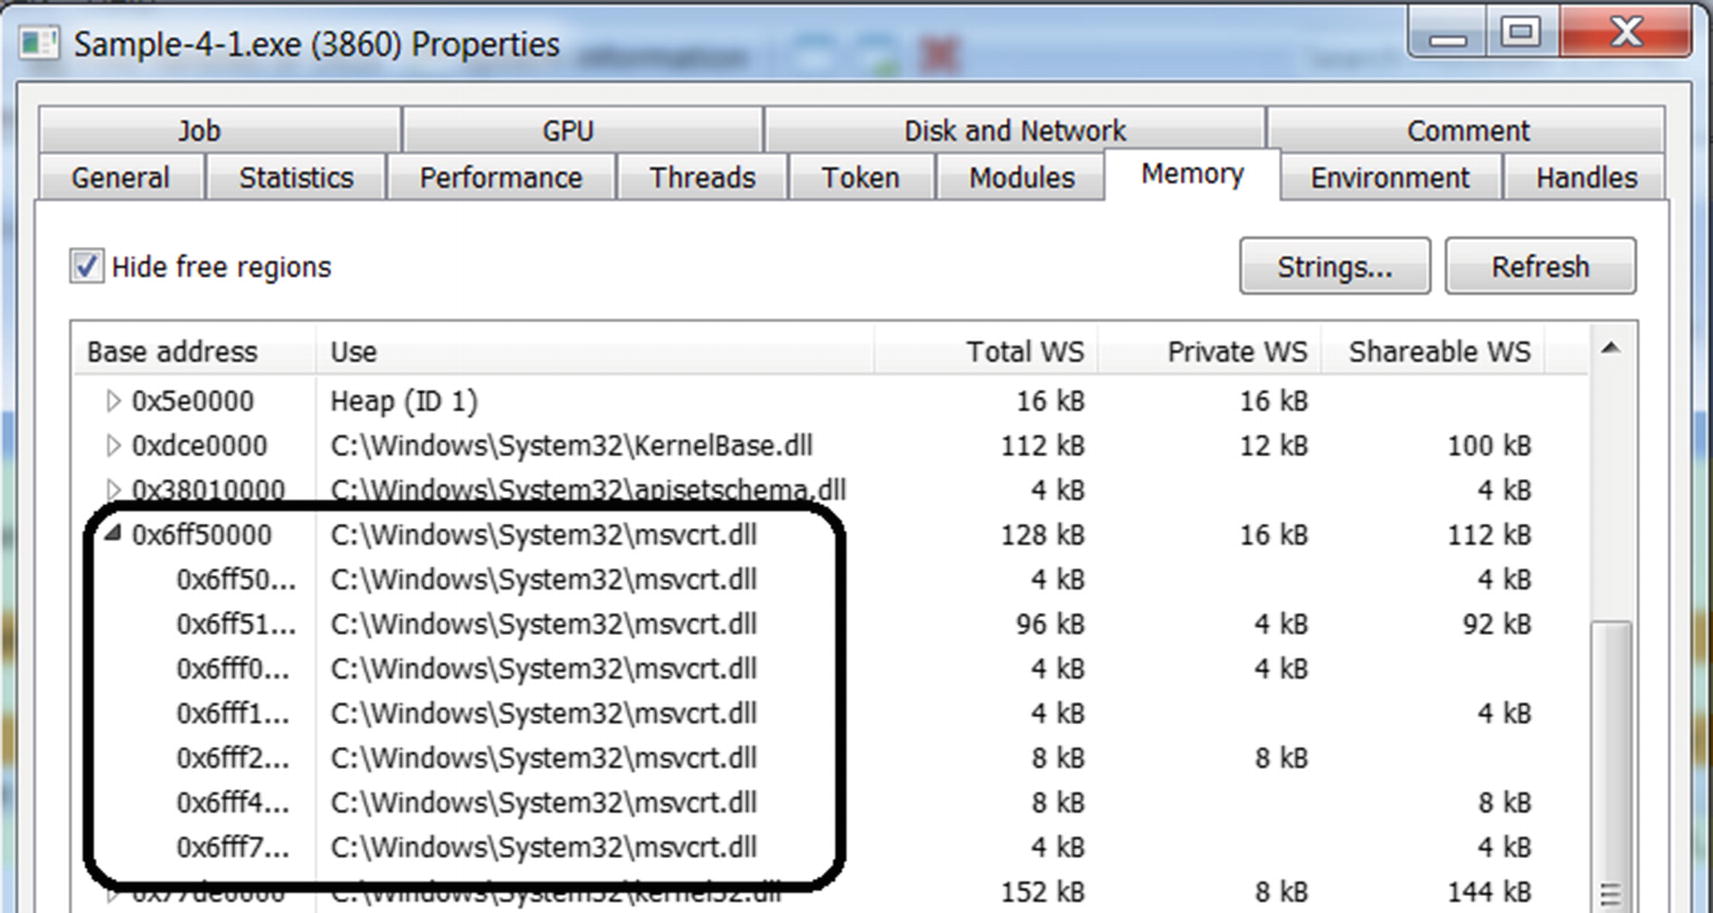
The memory blocks holding msvcrt.dll DLL dependency msvcrt.dll of Sample-4-1
Dependency Chaining
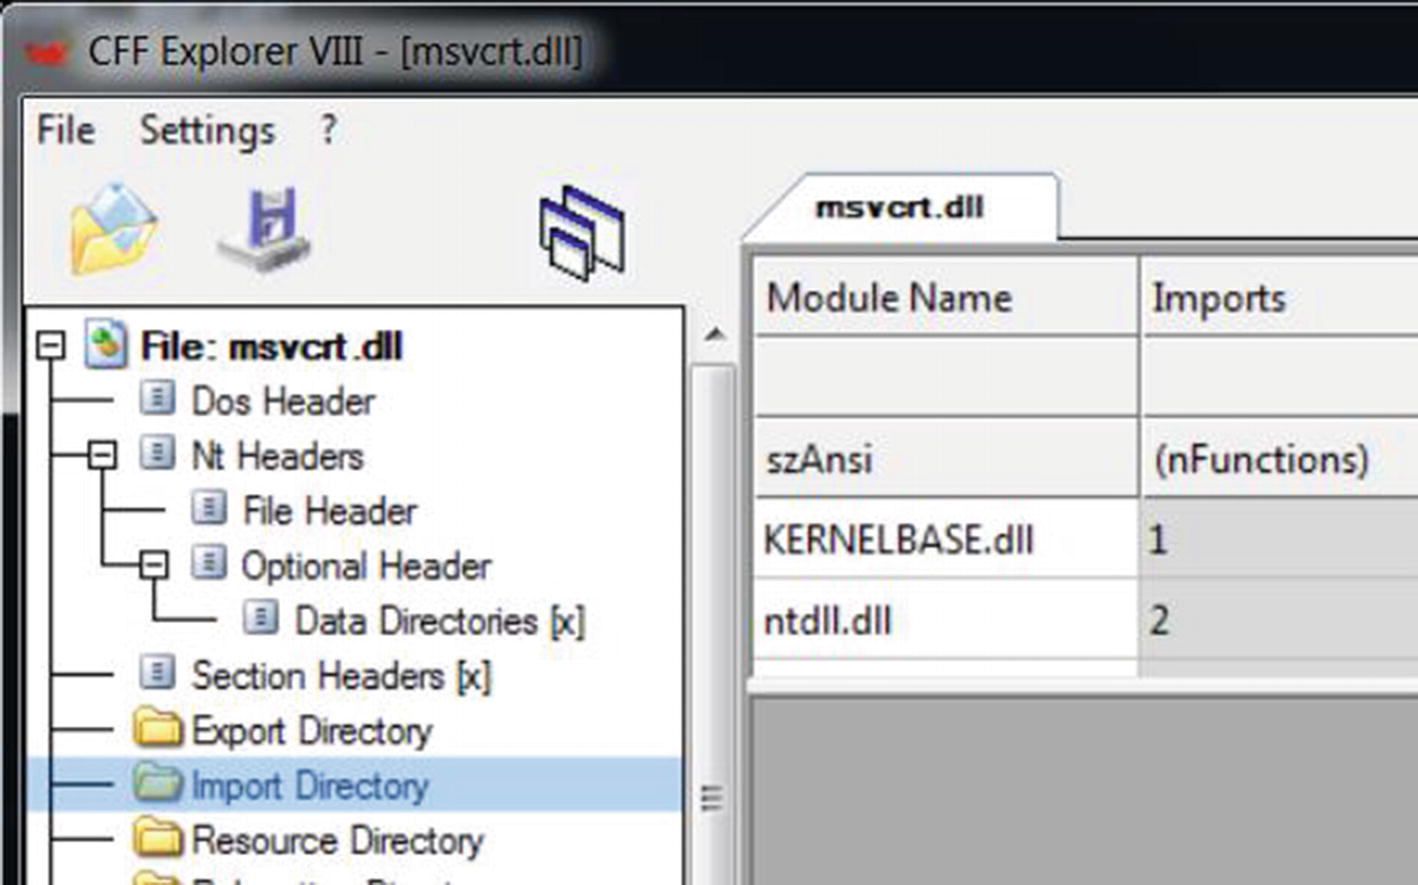
DLL dependencies of msvcrt.dll as seen in its import directory

Dependency Walker in CFF tool showing the DLL dependencies of Sample-4-2
Exports
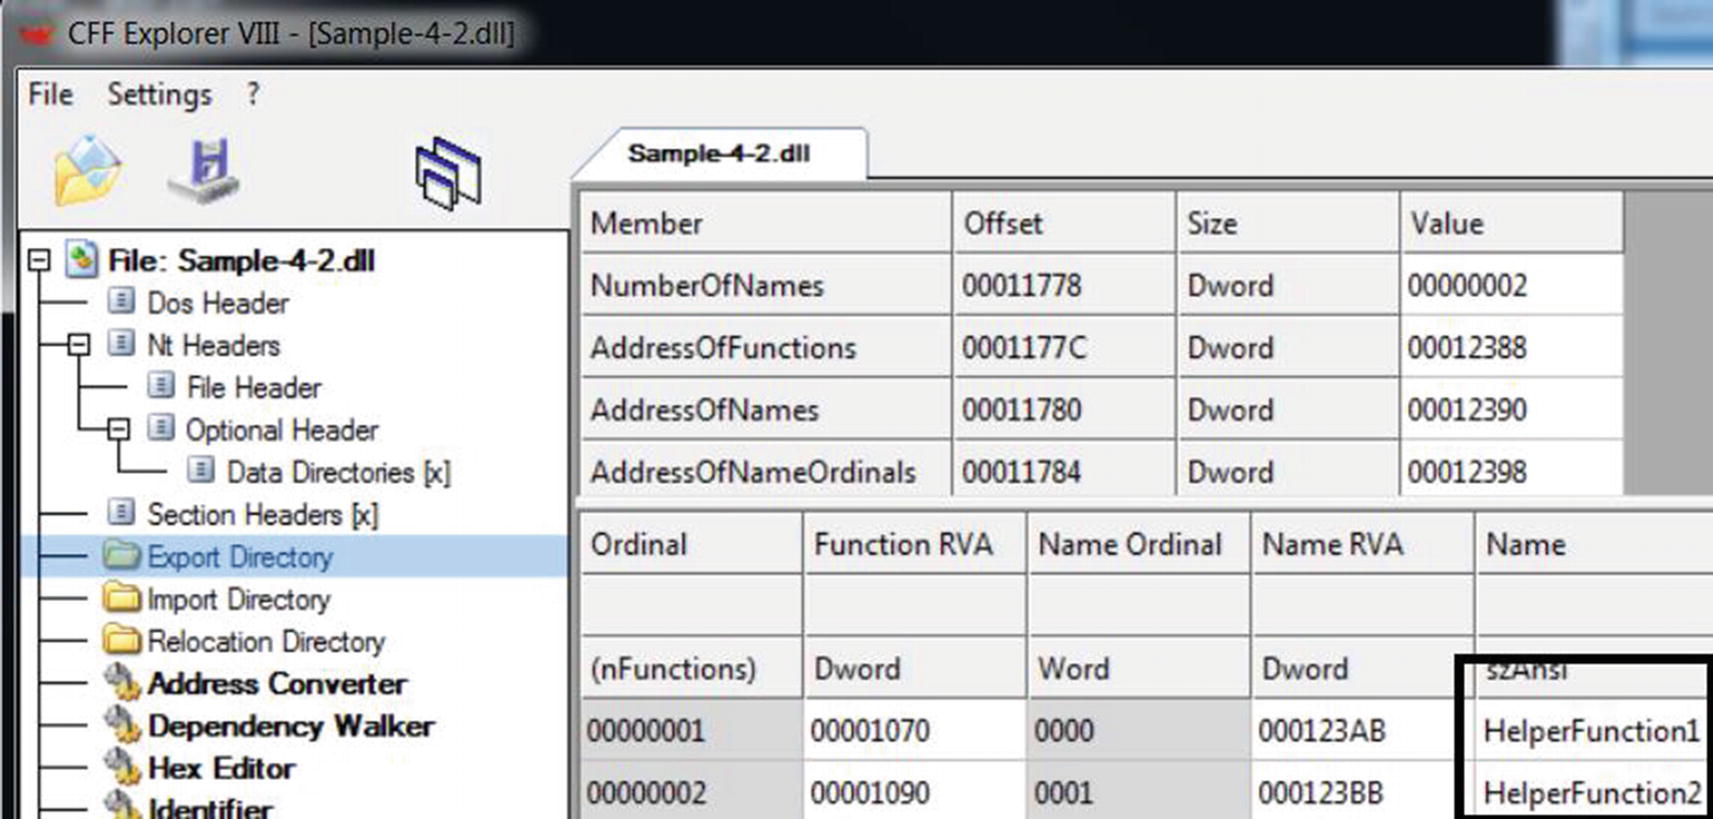
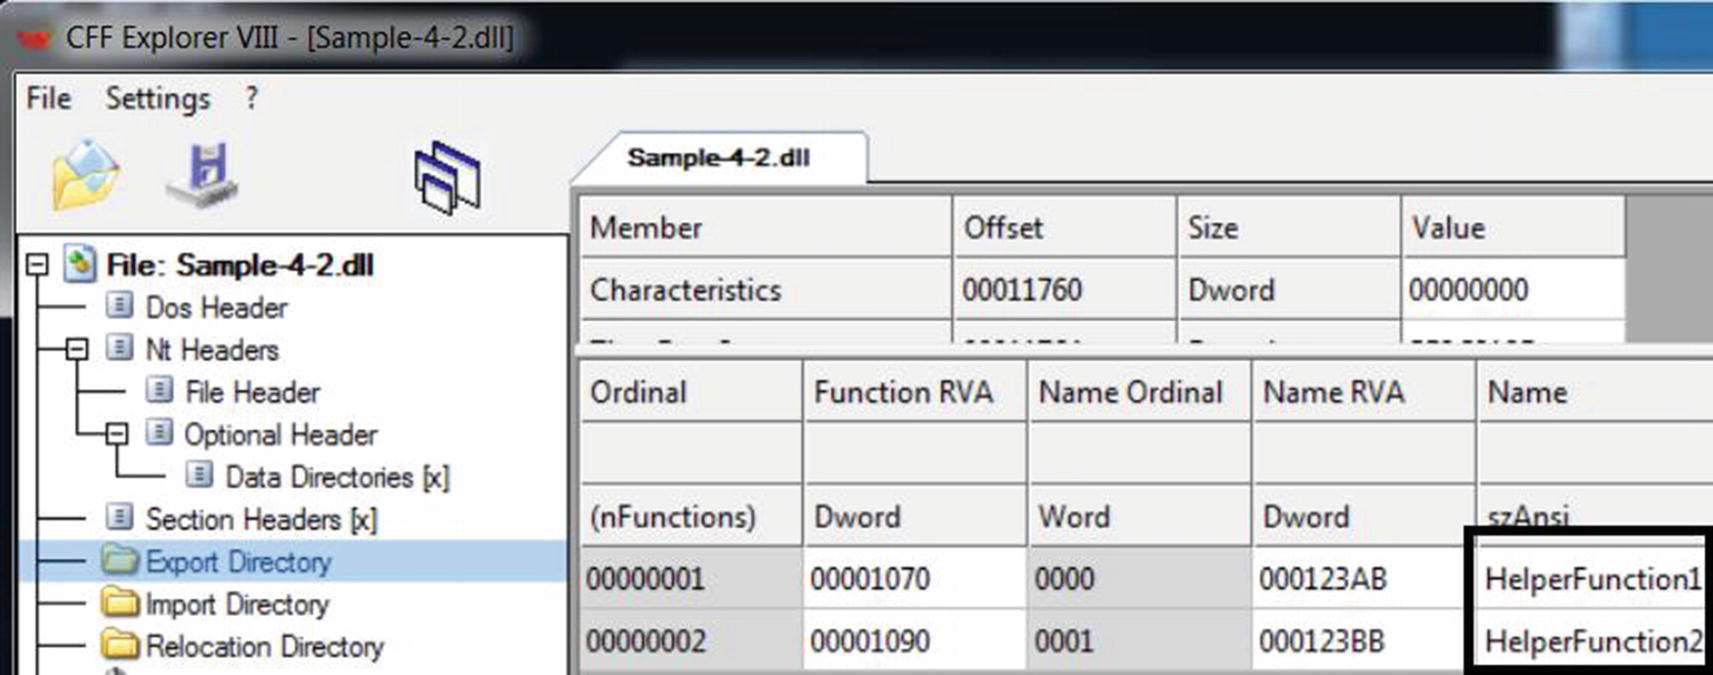
The export directory of a DLL consists the list of APIs made available by the DLL
The Export Directory also holds the RVA of the exported functions, which are listed as 0x1070 and 0x1090. The actual absolute virtual address of these functions in memory is the image base of this DLL file + RVA. For example, if the image base of this DLL is 0x800000, the address of these functions is memory is 0x801070 and 0x801090.
Import Address Table

The IAT table referenced by code to resolve the address of exported APIs
The exported APIs from Sample-4-2.dll as shown by CFF Explorer

The APIs imported by Sample-4-3.exe from Sample-4-2.dll

The image base of Sample-4-2.dll in memory
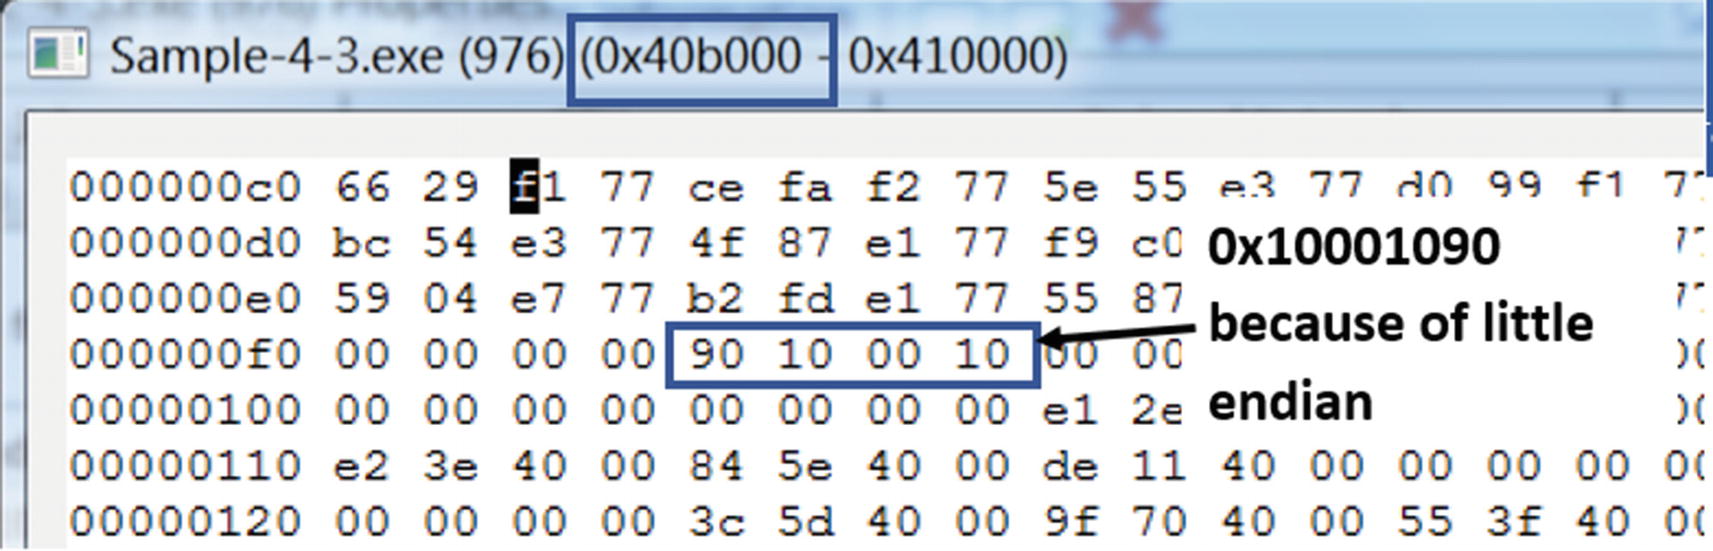
The IAT of Sample-4-3.exe holds the address of HelperFunction02() API
Let’s switch back to Figure 4-45. The IAT for Sample-4-3.exe that holds the addresses of the APIs that it imports from Sample-4-2.dll is located at the RVA of 0xB0F4, which when you combine with its image base of 0x400000 from Figure 4-46, gives it an effective address of 0x40B0F4. Checking the contents of this address in the memory using Process Hacker shows us that it does hold the address of the HelperFunction02() API from Sample-4-2.dll (i.e., 0x10001090), as seen in Figure 4-46.
Why is learning about IAT important? IAT is commonly misused by malware to hijack API calls made by clean software. Malware does this by replacing the address of genuine APIs in the IAT table of a process with addresses of its code, basically redirecting all the API calls made by the process, to its own malicious code. You learn more about this in Chapter 10 and Chapter 11, where we cover API hooking and rootkits.
Summary
Windows Internals is a vast topic that can’t be covered in a few chapters. You have dedicated books covering this topic, including the well-known Windows Internals series by Mark E. Russinovich. We have covered various OS internals topics in the book with relevance to malware analysis, reverse engineering, and detection engineering. In this chapter, we covered how the Windows loader takes a program from the disk and converts it into a process. We explored tools like Process Hacker and Process Explorer, using which we dissect the various process properties. We learned about virtual memory and how it works internally, covering concepts like paging, page tables, and demand paging.
We also covered the PE file format and its various fields and how the loader uses its fields to map it into virtual memory and execute it. We also covered DLLs that are widely used on Windows for implementing APIs and used by malware authors as a carrier of maliciousness. We covered import tables, export tables, and IAT that links an executable PE file and DLLs.