
Test lists group tests having a special common purpose and run them in a sequential manner without the tester's intervention. Hence, in the case of a smoke testing list or any other one with similar type, the tests will be invoked and executed one after the other.
Before we attempt to run the smoke testing list, we need to firstly disable the authentication window since these tests were not developed to cater for it. From the application's bin folder, edit the authorization tag inside the Settings.xml file as follows:
<authorization>False</authorization>
In the Test Lists pane, select the Smoke Testing entry and click on the Run List button from the Execution tab, as shown in the following screenshot:
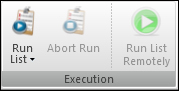
The Run list button
After the tests finish execution, Test Studio opens the Results tab to display the execution results. The following screenshot shows three execution runs for the smoke testing list:
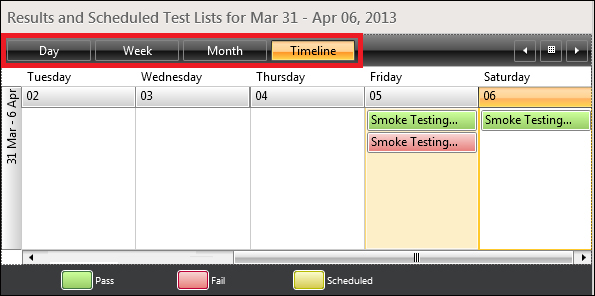
Test execution results
The Smoke Testing entry colored in green and executed on Friday affirms that all comprising tests have been successfully executed, whereas the one beneath it, which is colored in red, denotes that errors were encountered.
Since the test runs are shown in a calendar, the buttons boxed in a rectangle allow you to navigate between a daily, weekly, or monthly view for a broader analysis.
Suppose now that you want to inquire more about the reason of failure, which is usually the first action after identifying a failed execution. Firstly, you need to reproduce the error depicted in the preceding screenshot, so run the test list again. When the manual step for the first test is encountered, press on the Fail button and then wait until all the tests finish execution. From the calendar, double-click on the Smoke Testing entry colored in red. A Test Results pane is enabled in order to summarize the execution result for each test as shown in the following screenshot:
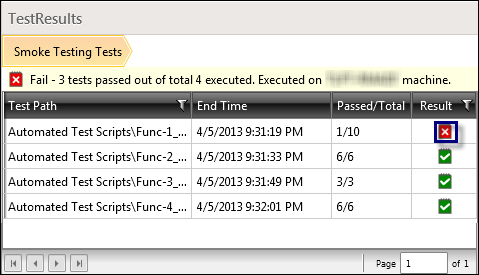
Summary for failed execution of the test list
The error now is easily spotted. It is the first test that is marked by the red and white cross outlined in the preceding screenshot. Double-click on the cross to drill down into the error details as shown in the following screenshot:
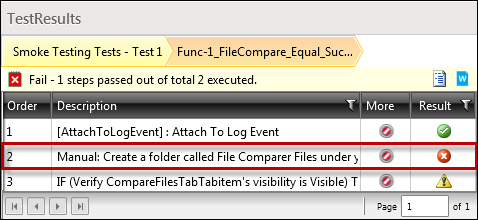
Viewing failing steps in test list execution summary
It is now apparent that the problem resides in the second manual step highlighted in the preceding screenshot. Double-click on the cross button again to further inspect about the error. The Step Failure Details window seen in the first chapter is invoked.
Manual test list execution similarly invokes all the underlying tests in a row but with a slight difference. In order to demonstrate this, perform the following steps first:
- Revert the
authorizationtag of the settings file toTrue. - Create a manual test called
Func-14_Login_Successfulunder theManual Test Scriptsfolder defined with these steps: - Start the
File Comparerapplication. - Input
msmithin the Username field. - Input
Mp@$in the Password field. - Click on the Login button.
- Verify that the login was successful.
- Close the application.
- Go to the Test Lists tab.
- Edit the
Securitytest list definition by selecting the list and then clicking on the Edit List button of the Edit tab, as shown in the following screenshot: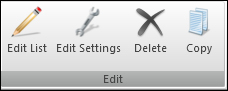
Test lists edit ribbon
- Move the created test to the right pane and click on OK.
Select the Security test list and click on the Run List button of the Execution tab. The execution window is invoked where in the first section, all the underlying tests' names are listed as shown in the following screenshot. Unlike the automated list, you are not forced to abide by a certain execution order for the tests. On the contrary, you can alternate between them by selecting the target test.
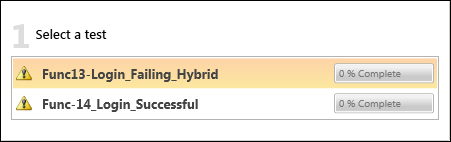
Display of tests during test lists manual execution
Click on the Launch App button to start the application which is going to invoke the Login window at first. Click on the Continue button to proceed with manual testing. The page contains additional navigation buttons to control the test execution order. These buttons are depicted in the following screenshot:
Navigation buttons during test lists manual execution
After executing the Func13-Login_Failing_Hybrid test, click on the Next Test button to move forward to the next test. At this stage, the previous button is enabled which can be clicked in order to go back to the first test and edit its corresponding steps' annotations and results. After the manual execution is completed, click on the Save Results button.
At this point, we can detect the behavior of a dynamic list. Go to the Test List tab and select the File Info Upload list from the Test Lists section. The right pane currently displays two tests. Set the value of CustomProperty1 of the Func-7_FileInfo_FileName_DDT test to File Info, and then go back to the Test List tab and select the File Info Upload list again. Notice how the tests in the right pane are incremented by one where Func-7_FileInfo_FileName_DDT is now included.
This demonstrates the behavior of dynamic lists where the set of tests is updated each time the list is invoked.
In addition to the list, results are automatically displayed by Test Studio at the end of a test list execution, logfiles still remain an important resource in accessing information about the tests' execution. Therefore, their availability in test lists is also an added value. We previously saw how to manage logfiles at a test level. We will now see how these files are also manageable at this level through the test list settings.
From the Test Lists pane, select the Smoke Testing entry, and click on the Edit Settings button from the Edit ribbon. The Edit Test List Settings window opens as shown in the following screenshot:
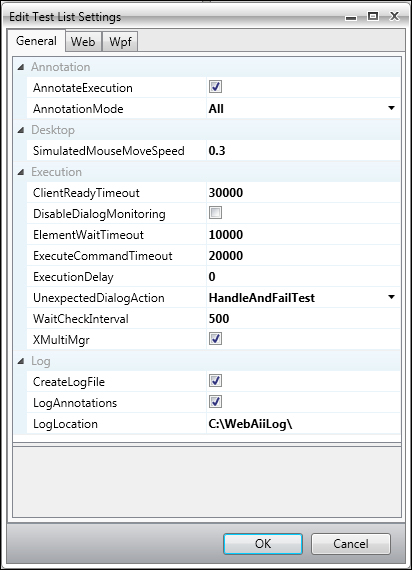
The Edit Test List Settings window
The last section titled Log has settings for the logging mechanism. Enable the CreateLogFile and LogAnnotations checkboxes, if not already enabled.
Annotations are descriptive texts generated by Test Studio when a test is executing. They contain the target element and the actions that are being executed against. The following screenshot contains an annotation example:
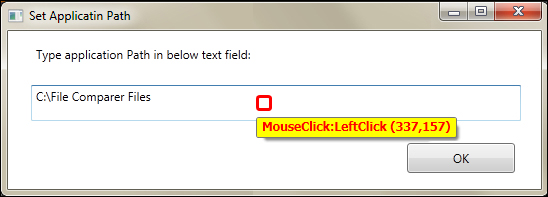
Annotation text during test execution
Annotations are enabled from the Annotation section of the same window, therefore, select the AnnotationExecution checkbox from that section if not already selected. With these options, the logfile will now contain a summary of the steps that are executed and any additional custom logging inside the tests. Logfiles will be available after execution under the directory specified in the
LogLocation property of the Log section. For example, running the Smoke Testing list will result in the following log for the Func-1_FileCompare_Equal_Successful test:
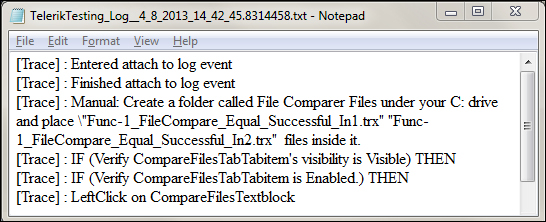
The test list logfile
Other settings are also available in the settings window, and they are concerned with the dialog handling. For example, DisableDialogMonitoring will stop Test Studio from handling dialogs, whereas UnexpectedDialogAction will specify the way of handling dialogs that weren't expected in the tests' definition. The following three options are available for the unexpected dialog action setting:
HandleAndFailTestHandleAndContinueDoNotHandle
Test lists also have options to allow you to customize time settings, for example, the maximum default time to wait for element availability through ElementWaitProperty, the maximum time to wait for a command to execute through ExecuteCommandTimeout, and the time to insert between the consecutive steps' execution through ExecutionDelay.
The preceding settings are common to WPF and web tests. Test lists offer more specialized settings based on the application type. The following screenshot shows the Web tab of the Edit Test List Settings window:
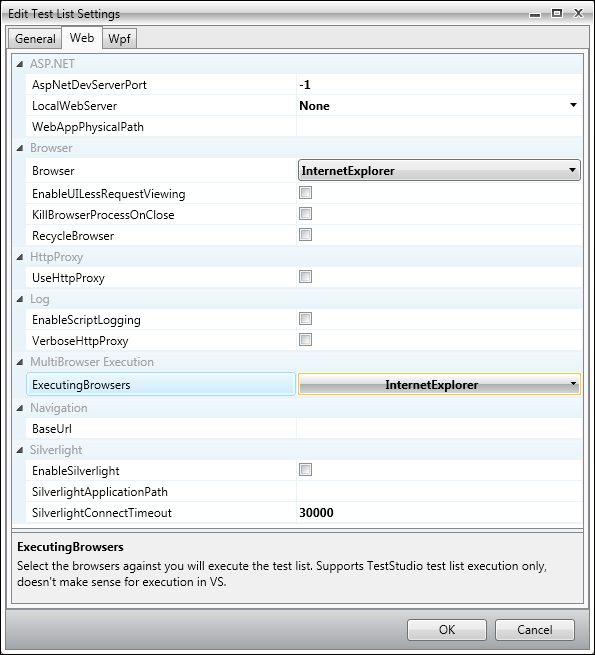
Test list settings for web tests
Some application-specific settings can be specified in the ASP.NET section. Hence, the ASP.NET development server port, the local web server, and the path to the application on the development server can be defined in the first three parameters appearing in the preceding screenshot. The value -1 indicates that a random port value will be used.
Other global handy features can also be defined as follows:
- Browser corresponds to the default browser to be launched for a web test execution
- The HTTPProxy checkbox whose state indicates whether or not to use the proxy browser during a test execution
- The ExecutingBrowser listbox, where you can select the list of browsers for which the test list will sequentially run
- The BaseUrl field that corresponds to the URL of the application against which the tests will execute
The WPF tab of the test list settings also allows you to specify the default path of the application against which the test will run.