
Rarely is an automated test going to execute successfully from the first hit, and if it does, we should be careful for logical hidden problems. The automation errors fall under the following three categories:
- The first category holds the syntax problems that do not allow your code to compile in the first place and therefore the test cannot be executed.
- The second category holds problems dormant inside the automated steps and will not come out until execution. We can list, for example, problems in recognizing an object at runtime.
- The third category holds problems that are not even necessarily revealed during runtime. These are the most malicious types of problems, since the symptoms are not as flagrant as the preceding two categories.
In the third case, the test executes normally until the person verifying the automation becomes suspicious about the executed test result. The root cause of such problems is an embedded logical error in the translation of the manual test. At this point, it is good to remember that automation in itself is building logic on top of the application under test, which leaves an open field for the testers' mistakes in addition to those of the developers'. This fact dwells on one of the automation overheads.
In this section, we are going to see examples based on the preceding categories and how we can address them inside Test Studio.
In the class code of the Func-1_FileCompare_Equal_Successful test, it would have been more convenient to simply name the LogResult method as Log. Let's do it and see what happens. The method signature now looks as follows:
private void Log (string result)
Click on the Run button. The test does not start and a compilation error is displayed as shown in the following screenshot. All the steps are not executed as shown in the following screenshot:
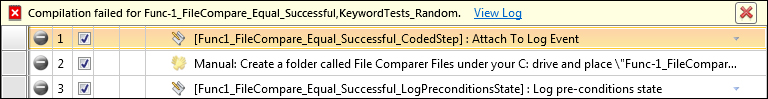
The Func-1_FileCompare_Equal_Successful test with compilation error
Click on the View Log link. The error description will be displayed as follows:
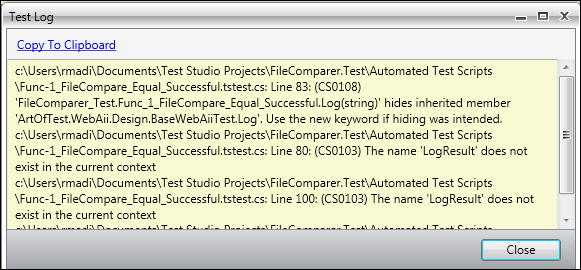
Error log of the Func-1_FileCompare_Equal_Successful test
Technically, the error is telling us that the BaseWebAiiTest Log class already has a function with the same signature. Instead, if our aim is to really let our definition to execute the Log method, we should add the new keyword.
We have just seen an example of the syntax error and how to collect details about it. We will next look into the execution errors.
Execution errors appear after passing the syntax verification stage, and as mentioned previously, they will be shown during test execution runtime. The first clue we get about these errors is that their corresponding step in the logfile starts with Fail. Could the cause be a bug inside our script? Or, could it be a failing verification or a blocked UI operation? To resolve it, we need to dig in more into this problem by means of the collected information made available to us at the level of the failing step.
Let us first introduce the error in the test. We can try something like preventing the object recognition on the screen such as the New Files radio button. To do so we will first explore how Test Studio finds it during execution. Click on the NewFilesRBRadiobutton option from the Element pane to display its properties inside the Properties pane. Locate the FindLogic property:
[Name 'Exact' newFilesRB] AND [XamlTag 'Exact' radiobutton]
We deduce that Test Studio is recognizing the element by the value newFilesRB found in the Name property. Let's break this! In Visual Studio, edit the Xaml tag corresponding to the New Files radio button to the following:
<RadioButton Content="newFilesRB" Height="17" HorizontalAlignment="Left" Margin="28,9,0,0" Name="newFilesRBEdited" VerticalAlignment="Top" Width="16" Checked="newFilesRB_Checked" IsEnabled="True"/>
Before compiling the solution, edit all the occurrences of the newFilesRB word to newFilesRBEdited inside the MainWindow.xaml.cs file.
Now run your test inside Test Studio. Did you get an error?
Step 4 fails because the radio button cannot be found. Of course, we quickly made this conclusion because we intentionally implanted the error. However, in cases where it wasn't intentional, to inquire more about the error, double-click on the red and white cross to open the Step Failure Details window:
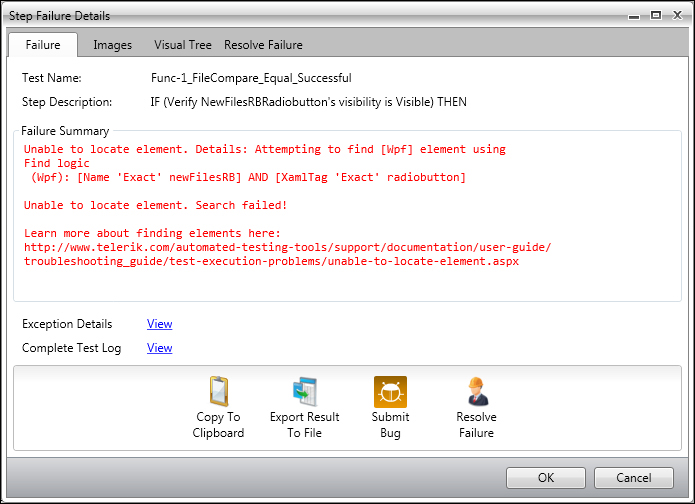
Troubleshooting failure in the Step Failure Details window
The first tab called Failure summarizes the problem. It says that Test Studio is unable to locate the radio button. Exception trace is found in the View link of the Exception Details window.
The second tab called Images is the equivalent visual interpretation of the failure summary. It holds the application snapshots taken at the time of execution.
The third tab called Visual Tree is a snapshot of the object hierarchy at the time of error. It provides additional information, in case the problem is not clearly visible in the UI. If we expand the hierarchy tree to the tab control, we can spot the problem which caused the radio button's recognition to fail:
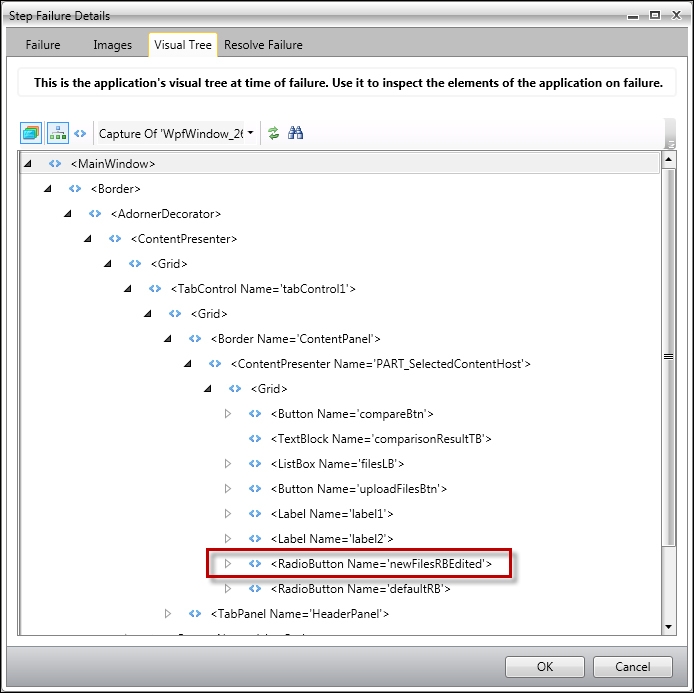
Troubleshooting hierarchy tree in the Step Failure Details window
Finally, the fourth tab called Resolve Failure is there to guide you on the solution for it.
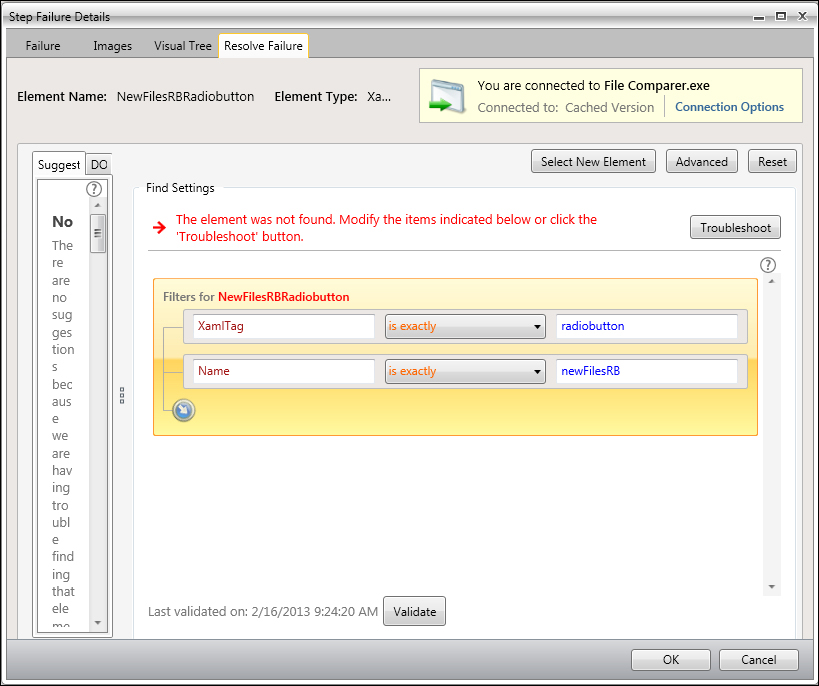
Resolving failures in the Step Failure Details window
Now we will see how interesting the tab is. To the left is displayed the element tree that we have seen in the tab before. It is worth noting that it reflects the object model for the application during the last run and not during the time of recording. To the right, the Find Settings pane directs us to the root of our problem described in the label highlighted in red before the Troubleshoot button. You can imagine how much debugging time we have just saved. Not only that, it also gives the opportunity to fix the problem right away. In the Filters for NewFilesRBRadion section, update the Name operator to contains and click on the Validate button. The label now changes to: Great! We are able to find your element using the settings below.
If we decide that the failure problem does not have to do anything with our test and we wish to escalate the issue to the developer's team, we need to go back to the Failure tab and click on the Submit Bug button. We could either export the result to an Excel file or submit it to any of the two integrated systems, which are: TeamPulse Server and Team Foundation Server. Click on OK. A window pops up and asks us whether we want to update the find logic of this element for all its occurrences in the test.
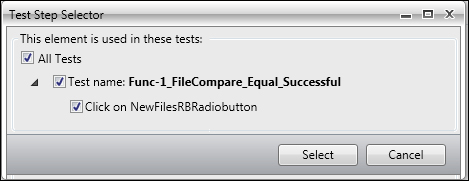
Selecting steps after editing element find expression
Select everything as depicted in the preceding screenshot and click on Select.
The automation of our test cases is complete. What remains now are some settings related to the execution. For example, deselecting the box that is tied to a test step will cause the latter to be ignored during execution and Test Studio's execution log will hold an entry describing it.
During the automation of our manual test cases, we decide that the test case execution does not have to be interrupted upon slight nonbusiness failures. In order to instruct Test Studio not to break execution at a certain step, enable the Continue on Failure option as shown in the following screenshot. The green arrow indicates that now this step is not going to abort the execution in case it fails.
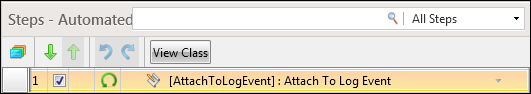
Toggle the Continue on Failure setting on the attach to event step
Suppose that in the Func-1_FileCompare_Equal_Successful test, after clicking on the Compare button, the file comparison is taking some time to finish, and suppose this time is greater than what the verification on the result text block is giving us, then in this case, Test Studio will wait on the label inside the text block for 10 seconds before it marks it as failing and proceed to the next step.
Perform the following steps to avoid such problems:
- Add While(…)THEN from the Logical button of the Add ribbon and drop it right after the step that clicks on the Compare button.
- Add to the loop body an execution delay from the More combobox menu of the Add ribbon and edit the value of its
WaitTimeproperty to1000milliseconds. - Finally, create a verification condition that is passing for any displayed text and add it to the loop body. So, during execution as long as no text is displayed in text block, the execution will be delayed by 1 second.
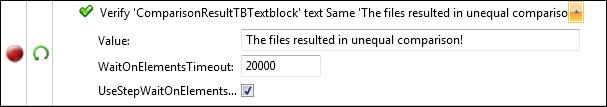
All of this is offered out of the box in Test Studio. Either add a Wait step from the text block's quick tasks or expand the "Verify 'ComparisonResultTBTextblock' text Same' The files resulted in equal comparison!'" step's properties and select the UseStepWaitOnElments box. This feature overrides the default waiting time, which is 10 seconds. In the Properties panel, increment the WaitOnElementsTimeOut box to 20000 as shown in the following screenshot:
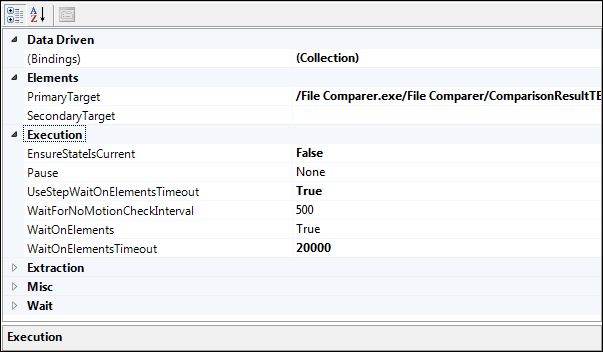
Wait step properties
Debugging is our means to pause the test execution when a certain situation needs evaluation. The outcome could be identifying and removing flaws from the application or just learning more about that situation.
We have two ways to pause the execution inside Test Studio. Either by toggling a breakpoint or inserting an inspection point. When a breakpoint is reached, the execution will pause and a Debug window will be displayed through which we can explore the available information.
In the Func-1_FileCompare_Equal_Successful test, in the Verify 'ComparisonResultTBTextblock' text Same 'The files resulted in equal comparison!' step, change the value of the extended property, Value to The files resulted in unequal comparison! in order to enforce a failure. Let us toggle a breakpoint and the Continue on Failure option as follows:
Inserting a debug breakpoint
Run the test. The execution breaks before executing the step to debug. We are going to shift our attention to the debug window, which appears to the lower-right corner of the screen:
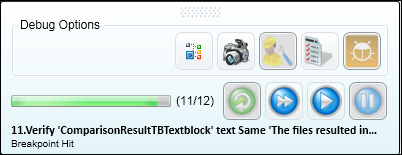
The Debug window
Click on the first button to open the DOM Explorer window, which, as we have seen previously, shows us the tree of UI elements of the application. If we expand the hierarchy until we reach the corresponding tag of the textbox, we notice that it contains the text value currently showing on the application as follows:
<textblock Name="comparisonResultTB" Uid="66471715">The files resulted in equal comparison!</textblock>
Let us go through all the available debug functionalities in order to further troubleshoot and solve the error:
-
Close the DOM Explorer window and click on Execute one step at a time icon [
 ].
].
- The step at which we stopped will now be executed.
-
Click on the Diagnose currently failed step icon [
 ].
].
- The outcome is the Sentence Verification Builder window (which we are already familiar with), so edit the value of the verification sentence to The files resulted in equal comparison! and then click OK.
-
In the Debug window, click on the Re-run current step icon [
 ].
].
- Click on the Execute one step at a time icon again.
-
Let's open the execution log by clicking on the View Execution log icon [
 ] and notice how the comparison is now passing.
- Close the Execution Log window.
-
Click on the Continue Execution icon [
 ] to finish the test.
- The Apply test updates window prompts us to make a decision regarding the changes we have done; since they did solve the problem so we will click on Apply and then on the Close button.
Also, inspection points are useful in case we want to pause the execution and examine the DOM hierarchy. They are added from the More button of the Add ribbon. When the execution pauses, the DOM Explorer window pops up so we can drill down in its hierarchy.