
Since Chapter 2, Automating Functional Tests, Test Studio has been used to test the behavioral quality aspects of an application. In addition to manual and automated functional testing, it is also one of the test automation tools that incorporate nonfunctional testing without causing any overhead on the test scripts developed in the functional phase. So here again, Test Studio enables an instant seamless transition enabling a test to run in the performance mode while capturing data related to time and resource efficiency. In this section, we will start translating the discussed performance testing notions on a web application that we are going to test using Test Studio.
Test Studio allows capturing the web functional scenarios through the web test template. These tests can be run either in the regular mode by using direct execution and test lists or in the performance testing mode. The only difference between the two modes is that in the latter, the default execution performance data are recorded down to a test step level, and you can optionally specify additional performance counters related to resource utilization at the different application tiers.
In order to set up the environment for the web test template to run in the performance mode, another Test Studio version must be installed on the machine that is going to act as a server. This version can be either the full or runtime edition. The reason is that when a web test template is executing, Test Studio connects to the target server machine in order to gather performance metrics. Hence, the server machine needs to have the Test Studio Profiling service running.
After a Test Studio version is installed on the server, validate the following requirements:
- To check whether the required services are running, perform the steps as follows:
- From the Windows start menu, access Telerik, and then the Test Execution folder.
- Under this folder, click on the Configure Load Test Services entry, which will launch the configuration manager window for various services as shown in the following screenshot:
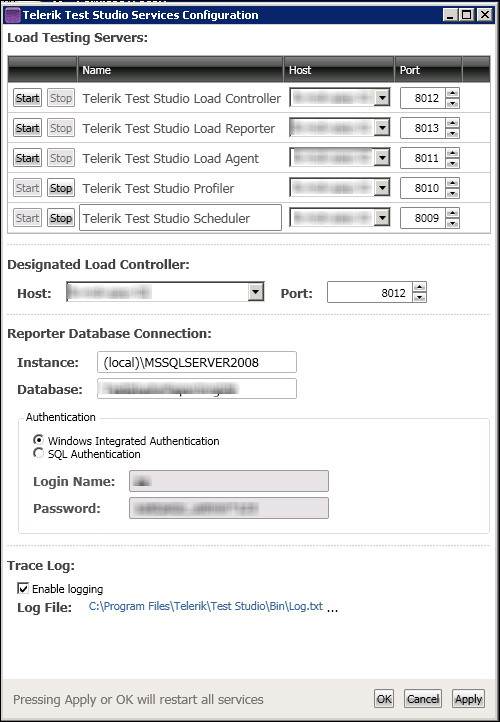
The Test Studio services configuration manager
- Click on the Start button for Test Studio Scheduler Service and Test Studio Profiler Service if it is not already enabled, which will cause the corresponding services to start.
- Open port
8010on the server by creating inbound and outbound firewall rules for it. For more details, you can access the Telerik online documentation available at http://www.telerik.com/automated-testing-tools/support/documentation/user-guide/performance.aspx.
The introduction section described performance testing from its business requirements and its influence on the business of a company. This section starts by drawing the mutual relationship between the business and the technical world in a web application performance to establish the test plan that is to be executed.
Business requirements and marketing targets clearly contribute to the expected response time, while the actual response time contributes to the business of a company. They have a mutual impact on each other and while acting in different realms, they both share the same language described as follows:
- Business world refers to client, while IT world refers to users
- Business world refers to business operations, while IT world refers to transactions
- Business world refers to operation time, while IT world refers to transaction time
Combined together, the preceding three elements help in designing workloads. Workloads are the classification of users in groups based on the typical transactions that they perform against the web application and the estimation of the percentage of these users in various groups based on real-life distribution.
Designing proper workloads that are nearly similar to real life is one step towards achieving good performance testing. This also applies to the test environment and estimated response times.
These are the ingredients to start web performance testing for this chapter, and we will see how to implement them by walking through the performance test plan and implementation, execution, and analysis of a web application called BugNet. BugNet is an open source bug tracking system that manages the process of submitting bugs and administering them during their life cycle. The project is publically available on Codeplex at this URL: http://bugnet.codeplex.com/.
The planning phase sets up the overall plan and it comprises the following activities:
- Defining the objectives and expectations.
- Identifying the test environment.
- Classifying the users into groups.
- Classifying their corresponding activities.
- Selecting performance metrics.
- Identifying baseline tests.
The following is the plan produced after exercising the preceding activities on BugNet:
The application performance objective can possibly be similar to the following list, which we are going to adopt:
- Improving the testing process by certain productivity percentage
- Having realistic response times
- Knowing whether additional performance tuning is needed
- Ensuring competitiveness with other bug tracking applications
While designing the test environment, the following aspects are addressed:
- The different application tiers
- The number and specifications of the servers
- Network specification and infrastructure
- Size of the database with respect to the live operational environment
The following list breaks down the types of users with their corresponding typical types of bug management activities:
- Administrators: The following are the activities of an administrator:
- Configuring BugNet settings
- Creating and editing projects
- Creating user accounts
- Testers: The following are the activities of a tester:
- Posting incidents
- Commenting on an incident
- Updating incident details
- Performing queries
- Developers: The following are the activities of a developer:
- Commenting on incidents
- Performing queries
The metrics are delineated from the application topology where the performance counters are chosen based on the application tiers described as follows:
- The response time of major transactions.
- ASP.NET request execution time
- ASP.NET request wait time
- Disk time
- Total processor time
- Throughput of the major transactions.
- Total disk operations per second
- Total processor transactions per second
- Database transactions per second
- Various segments operated per second on the network
- Resource utilization of the major components of the system.
- Average disk operation byte transfers
- Memory usage
The implementation phase will start putting the plan into action by acquiring the testing resources related to the environment, configuring the hardware and software, and creating the baseline tests.
In the first step, preparing the environment, you need to have a Test Studio version running locally on your machine with another runtime version running on the server, as mentioned earlier, for which you want to capture the performance metrics. For simplicity, we will have BugNet hosted with the BugNet application and the database database both on one server.
For the second step, configuring the hardware and software, you need to make sure that the machine is connected to the server and the requirements for Test Studio configuration are met.
Even for configuring the software, a project should be created on BugNet to host all the resources that are going to be used by our test cases. To create the BugNet project, refer to Appendix, Setup Reference.
Finally, in the third step, creating the baseline tests we will start seeing things in Test Studio. For this purpose, create a new project called BugNet.Load to hold all our web tests. Then, create a folder and rename it to Performance Tests. Add a new test based on the Web Test template and call it Perf-1_NewAccount as shown in the following screenshot:
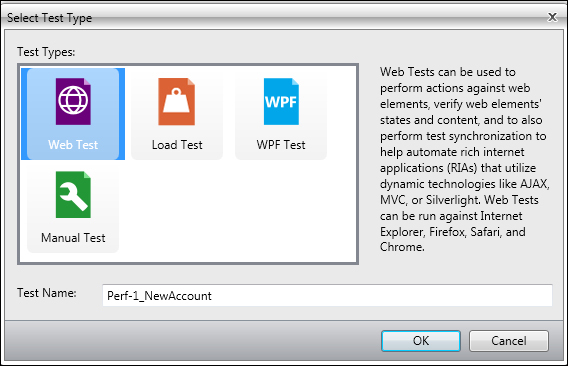
Creating web tests
For this test and subsequent ones, we are going to record our actions in the Internet Explorer browser. Test Studio tests are cross-browser tests, which means that you can record them using Internet Explorer and replay them in any other supported browser without having to make any particular changes to the test configuration.
The Test tab now has an additional section called Quick Execution, which is responsible for selecting the browser in which the test will execute, as shown in the following screenshot:
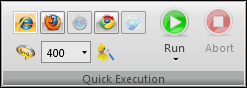
The Quick execution ribbon
The Perf-1_NewAccount test is going to automate the operations underlined by the following steps:
- Open the BugNet application.
- Log in with the username as
adminand password aspassword. - Click on Admin from the toolbar.
- Click on User Accounts.
- Click on the Create New User link.
- Enter Username as
projectadmin. - Enter First Name as
Jane. - Enter Last Name as
Smith. - Enter Display Name as
jsmith. - Enter Email as
[email protected]. - Enter Password as
1234567. - Enter Confirm Password as
1234567. - Click on the Add New User link.
- Log out.
Thereafter, from the Recorder ribbon, click on the Record button. An instance of Internet Explorer will be launched automatically, and Test Studio will attach its recording toolbar to it. Perform the preceding steps in BugNet and close the browser.
As we got used to, Test Studio was adding the test steps as the actions were executed against the browser.
The second baseline test is for posting an incident by a tester. It consists of the following steps:
- Open the BugNet application.
- Log in with the username as
testerand password as1234567. - Click on New Issue from Quick Links/Filter of Load Project.
- Enter Title as
Load-1: Test. - Choose Status as Open.
- Choose Priority as Blocker.
- Choose Assigned To as kford.
- Unselect the Notify checkbox.
- Choose Category as Response Time.
- Select Type as Bug.
- Select Milestone as 1.0.
- Select Resolution as Fixed.
- Unselect the Notify checkbox
- Select Affected Milestone as 1.0.
- Enter Description as
Bug Description. - Click on the Save button.
Create a web test and call it Perf-2_NewIssue. Repeat the preceding steps. Before we move to create the subsequent baseline tests, we will make the test more maintainable.
Since the login steps are going to be used by the subsequent tests, we will extract them to a standalone test by selecting them, then selecting the
Create Test as Step option from the context menu. Call this test as Perf_Login. Switch to the data view by clicking on the Local Data button in the Test Views ribbon, and create the table as shown in the following figure:
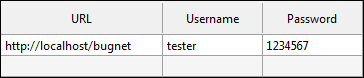
Perf-2_NewIssue data table
Make sure to update the server name of the URL shown in the first column.
In the Perf-Login test, repeat the same steps for local data creation and bind the steps to the columns as shown in the following screenshot:
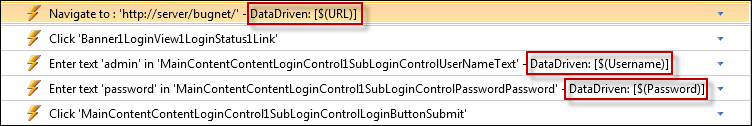
Perf-Login test steps
Finally, enable the InheritParentDataSource property check box of the Perf-Login test to true from the test properties pane.
Run the Perf-2_NewIssue test. Surprisingly, although the title field is filled, the following error is thrown by BugNet on submission:
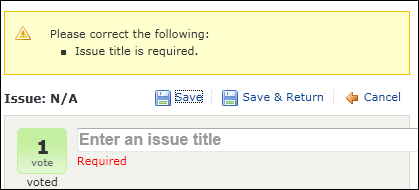
BugNet results after Perf-2_NewIssue execution
In web applications, some JavaScript events are triggered upon interaction with UI items. On the other hand, Test Studio, while replaying the recorded steps, uses by default the underlying object properties to set their values; for example, in the case of incident title field, the Title element's Text property is directly set to Load-1: Test in the DOM without simulating a real-user click inside the field and typing. Hence, from the BugNet perspective, the field is not filled yet and fails the business rules for submission. In order to avoid such situations, expand the step properties and select the SimulateRealTyping option as shown in the following screenshot:
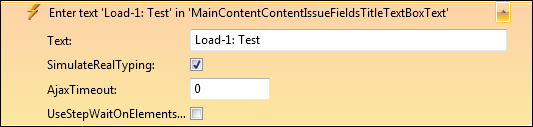
Setting the SimulateRealTyping property
This option's default settings can be changed by accessing the Project Settings window from the Project tab. The Show button of the Settings ribbon will invoke the window. Click on Recording Options and enable the options highlighted in red as shown in the following screenshot:
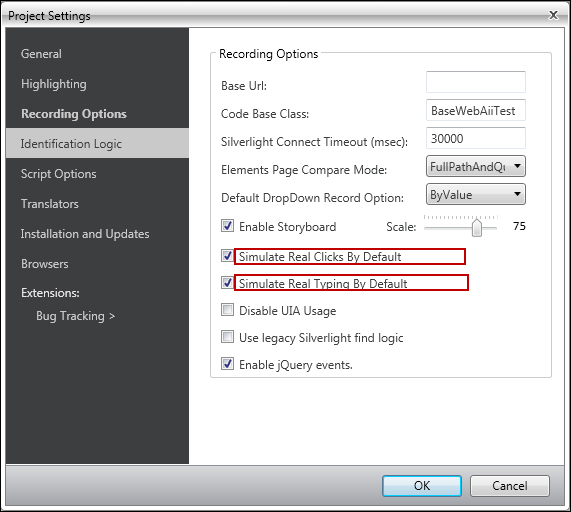
Simulate real typing default settings
The third baseline test is to simulate the performance of a query with developer credentials. The test consists of the following steps:
- Open a BugNet application.
- Log in with username as
devand password as1234567. - Click on Queries from the Quick Links/Filter.
- Click on the Add Query link.
- From the Select field combobox, select Assigned.
- From the combobox corresponding to the value, select kford.
- Click on the Perform Query link.
Create a third web test and call it Perf-3_PerformQuery. Record steps 3 to 7 listed previously. Insert the Perf-Login extracted test and create a local data source with the credentials appearing in this test case as seen in the Perf-2: NewIssue test. However, before finalizing the test, we still have one thing to worry about.
After choosing the query criteria, as represented in the first combobox, we need to wait until the last combobox gets populated with the possible list of values. This list is filled with the results fetched from the database after a request is initiated to execute the right query corresponding to the chosen criteria. Accordingly, insert the verification step depicted in the advanced verification builder of the following screenshot:
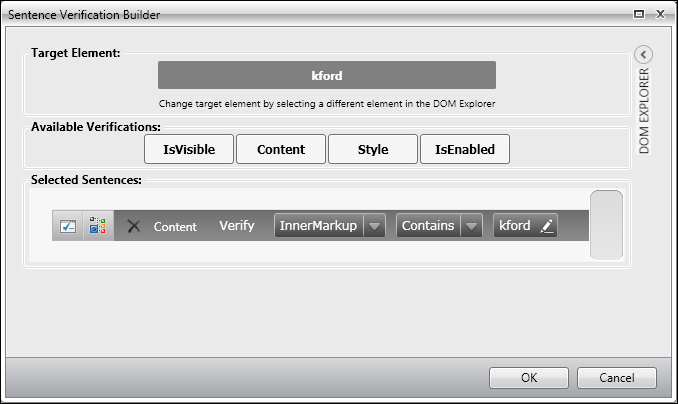
Waiting for a value to appear inside the combobox content
This verification step is created based on the combobox holding the values corresponding to the Assigned operator. It verifies that the value kford is contained in its text content. This step should be placed just before the action that sets the value kford for the combobox. Once added, perform the following steps:
- Right-click on the Verification step.
- Select Change Role from the context menu.
- Click on Set as Wait.
This will convert the verification to a wait step that will delay the execution for 10 seconds until kford appears in the combobox items. To change the default wait time, edit the Timeout property for this step as follows:
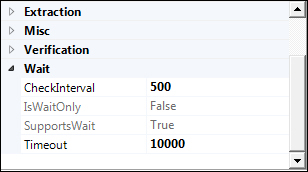
Changing default wait time for a wait step
The creation of baseline tests is complete, so it is time to run them and gather the performance metrics. Click on the Perf-1_NewAccount test, and then click on the Performance tab.
How do we specify the server for which we want to collect the metrics? How do we specify the metrics that we want to collect?
The answers to these questions are obtained from the Set Up ribbon after clicking on the Configure button. The Configure Performance Settings dialog box appears as follows:
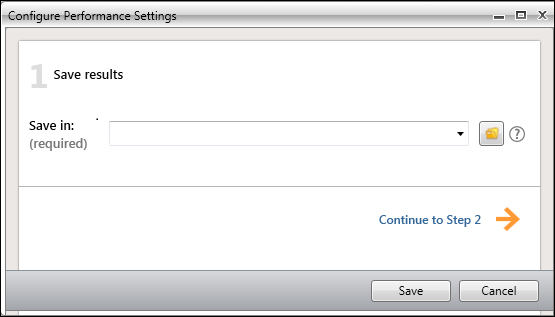
Configuring performance settings
On the first page, you can optionally change the folder in which the results will be stored as shown in the preceeding screenshot. The execution runs are saved to allow a history view and comparisons of various results. These features are handy for the test results analysis that we are going to see.
Click on the Continue to Step 2 button to continue with the selection of performance metrics present on the Gather Computer Performance Data window of the wizard. The steps are as follows:
- Select the Gather performance data checkbox, which if left unchecked will give only a summary of metrics gathered that are related to time, HTTP errors, and data size.
- Click on the Add a computer button.
- A section is now enabled to specify the server details; the first free input field allows the specification of a friendly name for the server to be monitored, so enter
Application Server. - In the free input field available on the computer, specify the server name of the IP address and click on the Connect button, since without a successful connection you will not be able to proceed to the next step.
- Once the connection is made, a panel containing the performance metrics is expanded. Choose the metrics from the list, as listed earlier, in the Performance Metrics Selection section of the test plan, which can be found under these nodes: ASP.NET, MSSQL$MSSQLSERVER[VERSION]:DATABASES, Logical Disk, Physical Disk, Memory, TCPv4, and Processor.
- Click on the Save as New Template button to store the current template in order to use it in the further tests.
- Fill the template name with
BugNet Templatein the pop-up dialog box. - Click on the Save button.
Our example gathers performance metrics from one server; however, you can click on the Add a Computer button to map all the servers in your application topology, and therefore collect the specialized metrics around each of them.
Now we are back to the Performance tab. This tab contains the same Quick Execution Run ribbon seen in the single test tab. We can optionally change the execution to run in any of the available browsers. Click on the Run button and wait until the execution terminates. Make sure that the Overview option is selected in the Views ribbon. The results are displayed in the overview mode as follows:
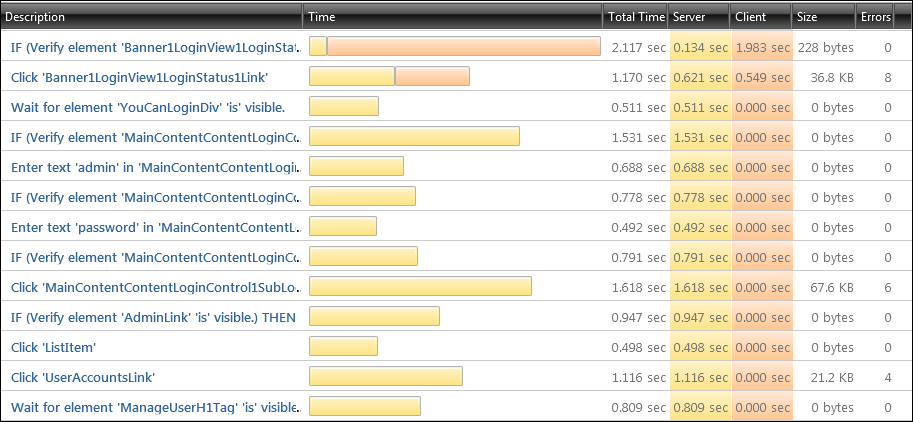
Performance test results in the overview mode
This screenshot contains a grid showing the time measurements of the test. The Description column has all the steps that form the test. The Server time is colored in light orange while the Client time in light pink. Notice how some steps involve only client time such as logical steps whereas the others are a combination of both.
Certain metrics map to time notions that we have seen earlier in the chapter, while others are additional custom metrics that are built using the former basic metrics. Therefore, Test Studio does not record all time metrics during the test execution, and only some of them are calculated. The following table represents the different time notions and their translation in Test Studio:
|
Test Studio terms |
Performance time metrics |
Type |
|---|---|---|
|
Server time |
Server processing time |
Recorded |
|
Client time |
Client processing time + network latency |
Calculated |
|
Total time |
Client time + server time + network time + time to fetch the object for the next step |
Recorded |
Other useful measurements are also displayed in the overview mode grid. The Size column has the amount of bytes processed at the server side whereas the Error column has the number of HTTP errors.
Finally, the Time column has a symbolic way of denoting the component that has consumed the maximum amount of time indicated in the Total Time column. Accordingly, the following can be deducted by simply traversing the test steps in the Time column:
- The largest Total Time
- The side that is causing the largest Total Time
- The largest Server Time
The following the identification of the largest time delays, the bottlenecks that are degrading the application performance can be highlighted.
We haven't seen yet the performance metrics that we assigned for gathering. For this purpose, Test Studio has another view mode called
Details view. Double-click on any step from the Overview mode. The following screenshot is a sample detailed view of the Perf-1_NewAccount test:
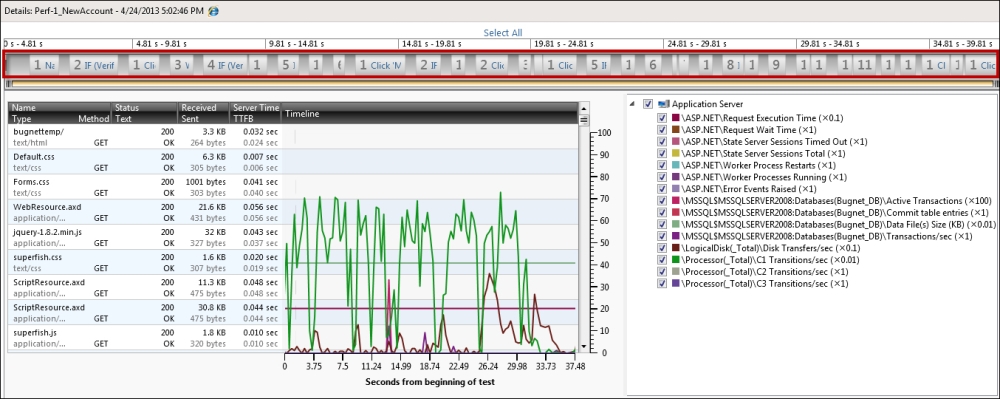
Performance test results in the details mode
The upper horizontal navigation bar highlighted in the preceding screenshot contains all the test steps. It allows you to switch among them in order to display the performance metric around one step at a time. Alternatively, any step range or even a global view can also be achieved by expanding the selection area to enclose as many desired steps. The Select All link has a direct alternative way of showing the performance metrics around all test steps.
The panel to the right lists the performance counters that were assigned during the performance test configuration. You can optionally check the set of metrics that you wish to draw on the performance chart.
Finally, the panel to the left contains all requests and responses under the scope of the selection area of the upper navigation bar. It has a detailed view of the HTTP request result, the total byte size sent and received, and the time to first byte or the response time, which is displayed in the Server Time column.
All the previously mentioned criteria are represented in the middle area in a chart.
After running automated tests on the web application, you might want to compare various runs against each other. This is useful after identifying the bottleneck and tuning the corresponding parameters in an attempt to improve the performance; for example, by increasing the available memory and CPU processors. Hence, at this stage you are seeking to have a closer detailed view of the collection of results.
Open the Perf-3_PerformQuery test and make two performance executions using BugNet Template created earlier. While on the Performance tab, click on the Compare button in the Views ribbon. We have now entered Test Studio built-in performance test comparisons. This is a powerful feature and it especially allows us to assess executions at a step level.
The first step shown in the following screenshot consists of choosing the execution runs and assigning them labels A and B correspondingly.
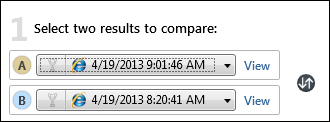
Selecting execution results for comparison
In order to allow Test Studio to quickly perform the calculations for unaccepted metric differences, step two allows the configuration of the thresholds for time, size, and error values. The following screenshot shows an example of the threshold values:
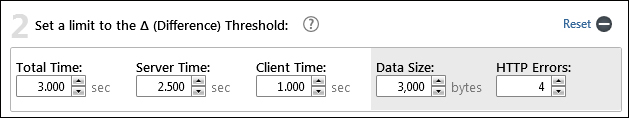
Setting thresholds
Here we are instructing Test Studio to warn us with an error whenever one of the following conditions is met:
- Total Time B - Total Time A >= 3 seconds
- Server Time B - Server Time A >= 2.5 seconds
- Client Time B - Client Time A >= 1 second
- Data Size B - Data Size A >= 3,000 bytes
- Errors B - Errors A >= 4 HTTP errors
The following screenshot shows how Test Studio has calculated the metric differences and applied the rules stated earlier:
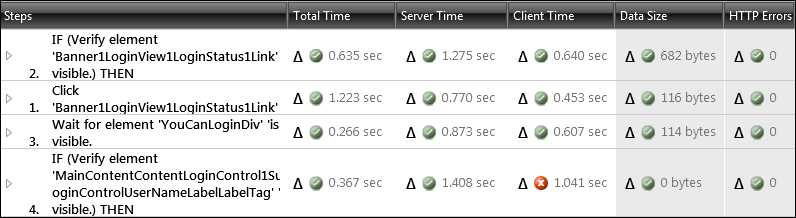
Thresholds applied in the comparison mode
The fourth step marked with a red and white cross has failed the client time rule whereas all the remaining steps marked with a green and white tick have passed all the rules.
The last view mode available in Test Studio is the
history view. In this mode, all test runs for a specific test are displayed in a grid-like view and then reported in a line chart. Here again, the data in the chart provides a fast way to directly discover the test with the best performance. The following chart is generated after running Perf-3_NewIssue four times:
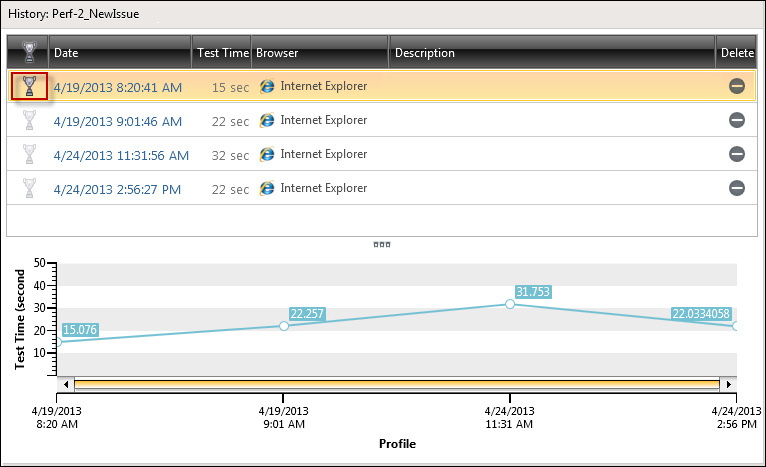
The history view
In performance testing, this test plays an important role in benchmarking other tests against it. Hence, as regression tests are being executed and performance improvements are being carried out on the web application, you may want to compare all the subsequent runs of this test to the one assigned as the benchmark. In Test Studio, you can tag this test by using the baseline feature. Among the list of executed test runs, search for the test with the best performance and click on the corresponding trophy icon to enable it as highlighted in the preceding screenshot.
In this way, we have selected the baseline test which is going to act as our performance reference point later.