
So far in this chapter, we have seen how Test Studio offers the standard built-in reports. However, knowing how much reporting is critical for making comprehensive decisions, your organization may need more specialized reports. So, this section takes the VS result file generated by Test Studio and suggests methods to create customized advanced reporting. These reports are going to be the result of the following processes:
First, let's examine the content of these files. Open the result file of the preceding example in a text editor to view its content. As mentioned before, it contains XML data where some of its significance is described in the following elements:
- The
TestRunelement holds:- A unique identifier referring to the test list's execution ID in its
idattribute - The name of the person (tester) who actually executed the test in its
runUserattribute
- A unique identifier referring to the test list's execution ID in its
- The
TestRunConfigurationelement holds:- The configuration ID for the test run in its
idattribute, which varies based on whether the test was run locally or, say, remotely - A
Descriptionnode containing the test list name in its inner text
- The configuration ID for the test run in its
- The
ResultSummaryelement holds important attributes in itsCounterschild that refers to the number of executed and non-executed tests that fall under one or more criterion such as failing, passing, aborted, completed, and so on. Each of the aforementioned criteria is represented by a corresponding attribute and will be referred to in the next section by a basic metric. - The
Timeselement out of the available dates contains:- The start date of the test list in its
startTimeattribute - The end date of all the tests inside the list in its
endTimeattribute
- The start date of the test list in its
- The
Resultselement contains:- An entry for each test comprised in the test list with details about the test's unique identifier, the name contained in the
testId, and thetestNameattributes respectively - The execution's unique identifier that provides uniqueness to the test ID within the execution context of all the test list runs, and it is contained in the
executionIdattribute - The test outcome contained in its
outcomeattribute - The start date of the test in its
startTimeattribute - The end date of all the tests in their
endTimeattribute
- An entry for each test comprised in the test list with details about the test's unique identifier, the name contained in the
After getting familiar with the structure of the test file and its significance, we can now draw a relation between its different components that allows building further customizable reports. In the following sections, we are going to create these reports by firstly submitting data to SQL tables and then charting them via Excel pivot tables.
The FC_DB database introduced in the previous chapters contains tables that could suggest an underlying storage design for the XML architecture. The following diagram depicts the relationship between the various tables:
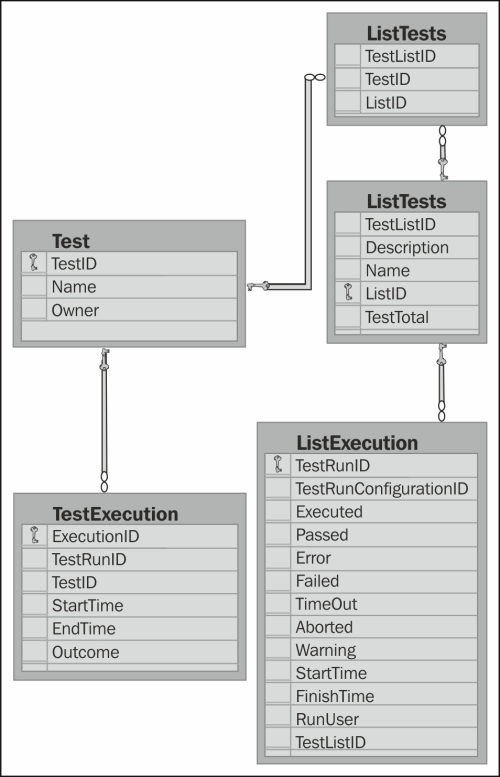
Design of the FC_DB database
The File Comparer application has a tab called Import Results, which serves as the tool for submitting the file results into the SQL tables. The database is already populated with some sample data coming from the execution of the created test lists in this chapter. To upload other files, the following steps are to be performed:
- Start the
File Comparerapplication. - Enter the complete path in the upper field, and click on the Add Files button.
- Repeat the preceding step for any number of files.
- Click on the Import button.
Submitting the data to SQL has now granted us more flexibility in crafting the reports based on metrics that were extracted from any GQM paradigm activity. The forthcoming charts are examples of reports that could contribute to test reporting in your environment now or perhaps after slight variations. The charts can be found in the File Comparer – Reports.xlsx workbook.
- Goal: This metric represents each basic metric extracted from the last run of all the test lists. Its goal can be to identify problems in the system under test and hint at the areas of improvements. It also serves to reflect a concrete picture about the testing progress and system quality, for example, in terms of how far are we from achieving the required user satisfaction.
- Data: This metric represents the actual test lists' execution of the basic metrics and their test list names.
- Influences: This metric will help in notifying and alerting stakeholders, supporting conclusions related to the exit criteria, presenting the cost of delaying the release, and determining the level of confidence.
- Query: The query is as follows:
SELECT [Executed]
,[Passed]
,[Error]
,[Failed]
,[TimeOut]
,[Aborted]
,[Warning]
,[StartTime]
,tl.[Description]
FROM [ListExecution] AS le
INNER JOIN(SELECT TestListID, MAX(StartTime) as LastExecution
FROM [ListExecution]
GROUP BY TestListID) AS lae
ON le.TestListID = lae.TestListID AND le.StartTime = lae.LastExecution
INNER JOIN [TestList] AS tl
ON le.TestListID = tl.ListID
- Summary table: The following is the data table returned by the preceding query. The test lists are displayed under the Row Labels heading, whereas the remaining columns hold the number of tests that satisfy the condition stated in the headers:
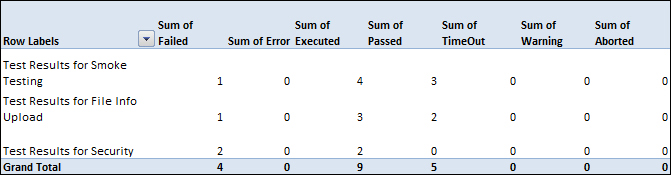
Data table for the execution metrics of the last run
- Chart: The following figure shows the data returned by the query in a column chart:
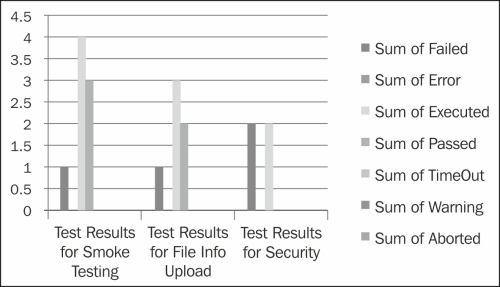
Column chart for the execution metrics of the last run
- Description: The chart has three types of columns repeated for each test list. The columns in green represent the number of executed test cases, whereas the purple and blue columns represent the tests that have passed and failed respectively. The pivot table for this metric can be further customized using the field list panel contained in the Execution Metrics for Last Run sheet of the
File Comparer – Reports.xlsxworkbook.
- Goal: This metric represents the percentage of failing test cases with respect to the total number of tests that were developed and executed. Its goal can be to determine the test case, the effort spent, and how efficient it is.
- Data: This metric represents the total number of executed test cases and the total number of failed tests during their last execution.
- Influences: This metric helps in making decisions related to the adopted testing techniques and whether the spent effort is effective in improving the quality.
- Query: The query is as follows:
SELECT (COUNT(te.TestID) * 100)/(SELECT COUNT(distinct TestID)
FROM [TestExecution]) AS [Defect Density]
FROM (SELECT MAX(StartTime) AS startTime, TestID
FROM [TestExecution]
WHERE Outcome = 'Failed'
GROUP BY TestID) AS te
- Equation: This metric represents that the total number of failed test cases divided by the total number of executed test c the total number of executed test cases is equal to 33 percent.
- Description: This metric suggests that 33 percent of the total executed test cases have resulted in errors.
- Goal: This metric represents the changes of a specific test suite's results with respect to time. Its goal can be to view bug-fixing activities over time. It helps in trending bug fixing from one run to the other. In addition, it can help in assessing the regression effect on the component in question following bug fixing on the system.
- Data: This metric represents the actual test list execution results.
- Influences: This metric could suggest taking actions, having a purpose to decrease the regression effect, such as enforcing quality starting from the developer through an application. An example of this is test-driven development.
- Query: The query is as follows:
SELECT [Executed],
[Passed],
[Error],
[Failed],
[TimeOut],
[Aborted],
[Warning],
[StartTime],
tl.[Description]
FROM [ListExecution] AS le INNER JOIN [TestList] AS tl
ON le.TestListID = tl.ListID
WHERE le.TestListID = 3
- Table: The data table returned by this query is shown in the following table. The first column in the table has the execution start time for the smoke testing suite. The remaining table columns contain summations of the basic metrics:
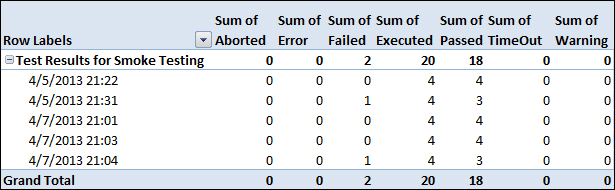
Data table for the execution metrics over time
- Chart: The following chart displays the data returned by the query:
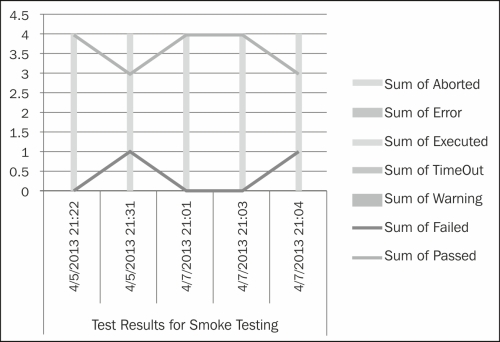
Chart for the execution metrics over time
- Description: This chart represents results for five runs of the smoke testing test list. The line in blue draws the changes in the number of passed tests over time, whereas the one in green draws the same change but in the number of failed tests. The pivot table for this metric can be further customized using the field list panel contained in the Execution Metrics over Time sheet of the
File Comparer – Reports.xlsxworkbook.
- Goal: This metric is a summary that holds information about feature coverage related to, firstly, the generated test cases for a specific feature versus the planned ones, and secondly, the executed test cases belonging to this feature. Its goal is to assess the actual testing progress with respect to the plan. It can also help in the calculation of risk coverage in case the risk residing in the various features is already identified. These types of metrics play an important role in determining the status against the testing exit criteria.
- Data: This includes the complete system feature list, the number of planned tests, the number of actual tests, the number of executed tests, and the last execution outcome for each test.
- Influences: These metrics affect decisions regarding release dates with respect to the quality confidence in the system. They help in evaluating the trade-offs between system quality, release time, and cost. It answers questions such as:
- The amount of risk residing in a feature based on the number of nonexecuted and failed test cases
- The cost of fixing the failing tests versus the cost of delaying the release
- The cost of releasing tests on time versus client dissatisfaction
- Query: The query is as follows:
SELECT a.FeatureName, a.ListID, a.TestTotal, a.Outcome, a.Name, CASE WHEN a.Outcome = 'NotRun' THEN '0' WHEN a.Outcome is NULL THEN '0' ELSE '1' END AS Executed FROM (SELECT t.FeatureName, t.ListID, t.TestTotal, lts.TestID, test.Name, (SELECT TOP(1) outcome FROM [TestExecution] AS te WHERE exists (SELECT * FROM [TestExecution] WHERE te.TestID = lts.TestID) ORDER BY StartTime DESC) AS Outcome FROM ( SELECT FeatureName, lt.ListID, lt.TestTotal FROM [FeatureList] AS fl left join [TestList] AS lt ON lt.[Description] LIKE '%' + FeatureName ) AS t LEFT JOIN [ListTests] AS lts ON t.ListID = lts.ListID LEFT JOIN [Test] AS test ON lts.TestID = test.TestID GROUP BY t.FeatureName, t.ListID, t.TestTotal, lts.TestID, test.Name ) AS a - Table: The following table shows the data returned by this query. The first column holds the list of features contained in the
[FeatureList]table. TheListIDcolumn has the ID of the test list that covers the feature appearing to its left. TheTestTotalcolumn has the total number of tests under this test list, where theNamecolumn lists these test names. TheOutcomecolumn shows the last execution result for the test appearing in theNamecolumn. ThePlanned Testscolumn has the estimated number of tests entered manually: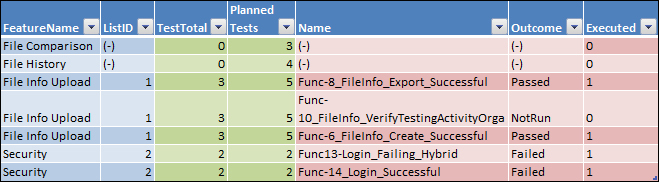
Data table for feature coverage
- Description: This summary table displays in its first column to the left the list of all the features of an application. The columns highlighted in green display the difference between the number of planned tests and the actual developed tests. The columns highlighted in red list the tests corresponding to each feature with their execution outcome if available. This table can be found in the Feature Coverage sheet of the
File Comparer – Reports.xlsxworkbook.
- Goal: This metric reflects the execution duration of a specific test over multiple executions. Its goal could be to assess how the execution time of a specific test is influenced by improving the efforts such as script refactoring or redesigning. To be able to accurately calculate the test duration, some factors should be stabilized, such as the system against which the specific improved test script should be repeatedly run or the connection speed. These measurements are for minimizing the external factors that could interfere with the execution duration of that test.
- Data: The start and end time duration of the repetitive test executions.
- Influences: This metric helps in assessing the automated development and improvement efforts adopted on the scripts and whether the time spent is justified by the amount of improved efficiency.
- Query: The query is as follows:
SELECT [ExecutionID]
,[TestRunID]
,[TestID]
,[StartTime]
,[EndTime]
,[Outcome]
,DATEDIFF(SECOND, StartTime, EndTime) AS duration, 'Func-1_FileCompare_Equal_Successful' AS Name
FROM [TestExecution]
WHERE TestID = (SELECT  TestID FROM [Test] WHERE Name = 'Func-1_FileCompare_Equal_Successful')
AND Outcome = 'Passed'
- Table: The following table contains the data returned by this query. The
Row Labelscolumn has the execution times for theFunc-1_FileCompare_Equal_Successfultest. TheTest Execution Durationcolumn contains the amount of time taken by the test to finish execution: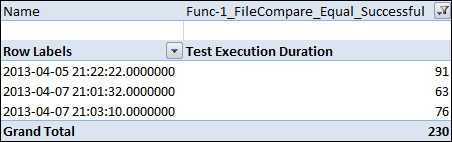
Data table for the test execution duration over time
- Chart: The following figure shows the data returned by the query in a pie chart:
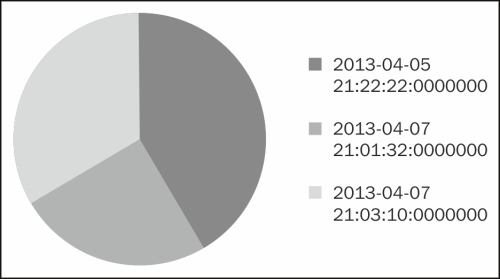
Pie chart for test execution duration over time
- Description: This pie chart represents the different durations for executing the
Func-1_FileCompare_Equal_Successfultest in its sections multiple times. The pivot table for this metric can be further customized using the field list panel contained in the Test Execution Duration sheet of theFile Comparer – Reports.xlsxworkbook.
The VS Result file has further benefits that allow you to come up with a customized way of comparing test execution results. The
File Compare tab of the File Comparer application, that we have previously automated, actually accepts these types of files generated by Test Studio and calculates the comparison scores based on the following formula:
Test Execution Score = Total number of executed test - (number of errors – number of failed – number of timed out – number of aborted – number of inconclusive – number of not executed – number of disconnected – number of warnings / 2).