
CHAPTER 10
Repurchase Agreements and Financing
The repurchase agreement or repo market might be the most important market about which most people know little or nothing. Money market funds (MMFs) and other investors rely on repo as a short‐term, liquid asset; broker–dealers and other financial entities use repo to fund their inventory of securities; repo enables market participants to take short positions in fixed income markets; and, as described in Chapter 0, the Federal Reserve has historically and continues presently to use repo to conduct monetary policy. Finally, and most recently, interest rate derivatives and many loan products are transitioning from the London Interbank Offered Rate (LIBOR) indexes to the Secured Overnight Financing Rate (SOFR), which is derived from rates on repo transactions.
The first few sections of the chapter describe repurchase agreements, the uses of repo, and the structure and size of the market. A short section then describes the computation of the recently prominent SOFR, a rate featured in Chapters 2, 12, and 13. The subsequent section explains some of the determinants of the interest rates on both general collateral (GC) and special repo transactions. The penultimate section discusses repo in the context of financing risk, along with relevant changes in banking regulation. The final section is a case study of how MF Global fell in large part due to its inappropriately sized “repo‐to‐maturity” trades.
10.1 REPURCHASE AGREEMENTS
The most straightforward description of a repurchase agreement or repo is as a secured loan with bonds or other financial instruments as collateral. Figures 10.1 and 10.2 depict an example in which one counterparty – the “repo seller” – borrows $109,898,438 for 44 days at a rate of 0.015%, while giving $100 million of the 2.75s of 02/15/2028 as collateral. At the time of the trade, the price of the bond is 109‐28 3/4, that is, ![]() per 100 face amount, which means that the value of the collateral at the start of the trade equals the amount loaned. In practice, the value of the collateral typically exceeds the amount loaned, and this feature of repo is discussed next. Continuing with the present example, however, Figure 10.1 shows the flows of cash and bonds at the initiation of the trade, and Figure 10.2 shows the flows at the expiration or unwind of the trade. In the latter, the repo seller pays principal plus interest,
per 100 face amount, which means that the value of the collateral at the start of the trade equals the amount loaned. In practice, the value of the collateral typically exceeds the amount loaned, and this feature of repo is discussed next. Continuing with the present example, however, Figure 10.1 shows the flows of cash and bonds at the initiation of the trade, and Figure 10.2 shows the flows at the expiration or unwind of the trade. In the latter, the repo seller pays principal plus interest, ![]() , or $109,900,452, to discharge the loan, and then takes back its $100 million face amount of bonds.
, or $109,900,452, to discharge the loan, and then takes back its $100 million face amount of bonds.

FIGURE 10.1 Initiation of a Repurchase Agreement.

FIGURE 10.2 Unwind of a Repurchase Agreement.
The lender of cash in Figures 10.1 and 10.2 is protected by the bonds taken as collateral against the loans: if the borrower of cash defaults, the lender of cash has a claim on those bonds. But lenders of cash in the repo market are protected even further by a safe harbor from the bankruptcy code, by a haircut or initial margin, and by variation margin.
With respect to the safe harbor, if the borrower of cash defaults on its loan, the lender may immediately liquidate the bonds held as collateral to recover the loan amount, returning any realized excess cash to the borrower. This is very different from the general treatment of secured loans, in which lenders are stayed or prevented from liquidating the collateral of defaulting borrowers until given permission to do so by a bankruptcy court. It is for this reason, in fact, that repo trades are legally structured as repurchase agreements and not as secured loans. Legally, the borrower of cash, that is, the repo seller, sells the bonds to the repo buyer at the start of the trade and agrees, at unwind, to repurchase the bonds at a slightly higher, prespecified price. While economically the same as a secured loan, this legal structure casts the unwind as the settlement of a securities trade, which enjoys a safe harbor from bankruptcy rules.1
In addition to the safe harbor, lenders of cash in the repo market are typically protected by haircuts or initial margin. At a haircut of 3% for example, collateral value is reduced by 3% when considered against the loan amount. Therefore, a repo seller can borrow only $97 against a bond worth $100, leaving a margin of $3, that is, an excess of collateral value over loan value of $3. In the example of this section, with a haircut of 3%, the cash borrower raises only 97% of $109,898,438, or $106,601,485, against the $100 million of the 2.75s of 02/15/2028, leaving initial margin of $3,296,953. With this buffer, if the borrower of cash defaults and the bonds fall in value from $109.9 million to, say, $108 million, the lender still has more than enough collateral value to cover the outstanding loan amount of $106.6 million.
Variation margin, the last of the protections mentioned earlier, requires borrowers to maintain collateral value as prices change so as to keep margin constant. Continuing with the example in the previous paragraph, if the bonds' value falls from $109.9 million to $108 million against the $106.6 million loan, the cash borrower receives a margin call to post additional bonds with a value of $1.9 million to restore margin to the original $3.3 million. Alternatively, the borrower can satisfy the call by paying the lender $1.8 million in cash, which reduces the loan amount from $106.6 million to $104.8 million, which is appropriately collateralized by $108 million of bond value at a haircut of 3%. If, on the other hand, bond value increases, the cash borrower can take back posted collateral or cash in excess of margin requirements. Variation margin calls in the repo market are typically issued daily.
Summarizing the protections in a repo agreement, a lender of cash suffers a loss only if the borrower defaults at the same time that collateral declines in value by more than posted margin.2
10.2 USES OF REPURCHASE AGREEMENTS
This section describes the four major uses of repurchase agreements: investing and cash management, long financing, shorts or short financing, and collateral swaps.
Repo is popular as a short‐term investment and as a place to park cash for a short period of time. Not only is lending cash through repo particularly safe, as explained in the previous section, but lenders can calibrate the default risks they are willing to bear by choosing haircuts (e.g., 2% for Treasuries, 5% for investment‐grade corporates), the set of acceptable collateral (e.g., government bonds with maturities less than two years, any government bond, government bonds and investment‐grade corporates), and their repo counterparties. Furthermore, by choosing the term of the repo agreement (e.g., overnight, 30 days), lenders can choose their desired liquidity, that is, the time after which they will again have use of their cash. Along these lines, repo is an important alternative to bank deposits. Both repo and bank deposits are highly liquid, but, while bank deposits of up to $250,000 are federally insured, larger deposits at many banks might not be considered as safe as secured repo investments.
Because of repo's popularity as a short‐term investment, many repo buyers are called repo investors. The most important class of such investors are money market funds, which are described in detail in Chapter 0. Because shareholders in these funds can easily redeem their shares for cash except, perhaps, in times of great stress, managers of money market funds maintain liquidity by investing a large portion of their assets in particularly liquid products, like repo. Mutual funds, which must also plan for some amount of shareholder redemptions, also invest in repo as a liquid investment. Other repo investors, like municipalities and nonfinancial corporations, are motivated by the need to manage cash inflows and outflows. A municipality receives tax payments and makes expenditures throughout the year, but the timing of receipts generally does not match the timing of outlays. Therefore, cash on hand needs to be invested in short‐term, safe products, like repo. Similarly, because the receivables and payables of nonfinancial corporations do not generally coincide, repo is often used to park excess cash on hand.
A second common use of repo is long financing, which refers to the purchase of financial instruments with mostly borrowed money. An important example, illustrated in Figure 10.3, is the use of repo by broker–dealers to facilitate market making in bonds. As shown in the top panel of the figure, a customer sells bonds to the trading desk, for which the desk pays cash. But the business model of trading desks is to earn relatively small fees relatively frequently using a minimum of scarce capital. Therefore, rather than using capital to purchase the customer's bonds, the trading desk chooses to raise funds in the repo market, that is, to repo out the bonds, or sell the repo, to a repo buyer. Note that, because of haircuts, the trading desk cannot raise the full value of the bonds it bought in the repo market. Consequently, the trading desk does use a small amount of its own capital to fund margin, that is, to pay the customer that portion of the purchase price that is not funded with repo. In short, a fixed income market‐making desk funds its inventory predominantly with repo, but in small part with capital.

FIGURE 10.3 Long Financing.
The bottom panel of Figure 10.3 shows how the trading desk exits its cash and repo market positions. At some point after the desk's original purchase of the bonds, another customer comes along wanting to buy those same bonds. The trading desk sells the bonds to the customer, uses the proceeds to pay off its repo borrowings and takes back the bonds for delivery to the customer. At this point it can be pointed out that purchases and sales of a particular bond on a given day cancel, and do not require repo funding. It is only the residual inventory carried from one day to the next that needs to be funded.3
Another example of long financing would be a trader or investor who wants to lever returns by buying a bond with borrowed money. At initiation, the investor buys the bond in the cash market and repos it out to raise most of the purchase price. To terminate the trade, the investor sells the bond in the cash market and uses the proceeds to pay off the repo loan. Of course, if the bond price falls in the interim, the investor must raise cash elsewhere to discharge the loan. While the market‐making desk described in the previous paragraph also seems to bear the risk of falling prices, market makers tend to hedge the interest rate risk of their inventory. Therefore, any loss on the long position, which leaves a deficit with respect to the repo loan, can likely be covered by the corresponding profits of a hedging, short position.
Sometimes the purchaser of a bond knows the exact term over which the bond needs to be financed. In most cases, however, the term of financing is not known. In the case of the market‐making desk, the customer that ultimately purchases the bond from inventory may appear very soon after the desk itself purchases the bond or days later. In the case of the leveraged investor, market conditions might cause the investor to terminate the position sooner or later. Therefore, the repo agreement in long financing trades may expire before the end of the trade. In that case, the repo seller needs to roll the repo. Consider a repo seller who has financed the purchase of $100 million face amount of the 2.75s of 02/15/2028 with an overnight repo along the lines of Figure 10.1. If the repo seller wants to stay in the trade for an additional day, that is, if the repo seller does not yet want to repay the repo loan, the repo buyer would have to agree to roll the loan for another day. If the repo buyer does agree, collateral or cash is adjusted to maintain the appropriate amount of margin, and the repo seller can keep the money for another day. If the repo buyer does not agree, the repo seller must find another counterparty to finance the position and use the money borrowed from that counterparty to repay the loan due to the original repo buyer. The process of rolling a repo is depicted in Figure 10.4. Note that, because the price of the bonds may have changed over the day, the repo seller may receive more or less cash from the new repo buyer than is needed to discharge the loan due to the original repo buyer.
The duration of repo agreements can be overnight,4 term (i.e., any fixed duration greater than one day), or open. Open repos are overnight repos that roll automatically for an additional day until cancelled by the lender of cash. The popularity of this contractual form reflects the many instances in which counterparties are unsure of how long financing will be needed.
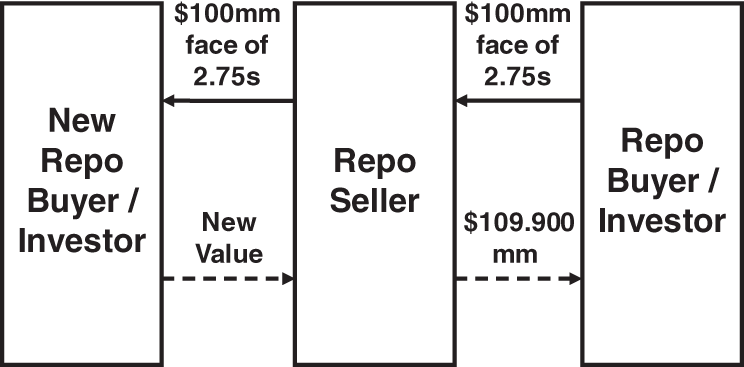
FIGURE 10.4 Roll of a Repurchase Agreement.
At this point, it can be noted that operational aspects of repo markets are complex. Consider the roll in Figure 10.4. The repo seller needs to post its bonds to the new repo buyer to get cash, but the original repo buyer is unlikely to release those bonds until its loan is repaid – that is, after all, the whole point of holding collateral. Issues like this are resolved through the services of a third‐party agent, as described in the next section.
A third common use of repo is the establishment of short positions or short financing. A short position is initiated by selling a bond without owning it, whether as a bet that its price will fall or as part of a larger trade to hedge a particular long position. In the top panel of Figure 10.5, a hedge fund sells bonds that it does not have to some buyer in the cash market. The hedge fund then takes the bonds it sold from a broker–dealer in the repo market, delivers those bonds to the buyer, receives the proceeds of the bond sale, and then lends those proceeds to the broker–dealer. To unwind its short position, as shown in the bottom panel of Figure 10.5, the hedge fund buys the bonds in the cash market, returns the bonds to the broker–dealer, collects its loan proceeds from the broker dealer, and uses those proceeds to pay for its purchase of the bonds in the cash market.
Using the language of this chapter, the hedge fund does buy the repo, but its motivation is very different from cash managers or investors who buy repo: the hedge fund's motivation is not to park or invest cash, but to borrow the bonds. For this reason, it is more commonly said that the hedge fund does a reverse repo or that it reverses in the bonds. Note that this industry jargon is such that a single transaction – the repo agreement between the broker–dealer and the hedge fund – changes names depending on the counterparty: the broker–dealer does a repo or repos out the bonds, while the hedge fund does a reverse repo or reverses in the bonds.

FIGURE 10.5 Short Financing.

FIGURE 10.6 Collateral Swap.
The different motivations for buying repo introduce another aspect of the repo market. As mentioned already, when cash managers and investors buy repo, they choose the general asset classes and maturities they are willing to accept as collateral. But they do not care about which particular bonds they receive. For this reason, these trades are called general collateral or GC trades, and the repo seller chooses which bonds to deliver subject to some set of general parameters. By contrast, a market participant who shorts a bond and does a reverse repo requires the exact bond that was sold in the cash market. These trades, therefore, are called special collateral or specials trades. The pricing of GC and special spreads is discussed later in the chapter.
The fourth and final use of repo discussed here is a collateral swap, which is described in Figure 10.6. A broker–dealer might choose to hold an inventory of corporate bonds but would like its overall holdings to be more liquid, that is, more easily and at a lower cost turned into cash, should the need arise. This preference for additional liquidity might result from prudent management, regulatory requirements, or both. In any case, at the same time, an insurance company or pension fund with long‐term holdings of Treasury bonds might be happy to sacrifice liquidity temporarily in order to earn some extra return. The broker–dealer and the insurance or pension company, therefore, might agree on a collateral swap: the broker–dealer exchanges its corporates for Treasuries over the term of the trade, paying a fee to do so (e.g., 25 basis points on the value exchanged).
10.3 MARKET STRUCTURE AND SIZE
Table 10.1 summarizes the structure and size of the repo market, as of July 2021.5 A main division of the market is between the tri‐party and bilateral markets. In tri‐party trades, an agent provides various collateral management services. In bilateral trades, the two counterparties to each repo transaction manage all of the operational details.
One of the key services of the tri‐party system is to eliminate the risk that collateral is sent without cash being received or that cash is sent without collateral being received. At the initiation of a trade, this is accomplished as follows. The repo buyer sends cash and the repo seller sends collateral not to each other, but to a tri‐party repo agent. The agent, after verifying receipt of both cash and collateral, moves the cash into the seller's account and the collateral into the buyer's account. Similarly, at the expiration of the repo, the agent verifies that appropriate amounts of cash and collateral are available and, only then, moves the cash into the buyer's account and the collateral into the seller's account.
A second significant tri‐party service ensures that repo margin is enforced along the lines described earlier in the chapter. More specifically, for every transaction, the tri‐party agent verifies that the collateral received is acceptable relative to parameters set by the repo buyer, values that collateral at current market prices, and issues daily variation margin calls as required by the haircut schedule of the repo buyer.
The third significant tri‐party service is to optimize the use of general collateral. As mentioned earlier, each repo buyer accepts collateral that conforms with, for example, customized constraints on asset class, credit rating, and maturity. At the same time, each repo seller has a portfolio of diverse securities it wants to post as collateral. Furthermore, not surprisingly, repo loans earn a higher rate when extended against less desirable collateral. The tri‐party agent, then, accounting for the constraints across its customers, their repo trades on a particular day, and current market prices and repo rates, suggests to each repo seller an optimal allocation of its available collateral, that is, a schedule of which collateral should be posted to which repo buyer.
TABLE 10.1 Structure of the US Repo Market, as of July 2021, in $Billions.
| Tri‐Party | Bilateral | |
|---|---|---|
| Uncleared | 2,964 | ?? |
| Cleared | 238 | 1,181 |
| (GCF) | (DVP) |
Sources: Federal Reserve Bank of New York; Office of Financial Research; SIFMA; and Author Calculations.
Table 10.1 shows that the tri‐party repo market is divided into two segments. The larger segment, with nearly $3 trillion of outstanding collateral value, consists predominantly of GC trades between repo investors (e.g., money market funds) and dealers, who fund their securities positions with repo. The smaller segment, at $238 billion, is the General Collateral Finance or GCF repo service. In this “blind‐brokered” market, dealers trade anonymously with each other to redistribute funds received from repo investors. GCF repo trades are cleared by the Fixed Income Clearing Corporation (FICC), which means that each counterparty to a GCF repo trade faces the FICC, instead of its original trade counterparty.6 This segment of the market also includes sponsored repo, in which non‐member repo counterparties that are backed by members can trade GCF repo on their own accounts.7
The bilateral repo market is summarized in the rightmost column of Table 10.1. Because tri‐party is particularly focused on managing the collateral of GC trades, the bilateral market is used for the GC trades of those who, for various reasons, do not participate in tri‐party, and for specials trades. Like the tri‐party market, the bilateral market is divided into an uncleared and a cleared segment. Relatively little aggregated data is available about the uncleared segment precisely because its transactions are completely managed by the individual counterparties. The bilateral, cleared market comprises the delivery‐for‐payment or DVP service of FICC. The trades in this inter‐dealer market can be arranged or blind‐brokered, and they are cleared by the FICC. The size of the DVP market is about $1.2 trillion in loan value.
Figure 10.7 considers the repo market from the perspective of various sectors of market participants. Note that, in accounting terms, lending cash or buying repo is an asset, and borrowing cash or selling repo is a liability. While broker–dealers do sell repo to finance security holdings, they also run large matched books through which they make markets in repo, that is, they buy repo from some customers and sell to others in a balanced way. The combination of a matched book and long financing leads to the profile shown in the figure, namely, a large quantity of repo assets offset by repo liabilities and an additional quantity of repo liabilities. Money market funds, as discussed, are in the business of investing short‐term funds and use repo to do so. The foreign sector (excluding foreign bank offices in the United States) is approximately balanced in repo assets and liabilities, while bank repo liabilities are somewhat greater than their repo assets. The Federal Reserve borrows cash in the repo market through its reverse‐repo facility, as explained in Chapter 0. Real Estate Investment Trusts (REITs) borrow money through repo, while the remaining sectors shown – municipals; GSEs, like FNMA and FHLMC; and mutual funds (MFs) – invest in repo as a liquid, short‐term investment.

FIGURE 10.7 US Repo Market as Assets and Liabilities, by Sector, as of March 2021.
Source: Financial Accounts of the United States, Board of Governors of the Federal Reserve System.
Continuing the discussion of repo market structure, Table 10.2 gives the composition of collateral in tri‐party repo, ex‐GCF. Underlining the safety of repo transactions, a large portion of collateral is government guaranteed, with 62% in Treasuries and 21% in government‐guaranteed mortgage‐backed securities (MBS). Furthermore, although not shown in the table, the $238 billion of GCF repo consists entirely of Treasury, Agency, and GSE MBS. Some of the tri‐party market, however, as shown in Table 10.2, does include repo using riskier collateral.
To conclude this section, Table 10.3 gives the median haircut on collateral in tri‐party, ex‐GCF. Recalling that a cash lender loses money only if its counterparty defaults and the collateral falls in value by more than the haircut, cash lenders demand higher haircuts for riskier collateral. Risk in this context is measured not only by price volatility and the possibilities of large price declines but also by illiquidity: in the event of a default, lenders recover only what they can realize through the sale of the collateral they hold. Consistent with these considerations, the median haircuts in Table 10.3 do increase with risk. The most liquid, government‐guaranteed collateral requires a haircut of only 2%, while the riskiest and least liquid securities require a haircut of 8%.
TABLE 10.2 Collateral Composition of Tri‐Party Repo (ex‐GCF), as of July 2021. Collateral Value Is in $Billions.
| Asset Class | Collateral Value | Percent |
|---|---|---|
| Treasuries | 1,847 | 62.3 |
| Agency and GSE MBS | 627 | 21.1 |
| Equities | 209 | 7.1 |
| Corporates, Investment Grade | 74 | 2.5 |
| Agency and GSE CMOs | 52 | 1.8 |
| Corporates, High Yield | 42 | 1.4 |
| Agency and GSE Debt | 33 | 1.1 |
| Other | 80 | 2.7 |
| Total | 2,964 | 100 |
Sources: Federal Reserve Bank of New York; SIFMA; and Author Calculations.
TABLE 10.3 Median Tri‐Party Repo Haircuts (ex‐GCF), as of July 2021. Haircuts Are in Percent.
| Asset Class | Haircut |
|---|---|
| Treasuries; Agency Debt and MBS | 2 |
| Agency and GSE CMOs | 4 |
| Corporates (IG); Money Mkt; Private CMO (IG); Int'l | 5 |
| ABS (IG) | 7 |
| Equities; Corporates (HY); ABS(HY); Private CMO (HY); Munis | 8 |
Sources: Federal Reserve Bank of New York; and SIFMA.
10.4 SOFR
In the transition away from LIBOR in the United States, discussed in detail in Chapter 12, regulators and others have advocated for a transition to the Secured Overnight Financing Rate, or SOFR. Intended to represent the rate of secured, overnight borrowing, the Federal Reserve Bank of New York calculates SOFR using daily repo transactions in the tri‐party and DVP markets. However, DVP repo transactions are trimmed so as to exclude the lower‐rate, presumably specials trades, which reflect the idiosyncrasies of lending on individual bond issues. In particular, the 25% of DVP repo trade volume with the lowest rates are excluded from the data used to calculate SOFR.
TABLE 10.4 SOFR and Treasury Repo Rates, as of May 14, 2021. Rates Are in Basis Points.
| 1st | 25th | Median/ | 75th | 99th | Volume |
|---|---|---|---|---|---|
| %ile | %ile | SOFR | %ile | %ile | ($billions) |
| −4 | −1 | 1 | 1 | 15 | 865 |
Source: Federal Reserve Bank of New York.
Given all included transactions on a given day, SOFR that day is calculated as the “volume‐weighted median” rate. This means that SOFR is determined such that 50% of the volume of loan amounts are at a lower rate and 50% at a higher rate. Table 10.4 provides information about the calculation of SOFR on May 14, 2021. From $865 billion of trades on that day, SOFR is set to the volume‐weighted median rate, which is one basis point. Trades representing 50% of the volume – from the 25th to the 75th percentiles – include rates between minus one and plus one basis point.
10.5 GC AND SPECIAL REPO RATES
This section discusses the interest rates on repo loans. Conceptually, there is a distinct rate for every repo term and for every type of collateral: one rate for overnight repo on investment‐grade corporate collateral; another rate for one‐month repo on government‐guaranteed mortgage‐backed securities; etc. There is, however, a benchmark repo rate, called “the GC rate,” which is the overnight rate earned by lenders willing to accept any Treasury collateral.
Some insight into the determination of the GC rate can be gained by comparing the effective federal funds rate (EFFR) with the GC rate. The interbank EFFR is a highly creditworthy, overnight, unsecured rate, which can be compared with the GC rate, a highly creditworthy, overnight, secured rate. To this end, Table 10.5 shows percentiles of the differences between effective fed funds and the GC rate, from January 2001 to July 2021.
The median, or 50th percentile, of the difference is one basis point. It is not surprising that an overnight unsecured rate, EFFR, tends to be above an overnight secured rate, GC. It is also not surprising that the spread is relatively small, because, as an overnight rate between banks, EFFR is a rate on a very high‐quality loan. What is surprising and instructive, however, is by how much these two rates can diverge, in either direction. The 95th percentile of the spread, for example, has EFFR 15 basis points above GC, while the 5th percentile has EFFR 13 basis points below GC. And at greater extremes, for the 0.5 and 99.5 percentiles, EFFR is 113 basis points above and 37 basis points below GC, respectively.
TABLE 10.5 Percentiles of Daily Spreads of the Federal Funds Effective Rate over the General Collateral Treasury Repo Rate, from January 2, 2001, to July 12, 2021. Spreads Are in Basis Points.
| Percentile | Spread |
|---|---|
| 0.5 | |
| 5.0 | |
| 25.0 | |
| 50.0 | 1.0 |
| 75.0 | 5.0 |
| 95.0 | 15.0 |
| 99.5 | 112.6 |
Sources: Federal Reserve Bank of New York; Barclays Capital; and Author Calculations.
To explore these large deviations, Figure 10.8 graphs the EFFR–GC spread over time. There are five particularly large and sudden increases in the GC rate, which result in large, negative spreads. In general, these episodes are all manifestations in the Treasury repo market of a relatively desperate need to raise cash and a willingness to pay high rates to do so. The first was in September 2001, shortly after the terrorist attack on the World Trade Center. Damage to infrastructure in downtown New York City temporarily disrupted the normal flow of funds and sent market participants, including banks, scrambling for cash. Liquidity provision by the Federal Reserve and infrastructure repair restored market order in a couple of weeks.
The next events, September 30, 2016, and December 31, 2018, are at quarter end and year end, respectively. Many market participants are believed to engage in “window dressing” at the end of reporting periods, possibly to impress investors and possibly to meet various regulatory requirements. This entails temporary measures such as increasing liquidity and cutting back on loans, which, if prevalent enough, push up repo rates as borrowers hunt for cash among willing lenders. Quarter‐ and year‐end market disruptions have become less frequent over the decades, as the Federal Reserve has successfully anticipated and accommodated the resulting scarcities of cash. As the two highlighted events suggest, however, quarter‐ and year‐end disruptions are not extinct.

FIGURE 10.8 Daily Spreads of the Federal Funds Effective Rate over the General Collateral Treasury Repo Rate, from January 2, 2001, to July 12, 2021.
Sources: Federal Reserve Bank of New York; Barclays Capital; and Author Calculations.
Continuing with the next negative spread events in Figure 10.8, in September 2019, a number of cash‐draining incidents happened at about the same time: quarterly corporate tax payments; settlement of newly issued Treasuries; and a holiday in Japan, which temporarily sidelined some Japanese investors in US repo. But the magnitudes of these incidents seem small relative to the realized cash scarcity and to the Federal Reserve's subsequent large and long‐lasting injections of liquidity. Furthermore, banks did not lend to take advantage of the resulting abnormally high repo rates despite having significant reserves. Another, though smaller, negative spread event occurred in March 2020, when banks also refrained from lending at seemingly advantageous rates and from purchasing seemingly mispriced Treasuries, which was the larger dislocation at the time. The reluctance of banks to commit funds during these market dislocations is discussed later in the chapter.
In addition to large negative spreads, Figure 10.8 shows several instances of very large positive spreads, particularly through the financial crisis of 2007–2009. The two largest such events were in the second half of August 2007, which marked the beginning of the subprime mortgage crisis, and mid‐September 2008, when Lehman Brothers filed its bankruptcy. During credit events, when market participants worry about each other's ability to satisfy their obligations, there is a rush out of risky assets and into safe assets, including GC repo. As a result, GC repo rates decline and the EFFR‐GC spreads become large.
TABLE 10.6 Treasury Special Spreads, as of May 27, 2021. Entries Are in Basis Points.
| 2yr | 3yr | 5yr | 7yr | 10yr | 20yr | 30yr | |
|---|---|---|---|---|---|---|---|
| On‐the‐Run | 5 | 1 | 13 | 9 | 3 | 2 | 4 |
| Old | 2 | 2 | 2 | 1 | 11 | 2 | 12 |
| Double‐Old | 2 | 10 | 6 | 8 | 10 | 2 | 3 |
| Triple‐Old | 2 | 12 | 2 | 3 | 3 | 2 | 2 |
Source: Citi.
Having completed an overview of the GC rate, the discussion turns to special rates, the rates earned on loans when particular bonds are required as collateral, usually to facilitate short sales. While any bond can “trade special,” that is, be required as collateral in a special repo trade, the most common specials in the US repo market are recently issued Treasuries bonds. As mentioned in earlier chapters, the most recently issued Treasuries tend to be the most liquid, and, for this reason, often trade at a premium to otherwise similar bonds. Similarly, market participants who want to short bonds prefer to trade in these bonds and are willing to pay to do so. And the way they pay more to short these bonds is to lend at a relatively low repo rate when taking these bonds as collateral.
The special spread of a bond to a given term is defined as the difference between the GC rate and the special rate on that bond to that term. Table 10.6 shows the overnight special spreads of various recently issued bonds. The on‐the‐run (OTR) bond of each maturity is the most recently issued bond of that maturity, the old bond is the second most recently issued, and so forth. The overnight special rate for the on‐the‐run five‐year bond, for example, is 13 basis points below the GC rate, while the old 10‐year special rate is 11 basis points below GC. The special spread for each bond is idiosyncratic and time varying, depending on supply and demand for that bond as collateral, which, by the way, often involves a different set of market participants than the supply and demand for sale or purchase of the bond outright. Despite the idiosyncratic nature of special spreads, more can be said about them in terms of the Treasury auction cycle.
Figure 10.9 graphs the overnight special spread of the OTR 10‐year Treasury note over time. Recall from Chapter 0 that a new 10‐year note is issued every February, May, August, and November and is reopened after one month and again after two months. The special spreads in the figure, therefore, correspond to different bonds as new 10‐year notes are issued. The dotted, vertical, gray lines mark the dates of these new issues; the solid, gray lines mark their first reopenings; and the dashed, gray lines mark their second reopenings. The first lesson from the figure is that, as mentioned in the previous paragraph, the behavior of the special spread is very idiosyncratic: some OTR 10‐year notes become very special, and some do not.8 The second lesson is that the OTR notes tend to become particularly special into their first reopening. Of the bonds shown in the graph, only one clearly violates this rule: its specialness peaks in January 2021, which corresponds to its second reopening.
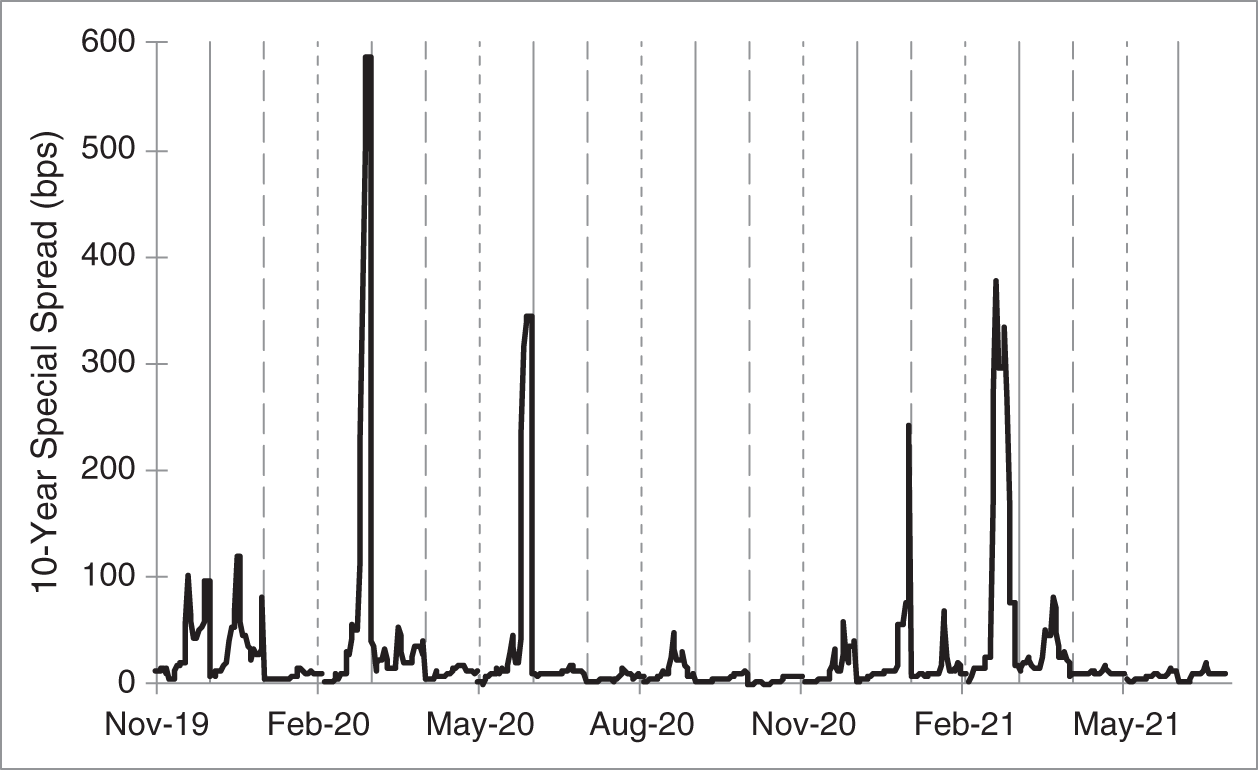
FIGURE 10.9 On‐the‐Run 10‐Year Treasury Special Spread.
Sources: Barclays Capital; and Author Calculations.
Figure 10.10 describes the average behavior of special spreads over the auction cycle from November 2008, when the Treasury auction cycle first settled into quarterly issuance and monthly reopenings, through July 2021. This period of time spans the issuance of 51 10‐year notes. The thick, black line in the figure gives the average special spread across these 51 notes as a function of the number of days to the first reopening. For example, with 13 days to the first reopening, the average special spread across the 10‐year notes in the sample is 85 basis points. The thick, dark gray line in the figure gives the average special spread as a function of the days to the second reopening, and the thick, light gray line gives the average special spread as a function of the days to the next new issue.9

FIGURE 10.10 Average 10‐Year Treasury Special Spread over the Auction Cycle, with Two Standard Deviation Confidence Intervals, from November 2008 to July 2021.
Sources: Barclays Capital; and Author Calculations.
The figure shows that, on average, the special spread is relatively low right after an auction, but then increases into the next auction. Furthermore, the increase into the first reopening is highest, reaching 156 basis points the day before the first reopening. The increase into the second reopening is smaller, reaching 48 basis points the day before the second reopening. And the increase into the new issue is smallest, reaching less than 20 basis points in the days before the new issue.
The market behavior behind these results is as follows. When a note is first issued, the previously issued note is still the most liquid in the maturity range and the most popular choice as a short. As the first reopening approaches, two things happen. First, liquidity shifts from the previously issued note to the new OTR note. Second, dealers increase shorts in the OTR note to hedge their market‐making purchases of notes issued in the next auction. This segment of short demand disappears just after the first reopening but builds up again into the second reopening. The special spread does not increase as much as into the first reopening, however, because the supply of the OTR notes is now significantly larger. The cycle then repeats once more, into the issue of the next OTR note, but the supply of the current OTR notes is now too large for the special spread to increase by very much.
While the story in the previous paragraph describes average behavior, Figure 10.9 illustrates how the behavior of special spreads varies across bond issues. Figure 10.10 emphasizes this point by showing, with dotted lines around the averages, two‐standard‐deviation confidence intervals. For example, while the average special spread of an OTR 10‐year one day before its first reopening is 156 basis points, the two‐standard‐deviation range around that average is from 116 to 196 basis points.
To conclude the discussion of special spreads, recently issued bonds can command a price premium not only because they are relatively liquid but also because they have value as collateral in the repo market. Put another way, not only can holders of recent issues trade out of their holdings easily, but they can borrow money cheaply by posting these issues as collateral. In fact, along the lines of Figure 10.10, traders can model the special spread of an individual issue over time and thereby estimate the value, over its life, which arises from its expected repo specialness.
10.6 LIQUIDITY MANAGEMENT AND CURRENT REGULATORY ISSUES
A financial institution can borrow funds in many ways, some of which are more stable than others, that is, some of which can be easily maintained under financial stress and some of which cannot. The most stable source of funds is equity capital, because equity holders do not have to be paid on any schedule and because they cannot compel a redemption of their shares. Slightly less stable is long‐term debt, because bondholders are paid interest and principal as set out in bond indentures. At the other extreme of funding stability is short‐term unsecured funding, like commercial paper: these borrowings have to be repaid in a matter of weeks or months, as they mature, when the institutions, under adverse conditions, might not be able to borrow money elsewhere. Not surprisingly, the more stable sources of funds are usually more expensive in terms of the expected return required by the providers of funds. Through liquidity management, firms balance the costs of funding against the risks of finding themselves without enough funding to survive.
In the spectrum of financing choices, repo borrowing is cheap, but relatively unstable. This instability is evident with respect to short‐term repo on credit‐sensitive and relatively illiquid assets. In times of financial stress, many market participants sell these low‐quality assets, both to reduce risk and to raise liquidity. Meanwhile, in the repo market, lenders both raise haircuts and reduce lending on low‐quality collateral. This makes it difficult for repo sellers of that collateral – like trading desks funding inventory or hedge funds leveraging trades – to raise cash. And if it turns out that they cannot find sufficient funding, they might be forced to unload their holdings in fire sales that result in significant losses.
The instability of repo borrowing on high‐quality collateral, like Treasuries, is less evident. Before the financial crisis of 2007–2009, it was widely believed that a firm could always fund its Treasuries. First, in times of stress, lenders are looking for liquid and safe investments. Second, even if the creditworthiness of the cash borrower is called into question, the cash lender has Treasury collateral, which, if necessary, can be liquidated relatively easily. The financial crisis dispelled this complacency. Lenders sought to minimize their connections to troubled financial institutions, including their buying of Treasury repo. While they could, indeed, legally liquidate those Treasuries in the event of a default, the timing and manner of their doing so could be questioned in bankruptcy proceedings and could drag them into years of litigation.
The financial crisis of 2007–2009 found many financial institutions with highly leveraged positions in mortgage‐related assets. As these assets lost value, an overreliance on wholesale funding,10 from various forms of commercial paper to repo, accelerated the onset of distress. In response, the bank regulatory regime has changed in ways that significantly impact repo participants and markets.
First, banks have become subject to liquidity ratios, namely, the liquidity coverage ratio (LCR) and the net stable funding ratio (NSFR). The LCR requires that banks hold enough high‐quality, liquid assets (HQLA) to meet net cash outflows over a 30‐day stress scenario. Reserves held in the Federal Reserve System and Treasuries receive full credit as HQLA, while lower‐quality assets may fulfill part of the requirement at a haircut. The NSFR requires that bank funding of relatively illiquid assets be stable over a one‐year horizon. The direct and intended effect of these ratios is to limit the amount of short‐term, wholesale funding, including repo. Less directly and perhaps less intended, regulators' implementation of the LCR, combined with their additional stress tests of bank liquidity, have pushed banks to rely heavily on reserves to satisfy HQLA requirements.11 This implies that regulation, as currently implemented, discourages using reserves to lend money and take Treasury collateral.
Second, banks have become subject to a leverage ratio, called the supplementary leverage ratio (SLR) in the United States. Unlike risk‐based capital requirements, which require banks to hold capital in proportion to the perceived risks of their assets, the leverage ratio requires that bank capital exceed a certain percentage of the value of all assets, regardless of risk. But penalizing large positions regardless of risk discourages large repo positions, which have very little risk per dollar and commensurately low return per dollar. Consider, for example, a matched book business in Treasury repo, mentioned previously, which lends and borrows money on Treasury collateral. This market‐making business in extremely safe transactions can make money and cover fixed costs only in large size, but the leverage ratio discourages size.
These two sets of rules may have been partly responsible for the aforementioned September 2019 and March 2020 episodes in which banks did not use their abundant reserves to lend in the Treasury repo market at abnormally high rates. Or, put another way, regulators are still calibrating the necessary quantity of reserves in the context of a relatively new regulatory regime. In fact, one of the ways the Federal Reserve and other regulators addressed the March 2020 disruption was to exclude reserves and Treasuries from the SLR temporarily, from May 15, 2020, to March 31, 2021.
10.7 CASE STUDY: MF GLOBAL'S REPO‐TO‐MATURITY TRADES
In March 2010, MF Global was a broker–dealer and futures commission merchant, in the business of making markets in exchange‐traded and over‐the‐counter derivatives.12 Experiencing poor performance, in particular, a fiscal‐year loss of $195 million in its core businesses, the company hired Jon Corzine as CEO. Corzine worked for Goldman Sachs from 1976 to 1999 and was chair and CEO from 1994 to 1999. He was a US senator from New Jersey from 2001 to 2006 and the governor of New Jersey from 2006–2010.
Corzine was told by the ratings agencies that MF Global would need to increase earnings to avoid a ratings downgrade, with Moody's specifying a target of between $200 million and $300 million pretax annual profits by September 30, 2011. Faced with this timeline, and pursuing part of a larger vision for the company, Corzine focused on proprietary trading and discovered a particularly attractive opportunity in European government bonds.
Europe was in the throes of its sovereign debt crisis, with rising concerns about the solvency of countries in weaker fiscal positions. As one way of dealing with the situation, the European Union created the European Financial Stability Facility (EFSF), in which all of the countries in Europe, as of May 2010, essentially guaranteed each other's debt until the end of June 2013.
TABLE 10.7 European Short‐Term Government Bond Rates, as of December 2010. Rates Are in Percent.
| Country | Short‐Term Bond Rate |
|---|---|
| Germany | 0.70 |
| Italy | 2.25 |
| Spain | 3.32 |
| Portugal | 4.50 |
| Ireland | 6.00 |
In this setting, Corzine proposed repo‐to‐maturity (RTM) trades in the short‐term bonds of the weaker European sovereigns. More specifically, MF Global would buy the short‐term debt of the weaker sovereigns and sell repo to the maturity of the bonds. Table 10.7 gives the prevailing rates on short‐term government bonds at that time. Term repo rates on these bonds were essentially risk‐free rates, and approximately equal to Germany's short‐term bond rate. Furthermore, haircuts on European sovereign repo were about 3%. Hence, in these RTM trades, MF Global could earn the rates in Table 10.7 on its bond purchases, funded at a repo interest rate cost of about 0.70%.
These RTM trades were designed to minimize risk. First, no investments were to be made in the government bonds of Greece, the weakest sovereign at the time. Second, by investing in short‐term bonds only, specifically those that mature before the earliest possible expiration of the EFSF in June 2013, default risk was minimal: bondholders would lose principal only if Europe as a whole reneged on its EFSF commitments, which was considered extremely unlikely. Third, by selling the repo to the maturity of the bonds, there was no risk of losing funding in the middle of the trade.13 Funding the trades with overnight repo, by contrast, runs the risk that funders refuse to roll as sovereign creditworthiness deteriorates and prices fall. In that scenario, instead of realizing the full principal amount at maturity, MF Global could be forced into selling the bonds early at a loss in order to pay off the repo loans.
The RTM trades were also attractive from an accounting perspective. Assume that MF Global owns a bond today. Then, by selling the repo today, the firm receives money today and extinguishes future cash flows: the bond's principal payment at maturity is used to pay off the repo loan. By this reasoning, accounting rules at the time regarded selling the repo as equivalent to selling the bond today. Therefore, when MF Global bought a bond and sold the repo, it could immediately book the profits from the trade (i.e., the difference between the bond coupon and repo interest) and did not have to disclose the trades to investors. The immediate booking of profit was particularly appealing to Corzine, who was under pressure to show earnings to the rating agencies. But the failure to disclose the trades would contribute to the firm's problems later on. In any case, MF Global quickly grew its position in RTM trades, from which it booked $15 million in profits in the third quarter of 2010; $47 million in the fourth quarter; $25 million in the first quarter of 2011; and more than $38 million in the second quarter.
MF Global's risk manager, Michael Roseman, understood one significant risk of the RTM trades. Had the repo counterparty been a dealer, the haircut would likely have been fixed over the term of the repo. There would be variation margin calls, of course, but those are limited to restoring the initial haircut. MF Global's repo, however, was with the London Clearing House (LCH), which has the right to change haircuts at any time. Roseman recognized that, if the sovereign credit situation worsened and LCH increased haircuts, MF Global might not have enough cash on hand to stay in the trades. That is, bonds might have to be sold at a loss to raise cash to post as additional margin. He therefore supported a position limit of $4.75 billion, because, at that size and at an assumed worst‐case scenario of average haircuts at 15%, MF Global would be able to meet future margin requirements with readily available cash.
MF Global grew its RTM positions rapidly, reaching the $4.75 billion limit by year‐end 2010. MF Global wanted to increase its position further, however, and fired Roseman at the end of January 2011. The trajectory of MF Global's position is shown in Figure 10.11. Positions increased dramatically in 2011, reaching a peak of $11.5 billion in June. This peak position included a significant volume of reverse RTM trades, in which MF Global shorted French government bonds and loaned the proceeds in repo. These reverse RTM trades were expected to reduce margin requirements and the volatility of variation margin calls, because, to the extent that the prices of weaker sovereign bonds and French bonds move together, changes in the collateral value of the weaker sovereigns posted by MF Global are offset by changes in the collateral value of French bonds held by MF Global. To the extent that weaker sovereign bond prices fall more than French bonds, of course, the reverse RTM trades do not hedge the RTM trades. And, in any case, the reverse RTM trades do not reduce the risk of repo haircuts increasing for the weaker sovereigns.
Along with MF Global's position size, Figure 10.11 shows haircuts over time for repo on the bonds of two of the more challenged European sovereigns, namely, Ireland (IE) and Portugal (PT). Haircuts were increased several times, from 3%, when MF Global first put on its trades, to 80% in July 2011. In other words, for these sovereigns, required margin on a repo of 100 of collateral value rose from 3 to 80. These dramatic increases in margin were likely due partially to deteriorating sovereign credits and partially to the size and perceived precariousness of MF Global's position.

FIGURE 10.11 MF Global Repo‐to‐Maturity Positions and Margin.
TABLE 10.8 MF Global Repo‐to‐Maturity Positions and Margin.
| Position | Margin | Margin | |
|---|---|---|---|
| Date | ($billions) | ($millions) | (%) |
| 06/06/11 | 170 | 2.9 | |
| 06/20/11 | 11.5 | 550 | 4.8 |
| 09/30/11 | 6.3 | 417 | 6.6 |
| 10/27/11 | 6.3 | 665 | 10.6 |
Source: Skyrm, S. (2013), The Money Noose, Brick Tower Press.
The cash implications for MF Global are summarized in Table 10.8, which shows – across all sovereigns – RTM positions, dollar margin, and percent margin over time. As position size increased to its peak in June 2011, the percent margin rose somewhat from its initial value. From then on, however, as LCH raised haircuts on the weaker sovereigns, the percent margin kept increasing despite MF Global's having reduced positions dramatically. Correspondingly, the dollar margin required for a position of about $6 billion increased from $170 million in early June to $665 million in late October. The table also shows that MF Global would have done well to stay within Roseman's position limit, which was sustainable even if average haircuts increased to 15%.
In the second and third quarters of 2011, problems in addition to the cash drain from rising haircuts caused counterparties and creditors to withdraw support from MF Global. First, regulators and accountants decided that selling repo did not constitute the sale of a bond.14 This change led regulators to increase MF Global's capital requirements significantly and forced MF Global to disclose its RTM positions, which, in the midst of the European sovereign debt crisis, surprised the market unfavorably. Second, MF Global lost $192 million in its core businesses, that is, unrelated to the RTM trades. MF Global was downgraded to below investment grade, and it filed for Chapter 11 at the end of October 2011.
MF Global lost over $400 million in the liquidation of its RTM positions, a huge number relative to the profits given earlier. Particularly provoking is the fact that 50% of the RTM portfolio, and, for example, over 90% of its position in Italian sovereign bonds, matured within two months of the bankruptcy. And, as shown in Figure 10.11, haircuts on Ireland and Portugal sovereign bond repo fell back to 15% by the end of November. In short, had MF Global sized its position to account for the financing risk of increased haircuts, it might have profited rather than have been destroyed by its RTM trades.
NOTES
- 1 To understand the logic of the general bankruptcy stay, consider the case in which a manufacturer of goods has borrowed money on the collateral of machines in its plant. If, in the event of a default, secured creditors could immediately seize those machines, all other creditors and equity holders would likely be irreparably harmed, whereas a limited delay could easily result in an orderly reorganization that maximizes the ongoing or liquidation value of the manufacturer. In contrast, it has been argued that financial markets are best served by the safe harbor, which minimizes the uncertainty of settlement.
- 2 With government bond collateral, it can be argued that this exposure is right‐way risk: government bonds tend to do well during the market upheavals that typically characterize counterparty defaults. On the other hand, with corporate or certain mortgage collateral, it can be argued that repo exposure to default is wrong‐way risk because counterparty defaults tend to happen in exactly those scenarios in which collateral values fall.
- 3 To be even more precise, the cash required for the settlement of trades on a given day is funded that day. For example, in the case of the Treasury market, which settles T+1, a bond purchased from a customer on Monday has to be paid for on Tuesday. Therefore, if that bond were not sold on Monday, the trading desk would need to raise funds on Tuesday morning to pay the customer later that day.
- 4 Market participants say “overnight repo” rather than one‐day repo, because, historically, cash was available to borrowers from the end of one day to the beginning of the next day. However, given reforms since the financial crisis of 2007–2009, these agreements are, in fact, be more accurately described as one‐day repo.
- 5 Tri‐party entries in Table 10.1 are outstanding collateral values; DVP entries are outstanding loan amounts.
- 6 Note that clearing is much stronger than tri‐party guarantees, which ensure that if the repo seller sends collateral and the repo buyer sends cash, then the collateral and cash will be exchanged.
- 7 One advantage of sponsored repo is the reduction of the size of broker–dealer balance sheets. If a broker–dealer sells repo to a money market fund and then buys repo from an asset manager, the broker–dealer incurs a liability and an asset. If the broker–dealer sponsors the fund and asset manager, however, so that they can trade with each other, their trades do not appear on the broker–dealer's balance sheet. The costs and risks of sponsorship, however, may have negative accounting implications.
- 8 The extremely large special spreads in March 2020 actually entail negative special rates. Since May 2009, there has been a penalty for failing to deliver bonds that had been sold at a rate equal to the maximum of zero and the difference between 3% and the fed funds rate. Therefore, traders can be willing to lend cash at negative rates to borrow bonds so as to avoid failing to deliver and so as to avoid the penalty.
- 9 More precisely, the number of days is to the settlement date of the bonds sold at the first reopening, second reopening, or new issue.
- 10 The term wholesale funding refers to funding provided by institutional, professional, and particularly sophisticated investors, in contrast with retail funding, like deposits.
- 11 See, for example, Nelson, B., and Covas, F., (2019), “Bank Regulations and Turmoil in Repo Markets,” Bank Policy Institute, September 26.
- 12 This account draws heavily on Skyrm, S. (2013), The Money Noose, Brick Tower Press; and Freeh, L. (2013), “Report and Investigation of Louis J. Freeh,” United States Bankruptcy Court for the Southern District of New York. The case also appears in the broader context of liquidity risk management in Tuckman, B. (2017), “Survive the Droughts, I Wish You Well: Principles and Cases of Liquidity Risk Management,” Financial Markets, Institutions & Instruments.
- 13 The repo term was actually two days before maturity, a detail not discussed further in the text.
- 14 This change was partly because the repo expired two days before the expiration of the bond, as mentioned in footnote 13.