
Elements of the Fuel Treatment System for Ash-Forming Fuels
Figure 7–32 presents a schematic arrangement of a heavy-duty gas turbine power station system developed after years of experience with ash-forming fuels.
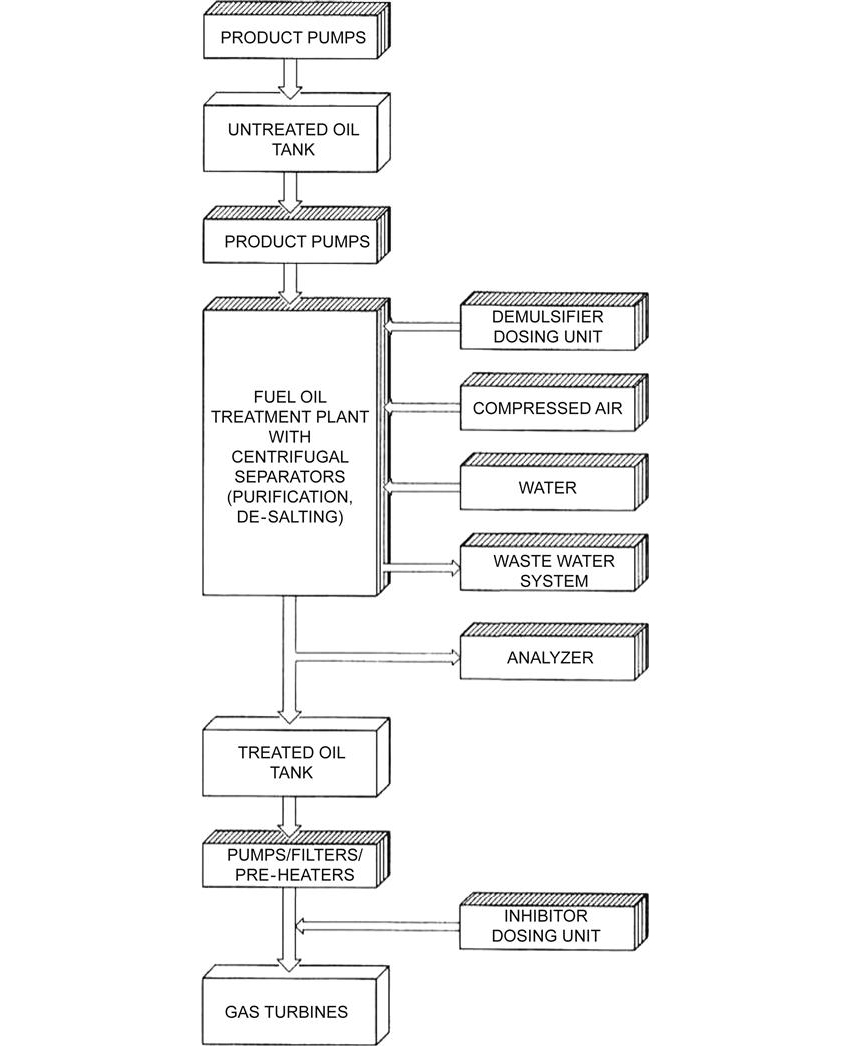
The system is configured to provide simplified plant operation. It has the flexibility to incorporate future improvements.
Methods of Separation
Separation by Electrostatic
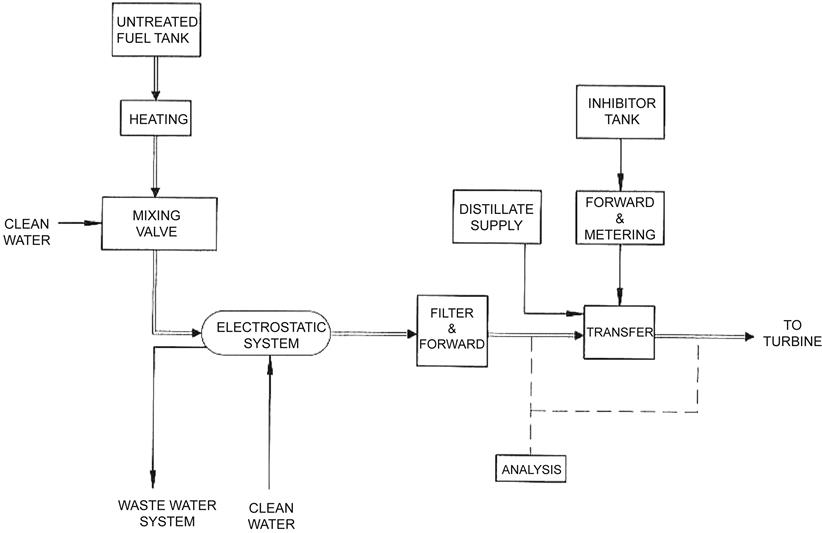
Figure 7–33 gives a schematic arrangement of a typical two-stage electrostatic system.
The principle behind any electrostatic system is that the oil/water separation process is induced through the application of an electric field. The electric field causes finely dispersed water droplets to coalesce, thereby increasing the droplet diameter. This phenomenon increases settling rates according to Stokes’ law, which states that “the velocity of a water droplet falling through oil is proportional to the square of the diameter of the droplet.”
There are two types of electrical separators presently used: direct current and alternating current. Direct-current electrostatic systems are devices employed with light refined fuels of low conductivity. Alternating-current electrostatic separators are applicable for heavier fuels having higher conductivity. Electrostatic separators are appealing because there are no high-speed rotating parts within the vessel.
Sludge removal is accomplished by the transport of solids in the effluent water from the vessel. This can be accelerated by a hydraulic system within the vessel that causes recirculation of the water.
The key parameter in sizing such a system is the selection of the number of stages. Generally, one can expect 85–90% sodium removal per stage. Three-stage systems are usually considered for initial sodium plus potassium inputs up to 100 ppm and two-stage systems are considered for initial sodium plus potassium inputs of up to 50 ppm. Although system startup times using electrostatic precipitators are somewhat long, usually taking three to four hours per stage, the operator is capable of detecting small changes in operating effectiveness of the system and can take corrective action with the system on line.
Electrostatic washing designed to gas turbine company specifications will remove sodium plus potassium concentrations to less than 1 ppm in fuels having specific gravities of 0.96 or less.
For efficient separation the temperature in electrostatic systems must be raised to 149°C (300°F), this requires a pressure vessel to prevent the water from boiling. This in turn can cause reduction of fuel viscosity and furthermore carbonizes the fuel oil.
Separation by Centrifugal Force
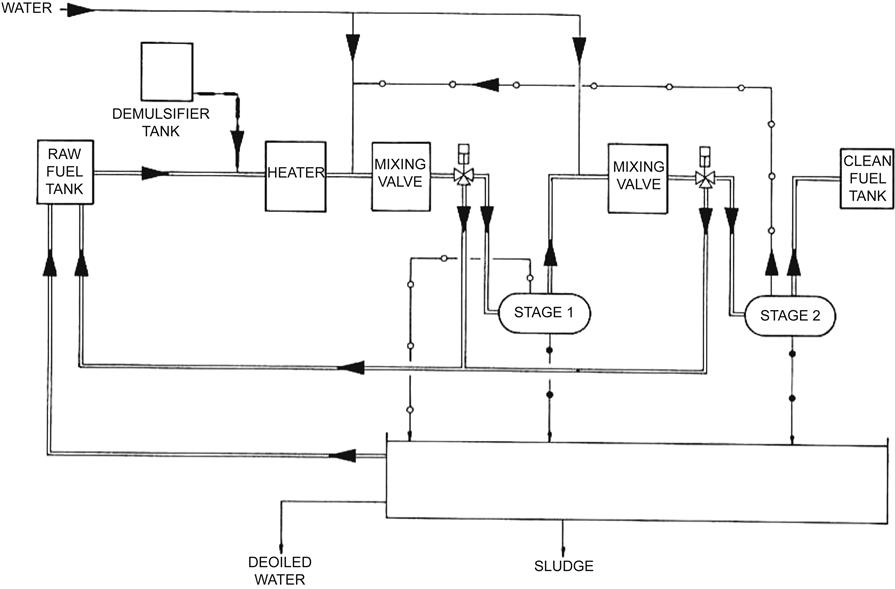
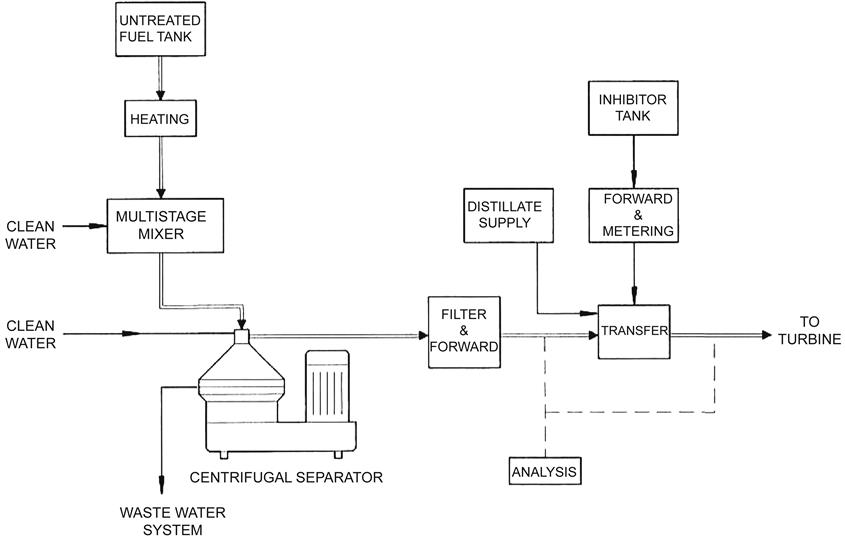
The mechanical separation process of washing fuel is shown schematically in Figure 7–34. This arrangement represents a typical two-stage centrifugal system. The principle behind this centrifugal process is that the oil and water are separated as a result of the centrifugal forces developed in the centrifuge. In contrast to electrostatic precipitators, which rely on increased particle diameters in a high voltage gradient field and an IG gravity field, the centrifuge employs a high gravity field of many thousands of Gs to accomplish the separation without the need of an electrostatic field. A variety of centrifuge models are currently available, having capacity ranges from 1.1–110 m/h.

Centrifugal fuel washing systems have been successfully applied to all gas turbines by various manufacturers using fuels with high density and high viscosity.
With correct system parameters, a typical two-stage centrifugal washing system can reduce sodium plus potassium from 150 ppm to a combined level of 1.0 or 0.5 part per million as specified by the turbine manufacturer.
Centrifuges are also effective in removing inorganic particles and dirt that are forced out with the effluent wash water. This added benefit minimizes the load on the downstream fuel filtration system.
Fuel Purification-Simplified Washing
The purification process is shown schematically in Figure 7–35.
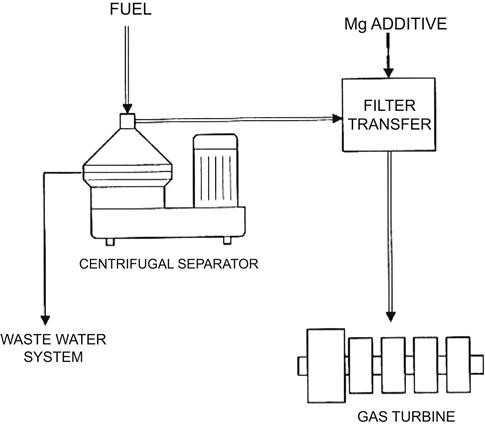
Fuel purification is a one-stage extraction procedure that employs centrifuges to treat distillates and light crude oils without adding water to the fuel. This process relies on the fact that the salts are already dissolved in the entrained water; thus by removing the water the salts are removed as well.
Purification is practical with distillate fuel and light crude oils having a minimum 0.5% water in the fuel, with a salt concentration not exceeding 20 ppm of sodium plus potassium. Since the purification process eliminates the need for added water and demulsifiers, it also simplifies the overall waste disposal process.
Selection of Fuel Washing Equipment
Comparison of Equipment
The selection of whether centrifugal or electrostatic precipitators are used to reduce the soluble trace metals to acceptable limits is usually dictated by the customer or the turbine manufacturer; for example where space is at a premium or in case of marine use, the natural choice is centrifuges. For systems with continuous flows over 100 m3/hr, where space is not a major constraint, where the customer has at least 25 storage tanks with a capacity of 19,000 m3 each, and it can sit in the tanks for a minimum of two weeks, electrostatic desalters are acceptable.
The following gives a brief comparison of the two systems: centrifugal desalting system versus electrostatic desalting system. First, let us have a look into the technical part: mixing.
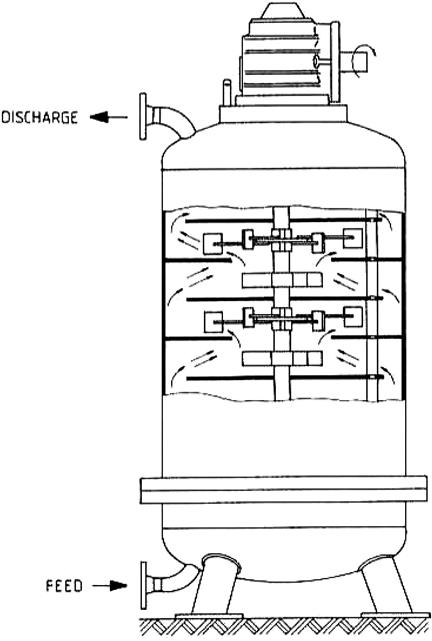
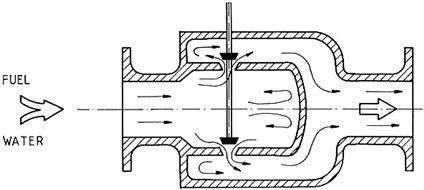
As was already pointed out, the centrifugal desalting system is using a multi-stage mixer, Figure 7–36, with multi-stages; the mixer is a low shear mixer. It is a similar process to hand mixing dough when making bread at home, a slow and gentle mix in comparison with the electrostatic desalting system that uses a high shear mixing valve (Figure 7–37), causing a very violent mixing method.
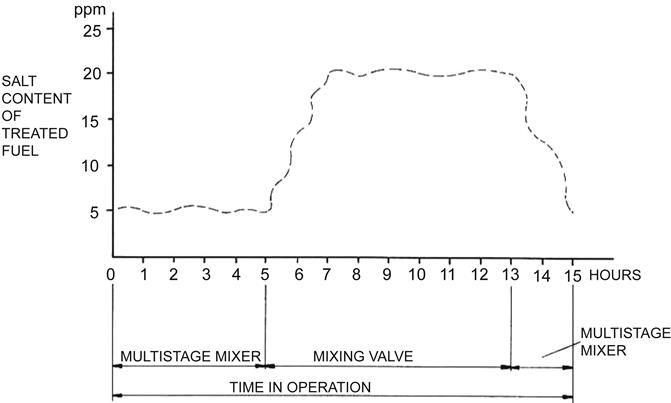
An electrostatic desalting system company in east Texas tested the two mixing methods (Figure 7–38) and concluded that if a multi-stage mixer is used in the electrostatic desalting system the salt in the finished oil is about 5 ppm. After five hours they switched to the mixing valve and the salt content in the finished oil increased within two hours to 20 ppm. And, when after six hours the system was switched back to the multi-stage mixer it dropped back to 5 ppm within two hours. The electrostatic desalting system company published this study and their conclusion was that they should supply multi-stage mixer with their electrostatic desalting systems and also supply additional filtration.
In addition to Figure 7–38, Table 7–14 gives a comparison of 12 items within the electrostatic and centrifugal fuel treatment systems.
TABLE 7–14
Comparison of Centrifuge/Electrostatic Features
| Parameter | Electrostatic | Centrifuge |
| Time to reach startup stability | 4 hours (per stage); 12 hours total | 20 minutes total |
| Reliability | Good | Good |
| Maintenance | Low | Low |
| Desludging | By water effluent but can accumulate in vessels | By water effluent and by automatic bowl opening |
| Approximately once a year vessels needs to be cleaned | ||
| Performance in sodium + potassium removal | Meets spec. if fuel is within system design spec. | Exceeds spec. even if raw fuel does not completely meets design spec. |
| Oil content in water effluent | 500–2000 ppm typical, 50,000 ppm max | 50 ppm typical, 500 ppm max |
| Switch positions | ||
| Response time to correct fuel out of spec. washed fuel | 12 to 24 hours | 20 to 40 minutes |
| Solid removal | Fair additional filtration needed | Excellent |
| Amount of heating required for fuel treatment | 127–137°C (260–278°F) | 98°C (208°F) |
| Fuel required to change system (cannot be used) | Approximately 1000–2000 m3 | 1–2 m3 |
| Flexibility—servicing while operating | System cannot be partially shut down | Centrifuges can be removed from service while continuing to operate |
| Space required | Large area | Limited area |
(Source: Westfalia.)
System Considerations
There is no one, basic, fuel-treatment system suitable for all applications, but a design can be tailored to the specific needs and requirements of each customer. The optimum approach results from an evaluation of operational requirements for the gas turbine, the expected fuel characteristics, the desired maintenance philosophy, the choice of equipment, the choice of additive, and the desired system flexibility. Generally, there is a tendency to request “worst case” design without giving due thought to the many constraints that may exist, which may result in an over-designed and expensive installation.
Fuel-Washing Equipment Design
Once the choice of a centrifuge or electrostatic desalter is made (see Figures 7–39 and 7–40), a support-equipment design approach must be selected commensurate with the system objectives. This equipment, which includes mixers, demulsifier injection pumps, heat exchangers, economizers, etc., dictates the actual performance of the system, the resulting maintenance philosophy, and the actual equipment cost. For example, units that are periodically shut down, such as peaking mid-range gas turbines, can have maintenance performed on a planned downtime basis. Continuously running systems require on-line redundancy of critical components such as heat exchangers and economizers. This permits scheduled cleaning without incurring downtime. Further, since the equipment can be maintained while operating, the fuel-washing size can be kept smaller, reducing initial costs. Likewise, redundancy of control air, critical pumps, and motors is recommended.
Fuel Oil Treatment
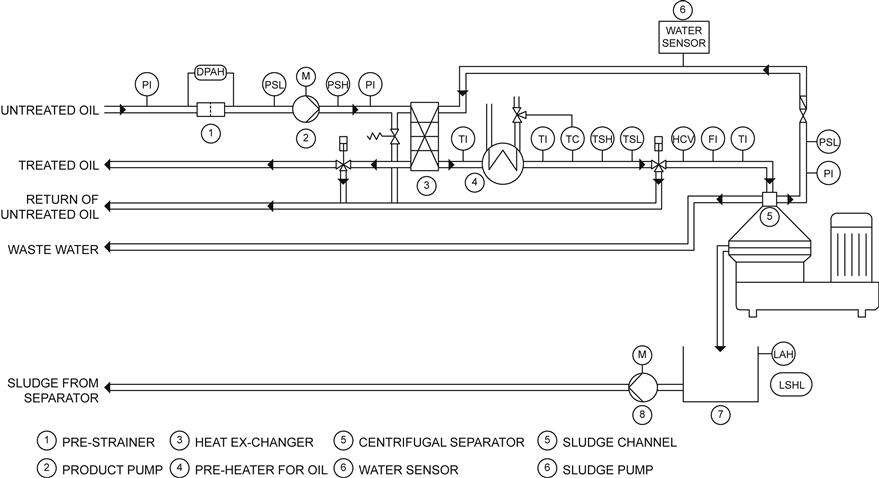
With two-stage counter-current washing systems (see Figure 7–41) the degree of purity specified by the gas turbine manufacturers is attained, and the trace elements are reduced to the specified limits.
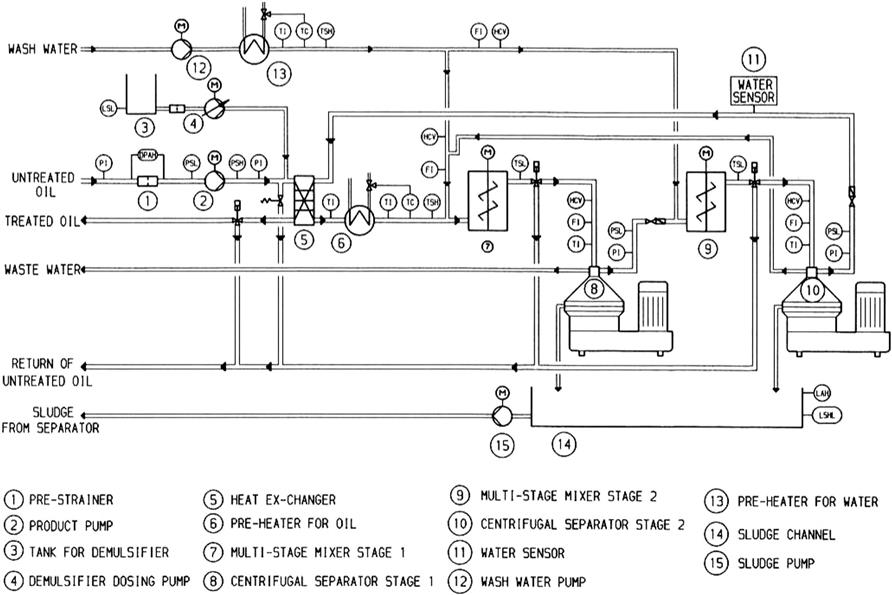
The residual oil is first fed to a prestrainer where coarse impurities are separated out to protect the downstream pump.
After adding demulsifier to facilitate separation of the wash water in the purifier, the oil is conveyed to a heat exchanger, where heat recovery takes place. The residual oil is heated to the required separation temperatures in the downstream preheater. The separation temperature is determined by the viscosity.
The wash water separated from the oil in the second stage is added to the oil upstream of the first stage mixer. The residual oil is thoroughly mixed with the water in a multistage mixer. Salts in solution with the oil will be extracted into the water. The oil/water mixture flows to the purifier in the first washing stage. The solids are spun out due to the high centrifugal force; the dissolved salts, together with the wash water, are simultaneously separated out.
The salt content in the oil is substantially reduced and contaminants such as sand, rust, and cat fines are removed from the oil. Water is again added to the purified oil upstream of the second stage mixer. After intensive mixing, the oil/water mixture is sent to the purifier in the second washing stage, where further purification and desalting takes place.
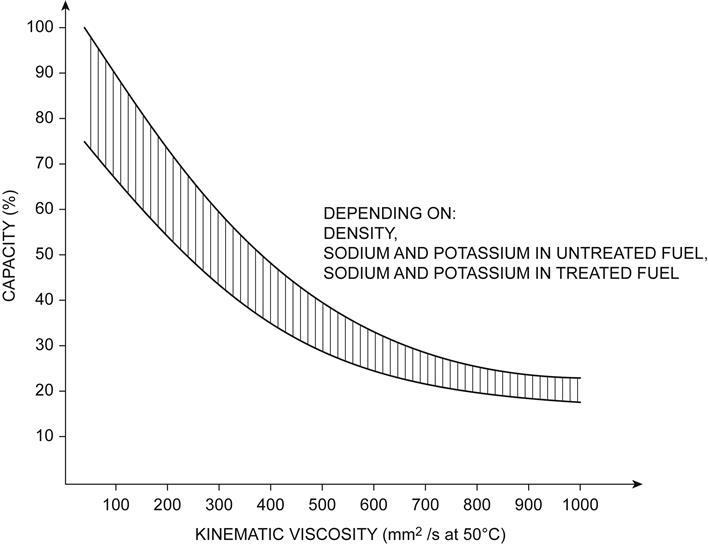
The required wash water volume depends on:
• The quality of the residual oil
• The sodium and potassium content in the dirty oil (ppm)
• The specified sodium and potassium content in the clean oil (ppm)
The clean oil discharges from the separator in the second washing stage into the clean oil tank via a heat exchanger.
If required, analyzers can be fitted in the clean oil discharge. They are used for continuous monitoring of the water and salt content. If the specified limits are exceeded, the oil is fed back into the dirty oil tank via a three-way valve. As part of a research project, optimum purification efficiency was attained using treatment systems from Westfalia Separator, even when processing high-viscosity oils (1650 mm2/sec at 50°C).
When designing a system the following residual oil parameters are decisive for the capacity (see Figure 7–41):
Filtration
Solids, oxides, silicates, and related compounds that are not adequately removed by the fuel washing systems must be removed by the low- and high-pressure filters prior to entering the fuel system’s flow divider. The particles that are not removed may clog the flow divider and fuel nozzles.
Incorporating a motor-driven, self-cleaning filter minimizes the load on the downstream high-efficiency filters. The use of a duplex filtration system permits filter maintenance without turbine shutdown.
Inhibition
Crude oils and heavy residual fuels usually contain organic vanadium, which is extremely corrosive to the hot gas path parts of the turbine. The vanadium is not present in liquid fuels in a water-soluble form; hence it cannot be removed through the washing process. Instead, its effects are inhibited by the addition of magnesium to the fuel in the ratio of three parts of magnesium by weight to each part vanadium. At this level of inhibition, the corrosive vanadium pentoxide that is formed during combustion reacts to form magnesium orthovanadate. This has a melting point sufficiently high to allow its passage downstream through the turbine without deposition on the hot gas path parts and resultant corrosion.
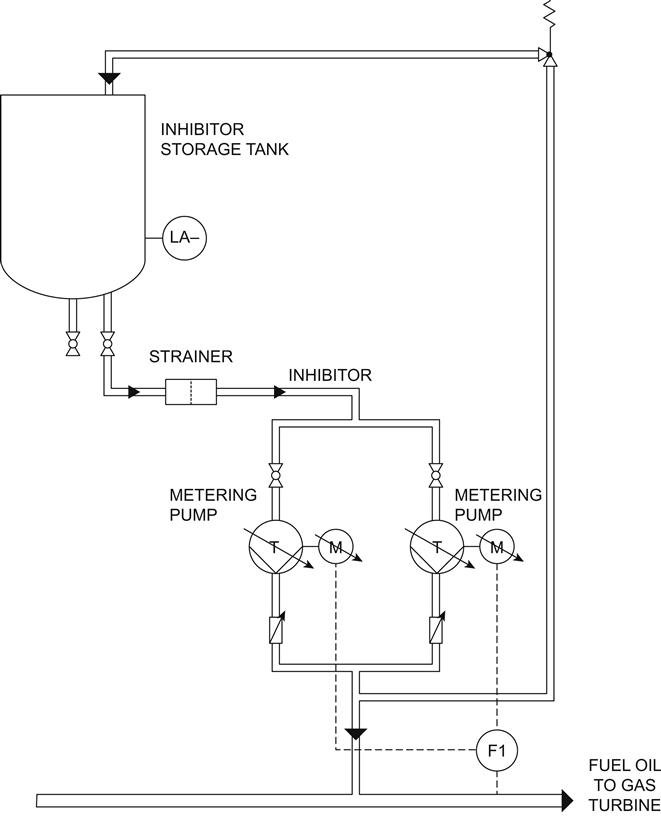
A variety of magnesium-containing inhibition agents are available, and their choice is determined largely by the economics of the system and the overall amount of vanadium present in the fuel. Three additives frequently employed are magnesium sulfonate, which is oil soluble and delivered ready for use, magnesium oxide, which is an oil-based slurry, and magnesium sulfate, commonly known as epsom salts, which must be mixed with water on the site. On-line inhibition systems are the preferred method of applying the magnesium agent. The inhibitor is injected into the fuel immediately ahead of its introduction to the gas turbine (Figure 7–42). The system consists of a small in-line metering pump and a flow switch that provides an alarm signal in the event flow of inhibition stops. Either constant flow systems or systems that provide a flow varying with the actual fuel use rate are available. Certification tanks have been employed in some installations. In this approach, batches of the magnesium inhibition agent are mixed directly with the fuel. Use of this system is not currently recommended, since there is a strong possibility that the additive will settle out.
Both oil soluble (magnesium sulfonate) and water-soluble inhibitors (magnesium sulfate) are used with an equal degree of success. The mixing ratio is three parts magnesium to one part vanadium and should not exceed 3.5:1.
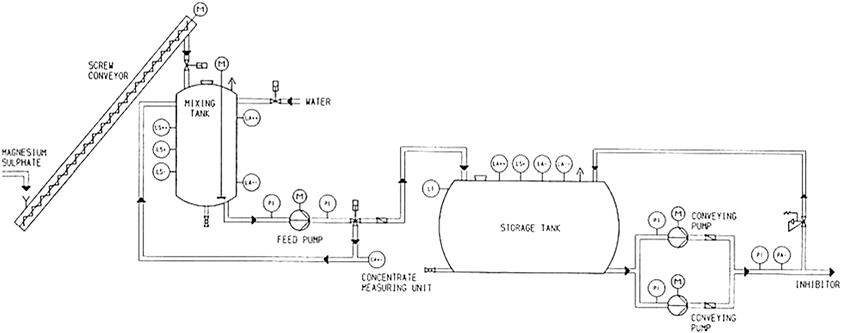
For reasons of economy, the oil soluble inhibitor is primarily used for low vanadium concentrations (up to 20 ppm) and the water-soluble inhibitor for high vanadium concentrations (above 20 ppm). Figure 7–43 shows a water-soluble inhibitor.
Dosing Unit for Inhibitors
In the dosing units from Westfalia Separator, dosing and conveyance of the inhibitor is by means of pumps. The pump output must be variable. This is possible by
It is frequently the case that combinations of the different control systems are required. The pump can be adjusted as follows:
Mixing Unit for Water-Soluble Inhibitor
A screw conveyor transports a certain amount of magnesium sulfate (MgSO + 7 H2O) into the mixing tank. Prior to adding magnesium sulfate, the tank is filled to a preset level with demineralized water. An agitator ensures uniform distribution.
A conductivity meter in the circulation line monitors the concentration. Once the required concentration is reached, the solution is pumped into the storage tank. The entire process is automatically controlled and monitored.
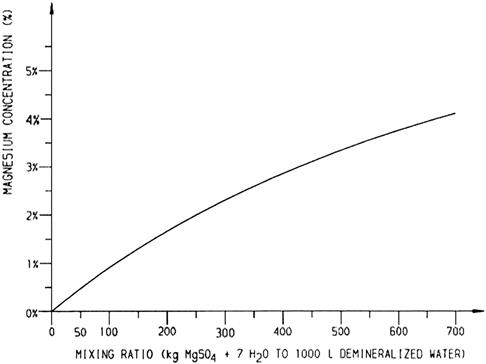
Figure 7–44 shows the mixing ratio as a function of the magnesium concentration.
Fuel Selection
Residual fuels cover a wide range of properties including vanadium content, specific gravity, and viscosity. Depending largely on economic trade-offs, the user may or may not decide to burn all of the fuels available at this location. The maximum allowable vanadium content may be controlled by local regulations governing total stack particulate emissions. Lower vanadium level fuels, where available, can substantially reduce fuel treatment additive costs.
Users requiring a capability for washing fuels with a specific gravity and/or viscosity higher than specified for the fuel-washing system can accommodate these fuels by blending them with a compatible distillate fuel before washing.
Fuel Handling and Storage
Heavy fuels do not, generally, have consistent chemical and physical properties; purchased supplies can vary widely in their composition. Observation of the following precautions for storage and handling of fuel prior to use can enhance fuel washing and assure greater consistency in the fuel delivered to the gas turbine:
1. The use of three tanks sized to provide a 24-hour settling time will permit one tank to be in use while the second tank is being filled and the third is settling after being filled.
2. Tanks should be covered and provided for easy drainage of water and sediment from the bottom, which should be done on a daily basis.
3. Fuel should not be pumped directly from the bottom of the tank.
4. All fuel delivered should be filtered to remove any large particles, and piping should be arranged to minimize agitation of sediment at the bottom of the tank.
5. Storage tanks for high viscosity fuels such as residuals should be heated to keep the viscosity low enough so that the fuel can be pumped.
6. Oil storage temperature should be as low as possible consistent with the operation. Washed oil must be delivered to the day tank below the flash point.
7. Cadmium, zinc, and copper catalyze the decomposition of hydrocarbons. These elements and their alloys, therefore, should not be used in the construction of storage tanks and related items.
Fuel-Wash Capacity
The fuel-use profile is significant in establishing the size of the fuel-washing equipment and treated fuel storage tank.
Fuel demand is a function of the site ambient temperature and number of hours of use by each turbine, which determines the required fuel treatment capacity to support the site operation. Final sizing depends on the margin desired by the customer and the maintenance philosophy adopted to keep the washing equipment on line.
Fuel Analysis and System Controls
A modern, heavy-fuel gas turbine installation requires controls for the fuel treatment equipment as part of total system control. Actual philosophy is dictated by customer preference. Generally, each functional component is equipped with its own control system and has manual set points. Once the set points are preselected, the system can be initiated on-site (or at a remote area) after which the entire process is self-regulating. Monitoring of critical functions can be incorporated if desired.
Fail-safe and permissive features are provided as part of the control system. When a malfunction occurs in the fuel wash equipment, the fuel is automatically diverted to the raw fuel storage tank, rather than to the day tank, until the malfunction is cleared.
Additionally, the fuel quality must be monitored at various steps of the process: sodium and vanadium level after washing and total sodium and magnesium after inhibition.
For light fuels not requiring inhibition (vanadium less than 0.5 ppm) only the sodium level is monitored. This is most readily accomplished with a flame photometer, which is available as a manual instrument for spot checks.
Fuels requiring both washing and vanadium inhibition by a magnesium additive should be monitored with a direct-reading, automatic, emission spectrophotometer (shown in Figure 7–45). While this is a complex instrument, its operation is very simple and amenable to use by on-site labor. The operator collects samples, inserts them one-at-a-time in the excitation chamber, presses a button, and one minute later reads the analysis printed by a typewriter. About once every two weeks the instrument calibration is checked.
Treatment of Light Crude Oil
Operation on Refinery Crude
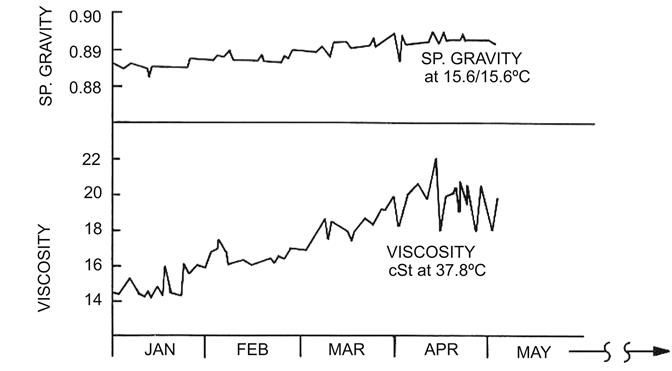
Light crude oil with a typical analysis shown in Table 7–15 is delivered by a pipeline to a power station located in central Saudi Arabia to operate six gas turbines. Sodium plus potassium level in “as-received” fuel runs from 15 to 4 ppm, only rarely does it come close to the value shown in Table 7–16 (21 ppm). Operation of this 54 m3/h fuel purification system (Figure 7–46) began at the end of 1981.
TABLE 7–15
| First Source (Refinery) | Second Source (Oil Field) | ||||
| Unit | Max. | Min. | Max. | Min. | |
| Gravity | |||||
| at 15.6°C | API | 34 | 39 | 31 | 33.5 |
| at 15.6/15.6°C | Sp. gr. | 0.855 | 0.830 | 0.871 | 0.858 |
| Viscosity | |||||
| at 37.8°C | cSt | 11.0 | 5.5 | 10.0 | 6.0 |
| at 50.0°C | cSt | 8.5 | 4.0 | 6.5 | 4.5 |
| Water content | Vol. % | 1.0 | 0.01 | 1.0 | 0.1 |
| BS&W | Vol. % | 0.7 | 0.01 | 1.5 | 0.2 |
| Flash point | °C | –6.7 | –6.7 | –6.7 | –6.7 |
| Pour point | °C | — | –30.0 | –6.7 | –17.8 |
| Sulfur | Wt. % | 1.2 | 1.0 | 3.5 | 3.3 |
| H2S | ppm | 150 | 33 | 145 | 35 |
| Wax | Wt. % | 5 | 2 | 30 | 14 |
| Ash | Wt. % | 0.1 | 0.01 | 0.128 | 0.001 |
| Sodium (Na) | ppm | 20 | 1.5 | 50 | 5 |
| Potassium (K) | ppm | 1 | 0.1 | 3 | 0.4 |
| Vanadium (V) | ppm | 15 | 6 | 8 | 4 |
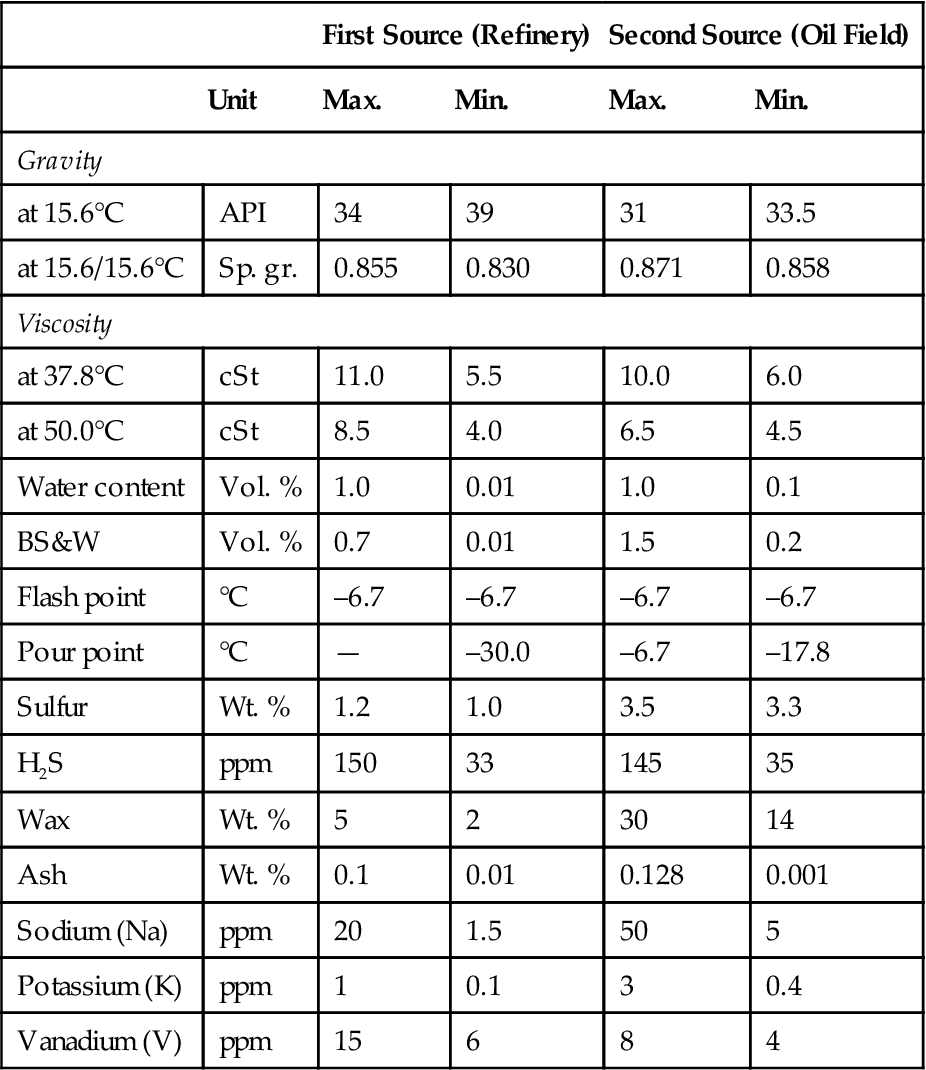
(Source: Westfalia.)
TABLE 7–16
Data from Centrifugal Lab Test on Oilfield Crude without Water Washing
| Ref. No. | Sample Point | Viscosity at 50°C cSt | Sp. Gravity at 15.6/15.6°C | Water Vol. % | Test Temp. °C | Trace Metal Tent (ppm) | ||||||||||
| Na | K | Ca | V | Pb | Mg | Fe | Ni | Cu | Sn | Remarks | ||||||
| 15/1 | Feed | 10.8 | 0.865 | 1.30 | 70 | 4 | 1.4 | 0.8 | 3 | 0.2 | 12 | 3.8 | 5 | 1.0 | 0 | |
| Discharge | >0.005 | 0.2 | 0.0 | 0.2 | 3 | 0 | 1 | 1.4 | 5 | 0.6 | 0 | |||||
| 15/2 | Feed | 9.5 | 0.875 | 1.40 | 60 | 4.5 | 1.7 | 2.1 | 4.2 | 0.8 | 0.6 | 12.5 | 7 | 0.4 | 0 | |
| Discharge | >0.005 | 0.6 | 0.1 | 0.5 | 4.7 | 0.7 | 0.1 | 4.6 | 6 | 0.0 | 0 | |||||
| 11/1∗ | Feed | 9.8 | 0.865 | 6.00 | 52 | 104 | 34 | 32 | 6 | 0.8 | 21 | 62 | 11 | 0.8 | 6 | Sample from tank bottom |
| Discharge | >0.005 | 7 | 0.4 | 3 | 4 | 0 | 3 | 14 | 10 | 0.7 | 2 | |||||
| 11/1 | Feed | 9.8 | 0.865 | 6.00 | 52 | 104 | 0.4 | 3 | 4 | 0 | 3 | 14 | 10 | 0.7 | 2 | 1% water added to above sample |
| Discharge | >0.005 | <1.0 | <0.4 | 1 | 4 | 0 | <1.0 | <10 | 10 | <0.7 | <2 | |||||
| 12/1∗ | Feed | 10.5 | 0.873 | 14.00 | 77 | 143 | 36 | 31 | 7 | 1.0 | 11 | 54 | 9 | 0.4 | 2 | Sample from tank bottom |
| Discharge | >0.005 | 9 | 0.8 | 2 | 7 | 0.2 | 0 | 14 | 7 | 0.2 | 1 | |||||
| 12/1 | Feed | 10.5 | 0.873 | 14.00 | 77 | 143 | 26 | 31 | 7 | 1.0 | 11 | 54 | 9 | 0.4 | 2 | 1% water added to above sample |
| Discharge | >0.005 | <1.0 | <0.8 | <1.0 | 7 | 0.2 | 0 | <5 | 7 | 0.2 | <1 | |||||
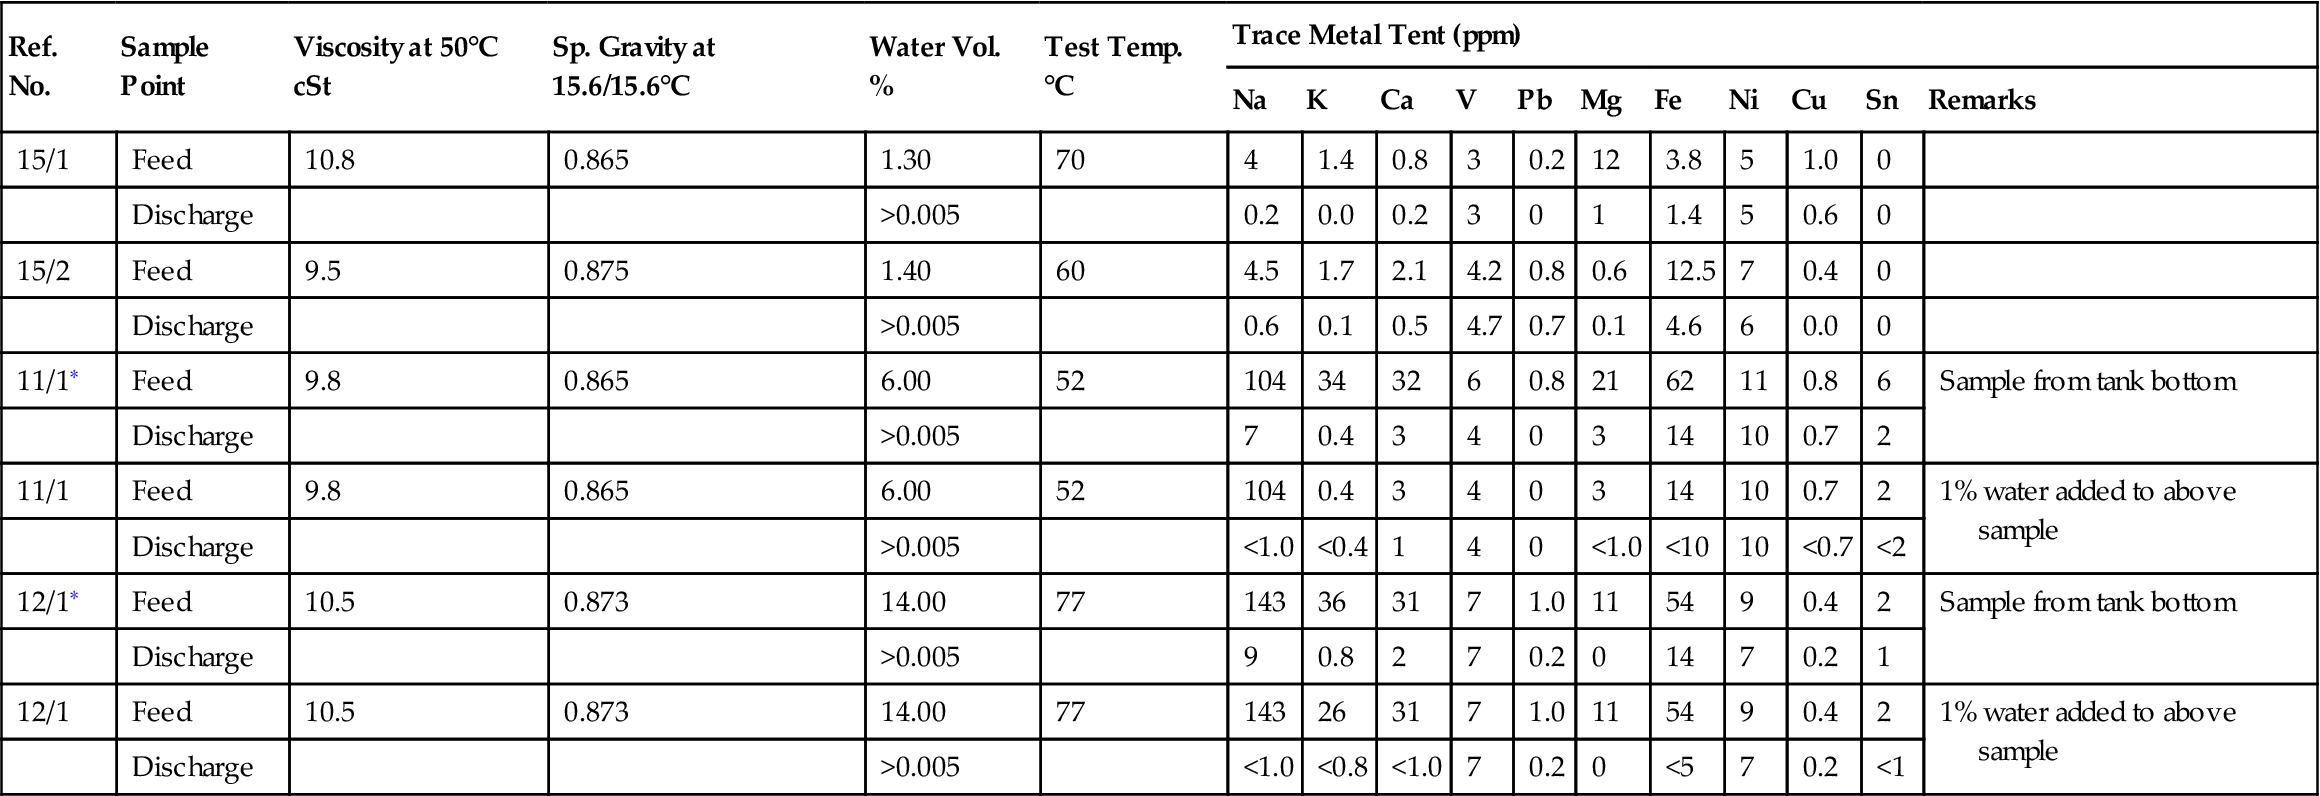
∗= Two stage purification, no water added to the fuel.
(Source: Westfalia.)
The centrifuges used at this location are of the automatic desludging type. Water and solids accumulating at the bowl perimeter are discharged at intervals of about four hours. A batch analyzer provides a spectrographic flame analysis of the trace metal in the purified fuel. Since this was the first purification system, it was equipped with the ability to add small amounts of water to the fuel if it was found to be necessary. This system was also equipped with demulsifier injection capability to prevent emulsions.
During initial startup the water injection system was inadvertently activated, giving rise to erroneous indications that the light crude oil was being washed rather than purified. The interesting fact is that there was an improved performance of the system when the water injection was terminated. Water quality there is quite good; it is received from a local water desalination plant.
Purification tests have shown very easy formation of stable emulsions which can be troublesome due to their sedimentation at the oil/water interface and which cause a deleterious effect on centrifugal purification. The small amount of water used in the system (about 0.075 m3/h) is utilized in the operation of the centrifuge bowl.
Operational difficulties have been observed as fuel temperature dropped below 54°C, which appears to be the approximate “wax point” or the temperature at which waxes begin to precipitate from solution. Waxes are interfacial in nature, and on several occasions have completely filled the centrifuge bowl with this semi-solid. This in turn negates the separation effect of the microscopic water droplets containing must of the trace metals so damaging to the hot-gas-path components. Since crude oil temperature has to be maintained above the wax point prior to the purification system, the crude pour point (wax separation point) is therefore one of the most important criteria of system design.
It is interesting to know that none of the problems that sometimes plague the high firing temperature gas turbines have occurred: failure of flow dividers, fuel nozzle plungers, high-pressure pumps, fuel nozzle coking, etc., due to crude purification and turbine operation cycle. The first turbine water wash was after 3000 hours of turbine operation.
The simultaneous elimination of water and demulsifier injection had increased filter life.
Filter life is influenced by many factors: moisture, asphaltic sludge, inorganic particulates, bacteria (algae), wax out of solution, as well as chemical additives (demulsifier and vanadium inhibitor).
Increase in filter life was at first thought to be coincidence, and little investigation was given to their interrelation. The later lab studies on the oil field crude demonstrated conclusively that one oil-soluble magnesium inhibitor can have a major effect on filter life in the presence of only trace amounts of moisture. And that these chemicals also can cause fuel nozzle coking is proven by the extremely high magnesium content of the deposits.
Operation on Oil Field Crude
During 1981 and 1982 centrifugal lab investigations were conducted on an oil field crude shown in Table 7–15. Experience dictates any such investigation should be conducted on-site as exportation of drum quantities of light crude to a remote laboratory has proven to be a futile effort because of numerous factors. Exporting large samples has resulted in highly questionable results.
Test runs on oil field crude were made on a quantity of oil taken only hours prior to testing. Tests were run on the light crude from many points in its processing train, and a great deal of data were obtained concerning desalting as well as separation rates under various processing conditions. Figure 7–47 shows the actual physical nature of the oil field crude.
The variations are considerably higher than those seen in the refinery crude oil. During the peak periods of January to May 1981, washed crude from an electrostatic system was observed with 4.5 ppm of sodium plus potassium in the day tank. Passage through the test centrifuge gave a further reduction of sodium plus potassium to very acceptable levels as plotted in Figure 7–48. Note: Field experience showed a higher centrifuge efficiency.
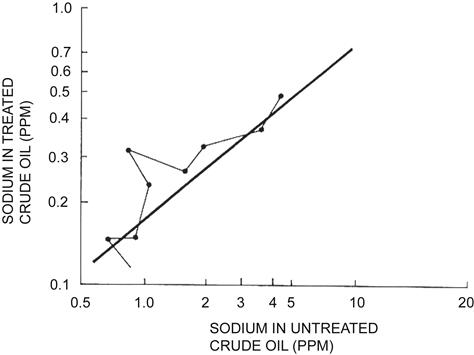
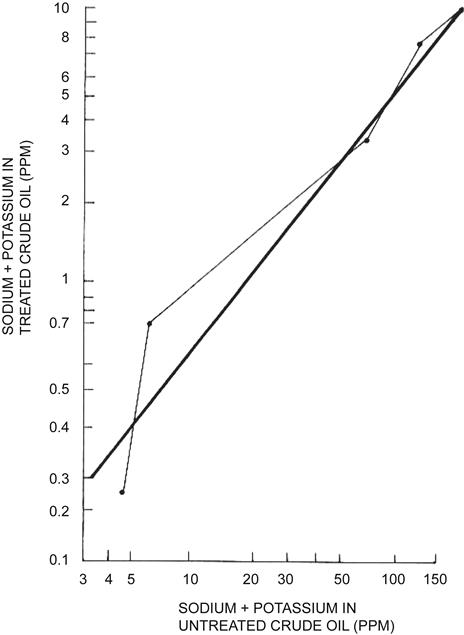
Table 7–16 and Figure 7–49 show the extent to which sodium and potassium can be reduced in a centrifugal purification process on the oil field crude. Reduction of other trace metals is also given. Note: Field experience showed a higher centrifuge efficiency.
The above test also provided some answers to questions of current interest to gas turbine operators contemplating burning light crude oil. The conclusions reached and data presented are considered valid for the stations where studies have been made on refinery and oil field crude. Other crudes are under investigation, it is expected that most crudes are purifiable if their physical properties are similar.
Comparison of Centrifuge and Site Data
During 1981 a direct feed crude oil purification system was installed at the Gizan power station in order to purify crude oil for GE’s Fram 6 gas turbines. The system operated very successfully. At a later date the customer switched over to contaminated distillate and utilized the same purification system without any modifications. Westfalia Separator’s purification system can operate on crude oil or distillate fuel and obtain identical results.
Westfalia’s system reduced the sodium plus potassium level from an average of 2.92 ppm down to an average of 0.015 ppm (site data dated Sept. 26, 1989).
At a later date (1987) an additional system was installed (not Westfalia) for GE’s Fram 7. This system could not supply purified fuel directly to the gas turbine (it has been modified at present time) and its sodium plus potassium reduction is only 88%.
If we look into the purification system efficiency from the filter plugging data point of view, it can be noted (from site date) that the turbines that are being supplied with fuel that was purified in the Westfalia system have a filter life span of 1078–4103 hours on the low-pressure and high-pressure filters whereas the turbines that are being supplied with fuel that was purified by the other purification system have a filter life span of 95–1009 hours on the low-pressure filters and between 1578–1716 hours on the high-pressure filters.
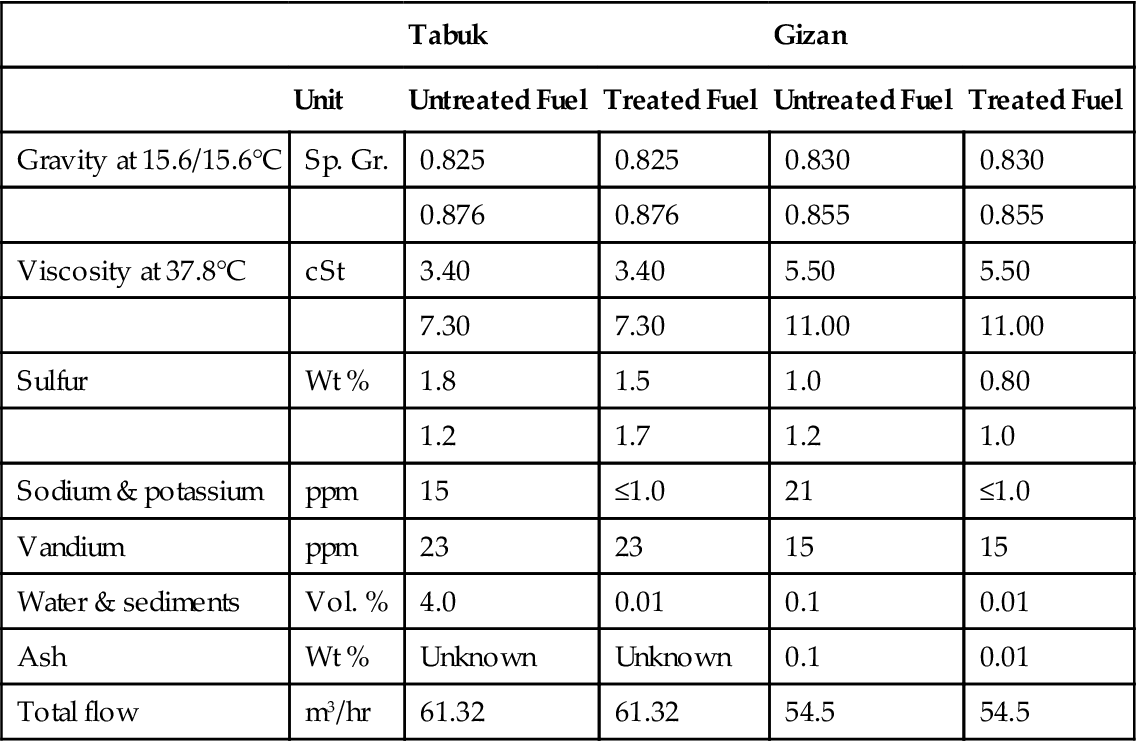
From the above comparison of the two purification systems (summarized in Table 7–17) it is clearly noted that the Westfalia purification system performed as designed.
TABLE 7–17
Field Experience with Crude Oil
| Tabuk | Gizan | ||||
| Unit | Untreated Fuel | Treated Fuel | Untreated Fuel | Treated Fuel | |
| Gravity at 15.6/15.6°C | Sp. Gr. | 0.825 | 0.825 | 0.830 | 0.830 |
| 0.876 | 0.876 | 0.855 | 0.855 | ||
| Viscosity at 37.8°C | cSt | 3.40 | 3.40 | 5.50 | 5.50 |
| 7.30 | 7.30 | 11.00 | 11.00 | ||
| Sulfur | Wt % | 1.8 | 1.5 | 1.0 | 0.80 |
| 1.2 | 1.7 | 1.2 | 1.0 | ||
| Sodium & potassium | ppm | 15 | ≤1.0 | 21 | ≤1.0 |
| Vandium | ppm | 23 | 23 | 15 | 15 |
| Water & sediments | Vol. % | 4.0 | 0.01 | 0.1 | 0.01 |
| Ash | Wt % | Unknown | Unknown | 0.1 | 0.01 |
| Total flow | m3/hr | 61.32 | 61.32 | 54.5 | 54.5 |
(Source: Westfalia.)
In summary, the data from centrifuge lab studies as well as from operations at various power stations, confirmed the viability of the process. A level of approximately 20 ppm of sodium plus potassium can be reduced to <0.5 ppm while operating at commercially acceptable flow rates for the standard centrifuges models available.
It has been found that purification operations on crude oil should be at 55–60°C to ensure that wax separation does not influence the operation. This appears to be true regardless of wax concentration, as proven by test runs on tank bottoms containing extremely high wax content (about 40% by volume).
Centrifugal purification of light crude oil can extend filter life on 5–10 μm paper cartridge filters to 1000 hours, as have been shown by both commercial and pilot plant operation. The operator must, however, be very careful in selection of additives to be used, as well as their injection point, as discussed previously.
Operating water on a typical light crude system of 54 m3/h has a total consumption of about 0.075 m3/h. This water is needed for the bowl hydraulic. For the same size plant (54 m3/h), a washing operation having a moderate 2% by volume water would consume about 1.0 m3/h of water.
Extremely high saltwater contamination level can be tolerated in fuel as received providing proper storage facilities are available and are rigorously maintained. Tests show sodium plus potassium level exceeding 1000 ppm can be reduced in 24 hours of quiet storage to about 40 ppm. Floating suctions and a floating pan with a fixed roof are also highly recommended to maintain clean fuel.
Special caution should be taken when planning for the successful desalting of certain crude oils by the centrifugal purification process without the addition of water to the fuel. The success or failure of this process is highly dependent upon both the design and configuration of the centrifuge and the processing systems.
Treatment of Residual Fuel
Tung Hsiao Power Plant (OEM: Alstom)
An OEM, such as Alstom for a model such as their IIN, might ask for a fuel treatment system that can handle 158.4 m3/h (44 1/sec.) of residual fuel with a specific gravity of up to 0.986 at 16°C and a viscosity of up to 440 cSt at 50°C. Incoming fuel will have a sodium plus potassium level of 50 ppm and must be reduced to ≤0.5 ppm.
During the acceptance test the sodium plus potassium was reduced from 30 ppm to 0.08–0.10 ppm. It should be noted that this is the first (by any company) to achieve a Na + K reduction to 0.08–0.10 ppm. This fuel treatment system is the largest operating system in the world with the largest centrifuge in the world.
The fuel washing system consists of:
Fuel Forwarding
Two 100% flow (158.4 m3/h) speed controlled pumps are moving the 440 cSt at 50°C fuel from the raw fuel storage via a duplex strainer to the centrifuge section. Fuel pump speed had to vary from 1800 ppm to 360 ppm in order to support one or more fuel treatment lines (operation of a line is controlled by fuel demand number of turbine in operation).
Downstream of the pump a demulsifier is introduced to the fuel—200 ppm of Betz Petromeen EB-911—it should be noted that the demulsifier injection pump as well as the fuel forwarding pump, have a variable speed drive to compensate for the quantity of demulsifier required as a ratio to fuel flow.
After that the fuel flow powered five independent two-stage washing systems. Each system includes a steam heater, two multi-stage mixers and two SA-160/220 centrifuges. This arrangement permits the customer to save on power and chemicals.
When testing this system, each fuel washing line reduced the sodium plus potassium from a nominal average of 50 ppm to ≤0.5 ppm (see Table 7–18).
TABLE 7–18
| Sodium and Potassium (ppm) | |||||||||||
| Flow | Temperature | Out | |||||||||
| Date M3/hr | Fuel M3/hr | Water °C | Fuel °C | Water | Demulsifier ppm | In | Linei | Line 2 | Line 3 | Line 4 | Line 5 |
| 09.04.91 | 95.0 | 4.2 | 99 | 94 | 300 | 20 | 0.14 | — | 0.30 | 0.20 | — |
| 10.04.91 | 126.7 | 5.6 | 99 | 94 | 300 | 20 | 0.18 | — | 0.19 | 0.12 | 0.39 |
| 19.04.91 | 126.7 | 5.6 | 99 | 94 | 300 | 10 | 0.09 | — | 0.14 | 0.12 | 0.09 |
| 30.04.91 | 126.7 | 9.6 | 99 | 94 | 300 | 10 | 0.09 | — | 0.09 | 0.09 | 0.09 |
| 09.05.91 | 158.4 | 7.0 | 99 | 94 | 300 | 10 | 0.09 | 0.08 | 0.09 | 0.08 | 0.09 |
| 10.05.91 | 126.7 | 5.6 | 99 | 94 | 300 | 10 | 0.08 | 0.09 | 0.09 | 0.09 | — |
| 20,09.91 | 158.4 | 7.0 | 99 | 94 | 300 | 10 | 0.08 | 0.09 | 0.09 | 0.09 | 0.09 |
| 30.05.91 | 158.4 | 7.0 | 99 | 94 | 300 | 10 | 0.08 | 0.09 | 0.09 | 0.09 | 0.09 |
| 09.06.91 | 158.4 | 7.0 | 99 | 94 | 300 | 7.8 | 0.09 | 0.09 | 0.09 | 0.09 | 0.09 |
| 10.06.91 | 158.4 | 7.0 | 99 | 94 | 300 | 6.5 | 0.09 | 0.11 | 0.09 | 0.09 | 0.09 |
| 19.06.91 | 158.4 | 7.0 | 99 | 94 | 300 | 8.8 | 0.20 | 0.13 | 0.10 | 0.11 | 0.10 |
| 29.06.91 | 126.7 | 5.6 | 99 | 94 | 300 | 20 | 0.19 | 0.28 | — | 0.30 | 0.32 |
| 08.07.91∗ | 158.4 | 10.0 | 99 | 94 | 200 | 30 | 0.08 | 0.10 | 0.09 | 0.09 | 0.08 |
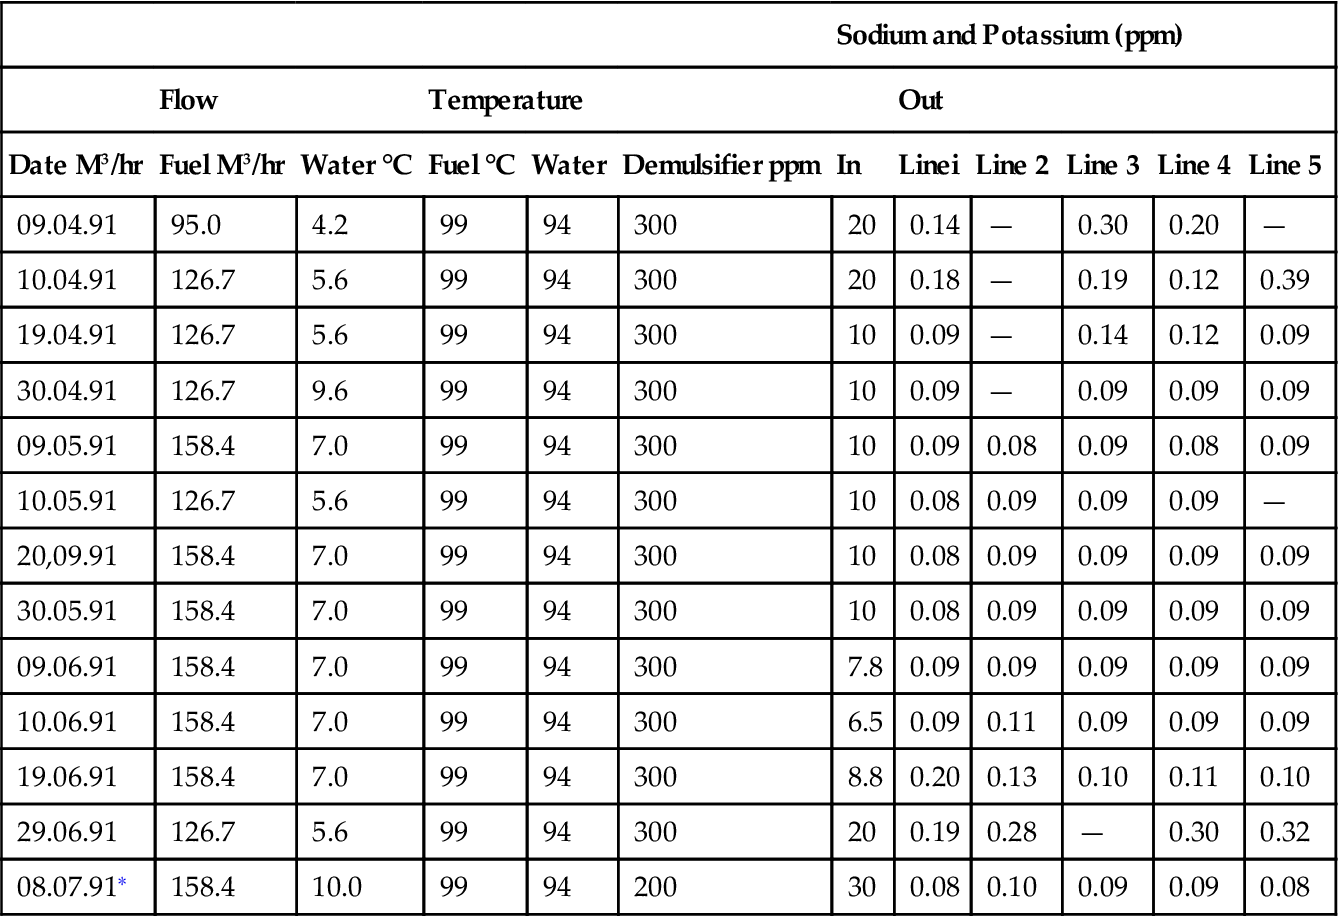
∗Acceptance run.
(Source: Westfalia.)
Naga Power Plant, the Philippines (Gas Turbine OEM: Alstom)
The OEM requested a fuel treatment system that can handle 13.8 m3/h of residual fuel with a specific gravity of up to 0.952 at 16°C and a viscosity of up to 220 cSt at 50°C.
Incoming fuel will have a sodium plus potassium level of 50 ppm and must be reduced to ≤1.0 ppm. During the acceptance test the sodium plus potassium was reduced from 70 ppm to less than 1 ppm.
The fuel washing system consists of:
Fuel Forwarding
Two 100% flow pumps are moving the fuel from the raw fuel storage via a duplex strainer to the centrifuge section. Downstream of the pump a demulsifier is introduced to the fuel.
After that the fuel flow powered a two stage washing system. The system includes the thermal heater, three multi-stage mixers, and three OSB 35/40 centrifuges—two in operation and one standby. This arrangement permits the customer to save on power.
When testing this system, the fuel washing line reduced the sodium plus potassium from a nominal average of 50 ppm to ≤1.0 ppm (Table 7–19).
TABLE 7–19
| Flow | Temperature | Demulsifier ppm | Sodium and Potassium, ppm | ||||
| Date | |||||||
| Fuel m3/hr | Water m3/hr | Fuel °C | Water °C | In | Out | ||
| 14.02.92 | 8.0 | 0.4 | 98 | 98 | 250 | ≤50 | ≤0.5 |
| 8.0 | 0.8 | 98 | 98 | 250 | ≤50 | ≤0.5 | |
| 10.0 | 0.5 | 98 | 98 | 250 | ≤50 | ≤1.0 | |
| to | 10.0 | 1.0 | 98 | 98 | 250 | V50 | ≤0.5 |
| 12.0 | 0.6 | 98 | 98 | 250 | ≤50 | ≤1.0 | |
| 12.0 | 1.2 | 98 | 98 | 250 | ≤50 | ≤1.0 | |
| 20.02.92 | 13.8 | 1.4 | 98 | 98 | 250 | ≤50 | ≤1.0 |
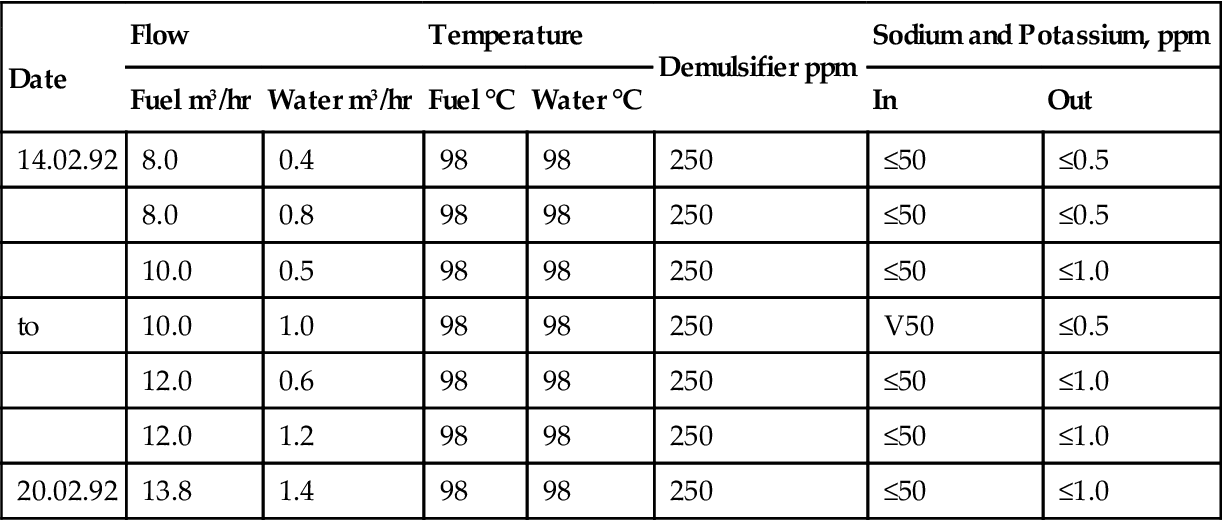
(Source: Westfalia.)
The cases in this chapter add perspective to the subject of mature OEM-developed technology with specific and/or unconventional gas turbine fuels.
Case Study 1 is a residual “bunker” fuel case study12 featuring the Limay Bataan plant in the Philippines (2001-GT-2013).
Case Study 2 is based on extracts of C. J. Goy, A. J. Moran, and G. O. Thomas, “Autoignition Characteristics of Gaseous Fuels at Representative Gas Turbine Conditions,” IGTI 2001-GT-0051. In this case, optimization of the premixer (of fuel and air) for minimized emissions by OEM (Rolls Royce) designers is discussed. The case is interesting in that it provides a basis to compare this OEM’s design philosophy versus the others whose cases are included here.
In Case Study 3, the tri-fuel injector for LPG and naphtha applications made by Alstom for the Tornado gas turbine is explored. This case is based on extracts from A. Newman et al., “From Concept to Commercial Operation—the Tri-Fuel Injector Used for LPG and Naphtha Applications,” IGTI 2001-GT-0079. The design philosophy discussed here has EGT (European Gas Turbine) roots and therefore is part of EGT’s original strategy to cater to the requirements of the Asian and east European market (among others), which could access LPG and naphtha more easily than natural gas, LNG, and diesel. The design strategy taken parallels the end user’s requirements and therefore presents a particularly interesting case.
Case 4 discusses the Siemens approach to the applications issue addressed by Alstom in Case 2. It is based on extracts from E. Deuker et al., “Multi Fuel Concept of the Siemens 3A-Gas Turbine Series,” IGTI 2001-GT-0078.
Case 5 deals with the use of blast furnace gas to fuel a 300 MW CC plant. The steel plant the power plant serves is in China and makes its own power, as well as its CC fuel. The CC package is Mitsubishi’s (MHI).
Case 6 discusses experimental work done on using biomass fuel in DLN combustors by Siemens.
Case Study 1: A Residual “Bunker” Fuel Case Study (Metro Manila, Limay Bataan Combined Cycle)12
Alstom Power is among those OEM that have had success in the residual fuel arena.
CCPP = combined cycle power plant
NPC = National Power Corporation
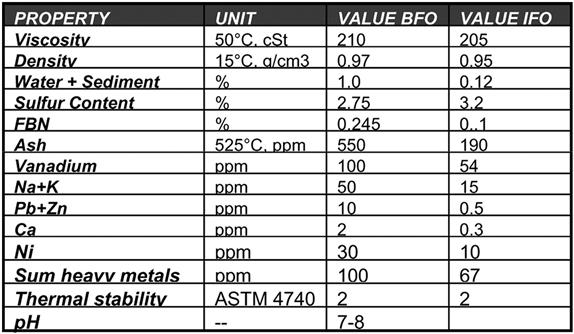
BFO = generator blended fuel oil
TFO IFO = treated fuel oil, intermediate fuel oil
HP/IP/LP = high/intermediate/low pressure
The use of ash-bearing oil fractions in gas turbines seems a rather exotic application. Of all the installed MW running on ash-bearing fuels, 27% have been installed by Alstom Power. The Limay Bataan CCPP installation in the Philippines is one of them, burning the heavy residual oil produced in the PETRON Bataan refinery near Limay.
Owned by National Power Corporation (NPC), this power station is fully operated and maintained by Alstom Power under an O&M contract for 15 years. This section highlights the operational experiences gained in this facility. In this section, operational aspects of using heavy oil in gas turbines are discussed using the experiences made at the Limay Combined Cycle power station with an output of roughly 600 MW. Having been in commercial operation for eight years on this specific fuel type, it can be said that this is one of the most efficient ways of burning this type of fuel.
The first combined cycle power plant contract in the Philippines was awarded to a consortium of ABB/KHI/Marubeni on a turnkey basis for the financing, design, build, and turn over to NPC. Among many requirements for the project the following were the most important ones:
• It must be possible to structure the financing scheme within a very short time.
• The GT should be equipped and capable of operating on different liquid fuels.
• The plant should be able to generate electricity within one year.
With the main components for Limay coming from various countries, such as the USA, Japan, Germany, and Switzerland, it was possible to structure a multi-national export loan facility with the corresponding governmental agencies, US-Exim, Japan-Exim, Hermes, and ERG.
Initial Power for Metro Manila in Record Time
To meet the very important third criteria and reduce the daily eight-hour brownouts, the project was split into two phases. The phase one gas turbines were completed in simple cycle mode by shipping and erecting preassembled blocks. It was possible to commence commercial operation only 8.5 months after the notice to proceed from National Power Corporation. The first block of three gas turbines was available after 13 months, the second block after 18 months.
To allow the energy to be provided to Metro Manila, the 230 kV HV lines to the nearest substation some 50 km away from the plant had to be built within the same short time period. This task was managed by NPC on time.
With the restricted choice of fuels the location was chosen adjacent to Petron Bataan Refinery to take advantage of the available heavy residual fuel oil.
Limay Bataan Combined Cycle and Extension with Block “B”
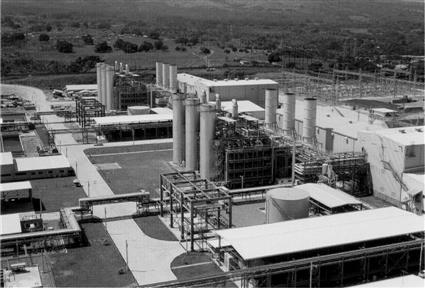
The plant is depicted in Figure 7–50.
Phase two of completion, in which a 114 MW steam turbine (ST) was added using the steam produced in the heat recovery steam generators (HRSG) and thus completing the combined cycle, was achieved 12 months later, with the commissioning of the ST of Block “A,” on 25 November 1994.
Financial constraints led the plant to be ordered in two separate blocks, to limit engineering efforts. Block “B” was to be identical to “A.” Block “B” was handed over on 25 February 1995.
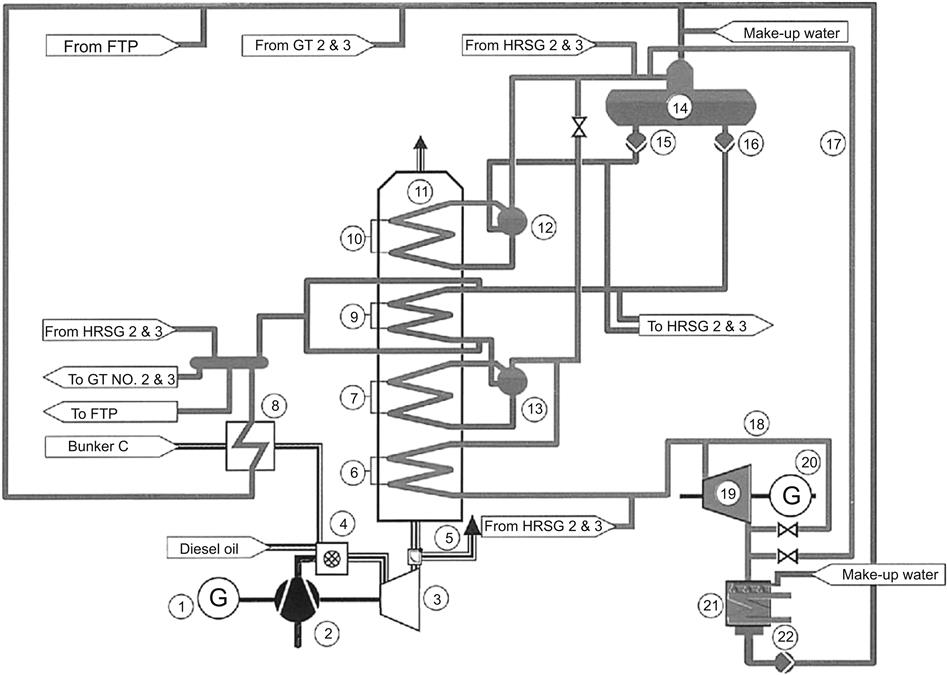
The combined cycle process is depicted in Figure 7–51. Each combined cycle block comprises three Alstom Power GT 1 1N gas turbines, three unfired natural circulation heat recovery steam generators, the steam turbine, main transformers, and high voltage switchyards. Overall control for each block from a central control room is operated by use of Procontrol P system. Each gas turbine is rated at 70 MW and is fired on treated fuel oil (TFO) with startup on diesel fuel oil. Water injection is available to augment power output. The steam turbine is rated at 114 MW. Total site guaranteed output is 615.2 MW (dry) and 651.2 MW (with power augmentation) at an ambient temperature of 32°C. Sea water from Manila Bay is used for the main cooling system.
The heat recovery steam generators are supplied by KHI under a licensing arrangement. Each supplies 35.2 kg/s of steam at 50 bar/493°C to the steam turbine and 8.7 kg/s saturated steam for ancillary services in the plant.
The steam turbine has an integrated HP/IP casing and a single flow LP casing exhausting to a conventional titanium tube sea water-cooled condenser. For startup or ST trips each HRSG can bypass steam directly to the main condenser. Each power unit is coupled to an air-cooled generator producing power at 13.8 kV to be stepped up to 230 kV en route for the switchyards and then into the North Luzon Grid to feed Metro Manila.
The operating mode of the plant is normally in combined cycle. However, each gas turbine can be operated anytime on simple cycle as gas bypass stacks and diverter dampers are fitted before the HRSG. Figure 7–52 provides operational data.

The efficiency of the plant is—based on heavy fuel oil operation—at 46.6%.
Operating Experiences
Fuel and Fuel System
The residual fuel produced in the refinery is a very heavy product with varying quality, as can be seen in Figures 7–53 (specification) and 7–54 (actual supplies, demonstrated on the Na + K and heavy metals contents). The product would not meet the Philippines environmental standards with respect to SOx emissions. Hence this “IFO” (intermediate fuel oil) must be blended with a low sulfur diesel oil (DFO) at the site to achieve a maximum level of 2.75% sulfur in the blended fuel oil (BFO). During the last year, due to some changes in the refining process, the refinery was able to provide fuel that met the requirements. This situation, however, was only temporary, and by July 2000, the existing fuel mixing system was again in operation.
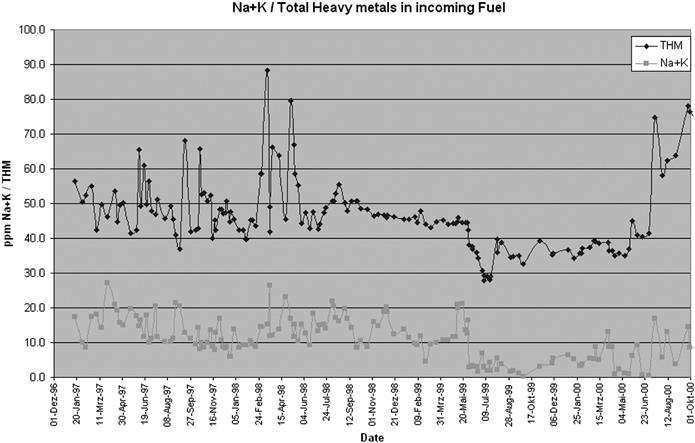
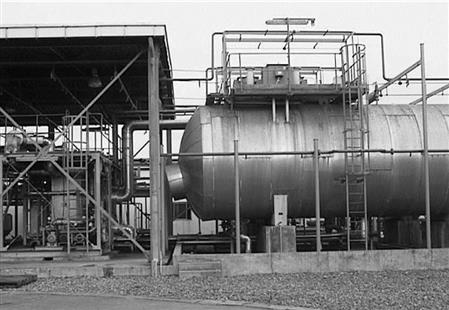
The fuel system is therefore quite complex and requires attention as it is not only a multi-step process, but also has to feed the two blocks simultaneously and continuously with fuel that meets the gas turbine fuel specification and can achieve the environmental standards set by the Department of Environment and Natural Resources (DENR). The system is described in Figure 7–55. The raw fuel, IFO, is stored in two large 15,000 m3 tanks and is blended with diesel oil to meet the sulfur content criteria. As the sodium content is also quite high, fuel washing is required.
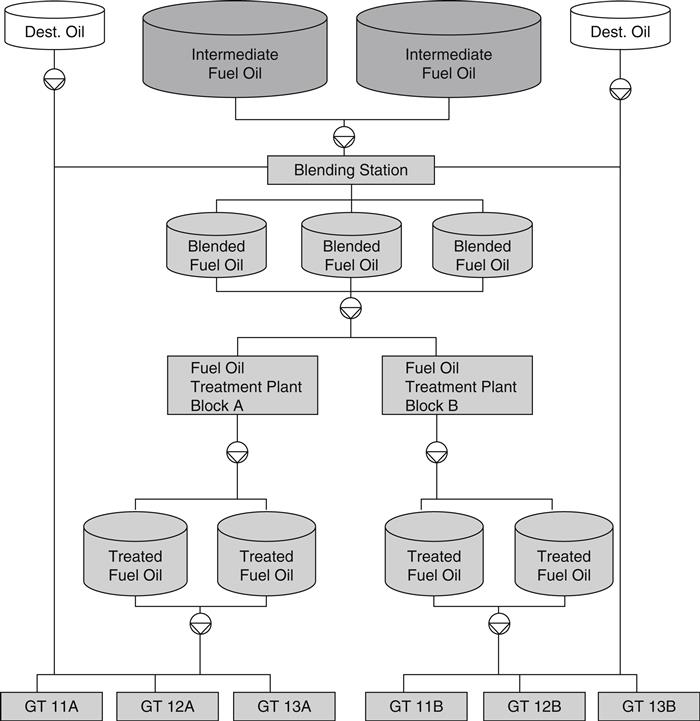
Each block therefore has its own fuel treatment plant (Figure 7–56) based on a two-stage washing process with electrostatic separation of the two phases, water and oil. This process adds water to the fuel to extract soluble salts and hydrophilic matter. This water is then separated by applying an electrostatic field that causes the water droplets to coagulate and separate out by gravity force. The separated oil must meet a sodium plus potassium content of <1 ppm and should therefore contain an absolute minimum of residual water. The extraction water must be virtually free of oily matter as it may only contain 10 ppm of residual oil. The fuel is then stored in four tanks of 5000 m3 at approx. 60°C and then preheated to approx. 110–130°C for the combustion process in the GT combustor. In order to minimize high temperature corrosion caused by vanadium pentoxide, an Mg-based additive is added immediately before combustion to the fuel.
Experience with the fuel handling has shown various problems that occurred as a function of time. One occurred after three years of operation when suddenly the separation of the water was extremely difficult to handle and multiple recirculations of the oil became necessary to meet the requirements. Investigation of the problem revealed that part of the water/oil mixture had partially become a quasi-stable emulsion that did take longer to separate, although different demulsifiers were added.
A detailed fuel analysis finally showed that the pH of the fuel, due to processes at the refinery, was in the higher alkaline range and varied between 8 and 9.5 instead of 7–8. In this pH range the alkalinity is causing ideal conditions for stable emulsions. The reason for this alkalinity was investigated and found in the refining process.
When processing crude oils, the normal practice is to reduce chloride salts to very low concentrations via electrostatic desalting techniques. Primarily this is done to control chlorides carry-over into the distillation unit and thereby minimize the formation of corrosive hydrochloric acid. In cases where efficient desalting is not employed and where unacceptable levels of chloride salts may enter the distillation column, many refineries adopt the less desirable use of sodium hydroxide (caustic soda, NaOH) for corrosion control.
The main purpose of the sodium hydroxide is to convert the more volatile calcium and magnesium chlorides in the crude oil to the more stable sodium salt. Under high temperature distillation conditions, sodium chloride hydrolyzes less than calcium and magnesium chlorides, and therefore the rate of dissociation to form corrosive hydrogen chloride (HCl) is reduced.
Also, naphthenic acids can be corrosive under certain high temperature conditions, and sodium hydroxide is sometimes utilized to control this type of corrosion in refinery equipment. Obviously, this may solve these refinery problems, but without looking at the effects in the power plant, where the presence of sodium is highly critical and treatment is carried out to remove sodium from the fuel.
Essentially, the problems in the power plant result from the fact that it is difficult for refineries to add exactly the required concentration of sodium hydroxide for corrosion control, and the common tendency is to overtreat with an excess of NaOH. This results in high pH alkaline conditions in refinery effluent water streams, and the carry-over of “spent” sodium hydroxide into the residual oil fractions of the crude oil distillation process.
These high pH conditions, particularly if associated with oils containing naphthenic acids, result in the stabilization of oil-in-water emulsions and may lead to the generation of unacceptable oily effluent water streams. Experience shows that for pH of the effluent water higher than approximately 9.2, an effective effluent water treatment becomes difficult.
As the fuel spec in NPC’s Fuel Supply Agreement and in the GT fuel specification had pH requirements, the solution had to be found together with the refinery and the OEM of the fuel treatment plant. After thorough testing of various demulsifiers with the fuel/water emulsion in the laboratory and in the field, and the introduction of a more strict quality assurance program on the refinery side, the fuel treatment plant is now operating with higher tolerance on pH. Excursions on the pH are limited as a consequence of stricter quality control of the fuel in the refinery.
The pH problem also caused a consequent problem in the treated fuel oil tanks. Usually the fuel arrives with 0.1–0.3% of bottoms, sediment, and water (BS&W), which would partially settle out. The above-mentioned fuel instability caused formation of a very high amount of sludge that accumulated at the bottom of the tanks. It was noticed that the fuel quality started to deteriorate at the tank outlet and an investigation was carried out by intensive sampling of the tank. This investigation revealed that approximately 250 m3 of sludge type material was present in one tank; hence cleaning was the only way to restore the full tank capacity. The cleaning process was executed by a specialized company that separated fuel from the sludge such that approximately 90% could be recycled as fuel and the rest, cumulating in 66 drums of combustible material, was processed under control of the Department of Environment and Natural Resources (DENR). Tank bottom surveillance and regular tank sump drainage is now part of the daily operation program.
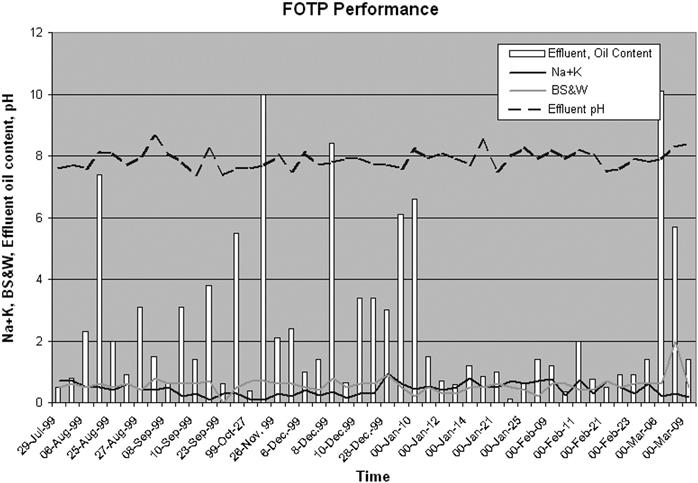
It can be summarized from this eight year experience in treating various fuels in Limay with the electrostatic equipment that this equipment is indeed maintenance friendly, as there is hardly any maintenance required and the process is very stable and runs reliably. Except for the case above and the wide range of basic fuels that was used, the electrostatic fuel oil treatment plant needed no further adjustment to achieve the requested fuel quality. The performance of the plant is depicted in Figure 7–57. Starting and stopping the plant has not been a problem. A restart of the process is easy and can be executed without difficulties. Within 4–5 hours after initiating the process, the plant is producing quality fuel at full throughput.
The fuel quality needs to be closely monitored for the following reasons: On one hand, the content of trace metals such as vanadium and sodium are critical for avoiding high temperature corrosion and on the other hand, physical and chemical parameters determine emissions and combustion quality. Therefore, a complete laboratory equipped for water and fuel analysis as well as emission monitoring is also part of the site.
Gas Turbine Operation
Burning residual oil in gas turbines involves skills and special precautions, because it is a low grade, ash-bearing fuel. This ash is corrosive and causes slag type deposits.
Sodium (Na) and vanadium (V) represent the main challenge. During combustion they form salts and oxides that are highly corrosive and lead to plugging and fouling. Alstom Power has developed the skills to apply ash-bearing crude and heavy oils successfully in the 50 years since it pioneered the burning of “low grade” fuels in its heavy-duty industrial gas turbines.
The two important steps to this are to (a) wash the fuel, i.e., to remove the alkali metals and (b) inject magnesium (Mg) additive to inhibit the vanadium by forming high melting Mg-vanadates. The resulting magnesium ash deposits and buildup on the hot turbine parts (particularly the blades) lead to deterioration of performance. Fortunately these deposits can be removed by shutting down the machine and water washing. Most of the deposits have a ceramic nature and spall off with the temperature differences and after cooling the remaining deposit is washed off with water, injected via nozzles strategically positioned within the turbine. After such “offline” washing the machine performance is restored.
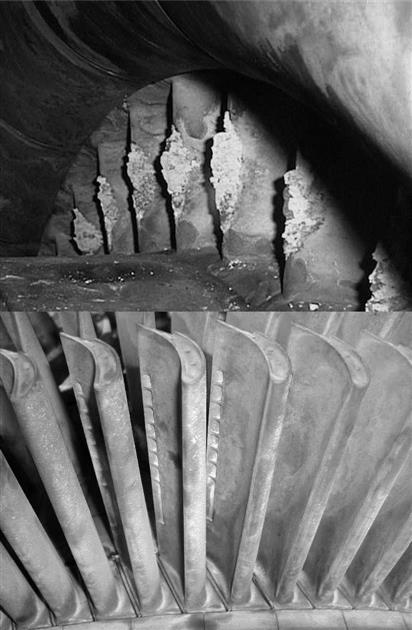
Experience has shown that the critical issue in the first stages is to keep the deposits washable, as they tend to form oxides instead of the washable sulfates and hence they may be more difficult to remove by washing (Figure 7–58).
The deposit is thermally structured, i.e., the oxides usually prevail at the surface whereas sulfates are still present in the lower layers of the deposits. With decreasing temperature in the machine, the deposits are mainly sulfate and vanadate, with increasing V2O5 being present at the last stage of the blades as a yellowish powder, together with MgSO4.
During the offline washing, the diverter dampers are closed and exhaust gases are led to the bypass stack. The deposits that are washed off are collected in the diverter damper sump area. This process is typically run until the wash water is clear. An immediate restart of the unit after the washing further removes deposits by the physical action of water in the deposits that evaporates and spalls deposits off. In general, the cleaning effect is very good and power is regained completely. A wash cycle, including cool-down and restart, has a typical duration of 12 h.
Figure 7–58 shows the effect of the deposition of ash and its removal by washing. The pictures show the blading as it typically can be seen after the washing process. The washing is quite effective and restores most of the power and heat rate losses in the turbine.
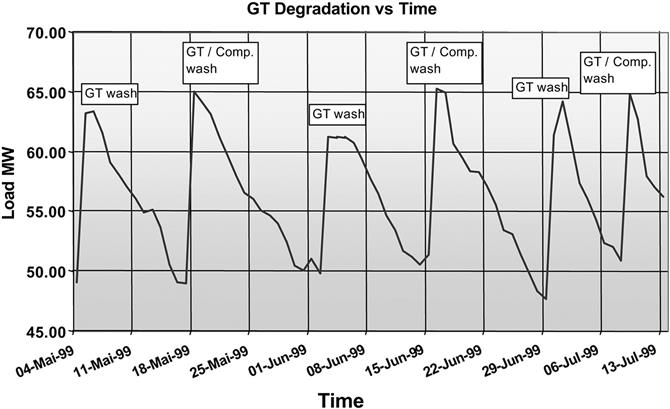
The plant also performs regular compressor washing as a standard procedure, usually when the turbine is washed. In order to regain the complete mass flow, the compressor is only washed offline. As can be seen in Figure 7–59, the combination of compressor and turbine cleaning enhances the washing effect repeatedly and considerably. The deposits on the compressor side contain soot and hydrocarbonaceous material. Therefore a biodegradable compressor cleaner is added to the water.
HRSG Operation
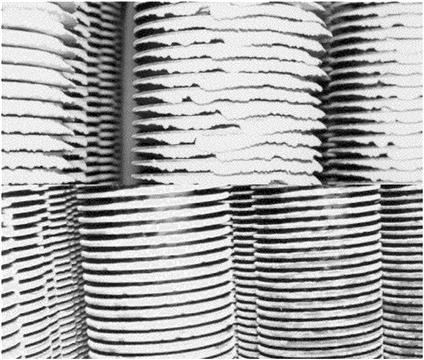
Deposition in the HRSG is mainly consisting of MgSO4 and V2O5, which has not deposited on the blading and which is the major portion of the ash. As the temperature is already quite low, sintering is no longer occurring; hence the deposits are light and easily removed (Figure 7–60).
Cleaning of the boiler is performed by soot blowing with a substantial effect on the heat transfer regain. Typically soot-blowing is carried out daily and results in a constant regain of power output. As the back pressure is also reduced, the gas turbine improves in output again (Figure 7–61).

Soot blowing is quite effective in cleaning the boiler tubes. This method may even gain focus in terms of the acidity of the deposits. In the lower parts of the cold end, any remaining MgO would of course attract free SOx and neutralize it. These deposits can also absorb free SO3 and form acidic deposits. It is therefore not surprising that washing water is rather acidic and acts as a sulfuric acid at the outlets of the wash water. Sufficient corrosion allowance and replacement when needed, combined with regular monitoring for safety reasons, are the main measures taken against acid corrosion up to now. There may, however, be an additional improvement by introducing a modified washing of the HRSG in order to reduce the effects of the sulfuric acid. The same study that is dealing with soot blowing will also investigate these possibilities, which will be reported on at a later date.
Heavy Oil Operation vs. Diesel Oil Operation
It is often questioned whether the operation on a heavy fuel oil is attractive in light of the additional measures that have to be taken in order to reduce the immediate effects of the combustion of this fuel. Additional efforts are the fuel treatment itself and the additive dosing. Due to the corrosiveness of the environment hot gas path parts show higher wear and tear than comparative parts in clean fuel gas turbines. Comparing the effort on an annual basis, the additional cost for treatment, including all chemicals, maintenance, and operation of the FOTP is <5% of the annual fuel costs. Comparing the cost with the additional cost running on a fuel such as diesel oil, the savings are related to the annual diesel costs, in the range of approximately 10%. This takes into account that the diesel to heavy oil index has changed from >2 in 1996 to about 1.4 in 1999, which makes the difference smaller.
Taking into account the side effects on the turbine output and efficiency, these numbers are reduced to a benefit of roughly 7% for heavy oil operation. The fact that this fuel is available from the refinery next door and must be used in a cost-effective way makes the scenario quite attractive.
The inspection concept of A, B, and C inspections has proven to give enough information to be able to plan the major (C-) inspections in detail and hence be efficient. Nevertheless the gas turbine is the most delicate part of the plant. Incidents in the early days were fortunately limited to a second stage blade failure caused by high cycle fatigue, in combination with a resonance excitation from grid instabilities. The blade was modified for higher tolerance and has operated satisfactorily ever since. In fact, part of the blading is now reaching longer lifetimes than actually expected under these conditions.
In order to be able to carry out the major inspections quickly and efficiently, the individual steps of the inspection were critically analyzed. This analysis was then transferred into a work plan. At the same time it was also decided to invest in additional hardware on site, which can be preassembled to a higher degree and hence reduces the actual outage time. All these actions reduced the original outage time from roughly four weeks to only 12–15 days.
As an example, one of the decisions in O&M was to have fully bladed vane carriers on site that could be prepared for exchange while the unit was still in operation and then be exchanged as a whole. The blading and deblading process of the stationary blading is therefore outside the inspection period and also the parts removed from the machine can be moved out of the space where the turbine is being inspected. There is more room, which improves overview and planning. Similar solutions have been found for the combustion chamber, which is now overhauled with the same principle. Using a second combustor to replace the one going for inspection has also given a boost to quality in a sense that during the pre-assembly, there is enough time for quality assurance during assembly and training on the actual material.
As there are six units that need to be inspected, the local team has developed excellent skills in performing the inspections. The Limay Bataan team will now only require a few specialists, and the major portion of the work can be organized locally, in close cooperation with Swiss headquarters. At the time of writing this case study, the first two gas turbines of Block “A” were again inspected after roughly 50,000 equivalent operating hours. Both units were back in operation after 15 days.
Plant Performance and Availability
Availability is defined as the period of time when the plant or part thereof is available for operation and is evaluated as an equivalent availability, i.e., if the load must be reduced for reasons that the operator has caused, the duration of this part load time is expressed as equivalent full load time loss.
Availability can be kept at a reasonably high level by proper operation and planning, considering the necessities of the specific fuel. The availability of the plant has been carefully monitored and actions were taken to minimize outage times, as described earlier.
Forced outage events were mainly related to the gas turbines, as the fuel effects nevertheless impacted the availability. Washing of the turbine is a necessary outage, and counts as a non-availability period. The high levels of availability are also influenced by the fact that the units are not actually dispatched by the National Grid Company to run at station base load for economic reasons. This allows longer intervals between washings, and flexible unit operation, providing the required power at all times.
Case Study 2: Autoignition Characteristics of Gaseous Fuels at Representative Gas Turbine Conditions13
The autoignition properties of gas turbine fuels have been studied for many years and by numerous researchers. The advent of ultra low emission industrial gas turbines using lean premixed technologies has given rise to premixer designs with longer residence times. This, in conjunction with the ever-increasing pressure ratios of aeroderivative machines, leads to the potential for autoignition within premix ducts, and has therefore renewed the interest in this field. Although much has been published, data in the region of interest to high-pressure ratio gas turbines are extremely sparse. Similarly, modeled autoignition delay times are not very accurate, as most reaction mechanisms were not generated to cover this range of conditions. Hence the uncertainties of autoignition delay times at gas turbine conditions are significant, thereby either imposing over-stringent design limitations or introducing risks of ignition occurrence in the early design process.
A series of experiments has been carried out for methane and simulated natural gas fuels in the region of interest, using shock tubes as the test vehicle. The experimental technique was chosen to isolate only the chemical kinetic component of the autoignition delay time, without any additional delays due to mixing and heating of the test gases. Predictive correlations and a chemical kinetic model (the GRI mechanism) have also been used to predict autoignition delay times at the same conditions. The correlation between experiment and prediction has been shown to be poor at representative temperatures. This case discusses some of the possible explanations for this poor agreement.
As worldwide emissions legislation becomes ever more stringent, there is a requirement for combustion engineers to design gas turbine combustors with the capability to produce extremely low levels of NOx and CO in the exhaust. Such low levels of pollutant emissions can only be achieved by extending our understanding of current premixers, to maximize the mixing quality of fuel and air prior to entry into the combustion process. However, with the elevated inlet temperatures and pressures characteristic of high-pressure ratio aeroderivative machines, a limit is reached where the time required to fully premix the fuel and air streams becomes comparable with the autoignition delay time for the combustible mixture. A compromise is therefore sought between optimum mixing quality and freedom from autoignition. During the design process, this compromise is currently achieved by experiment. This approach is costly and time-consuming, as it involves the manufacture and testing of many design iterations. If validated predictive chemical kinetic schemes were available, and incorporated into computational fluid dynamics (CFD) codes, then the combustion engineer could have access to a predictive tool, for the optimization of future designs at minimum cost and in shorter timescales.
There are currently very little autoignition data available in the public domain covering the range of initial temperatures and pressures relevant to high-pressure ratio gas turbines. Many researchers have studied the autoignition characteristics of natural gases in shock tubes at high temperatures, typically above 1200 K, which is significantly above the inlet temperature range applicable to aero-derivative gas turbines. Much work has also been performed in flowing rigs at representative gas turbine temperatures, but to only moderate pressures. A gap exists in our knowledge over the range of temperature from 800–1000 K, and pressure from 10–40 atm. It is crucial that data are gathered in this region to enable the validation of chemical kinetic reaction mechanisms for use in combustion design tools.
This case presents the results of a series of shock tube experiments, aimed at determining the autoignition delay time of methane and natural gas mixtures at representative gas turbine combustor inlet conditions. The main objective is to determine the major factors influencing autoignition delay time in gas turbine combustion systems. Firstly, the autoignition characteristics of methane were determined over a range of temperatures and pressures. Then, to determine the sensitivity of autoignition delay time to variations in natural gas fuel composition, a series of tests were carried out with both ethane and propane added to the methane test gas. The effects on autoignition due to variations in stoichiometry and humidity levels were also investigated. The validity of the current experimental data is discussed, particularly in the lowest temperature range, where the measured autoignition delay times approach the observation time limit of the shock tube.
The resulting experimental data are compared against predictions from the GRI chemical kinetic mechanism and correlations from previous researchers (consult complete source work for reference list), to assess their suitability in predicting autoignition delay times in the gas turbine combustor. Finally, several suggestions are offered to explain why the agreement is poor at lower temperatures.
τ = Autoignition delay time, in seconds
[HC] = Non-methane hydrocarbon concentration (all in molecules/cubic centimeter)
Measurements of Autoignition Delay Time
All of the experimental data were generated in a shock tube of length 6.75 m and internal diameter 64 mm, shown schematically in the upper part of Figure 7–62. The driver and test section lengths were 3 m and 3.75 m, respectively, and a double mylar diaphragm separated the two sections prior to initiation of the test. Helium gas was used in the driver section to minimize boundary layer effects in the tube.
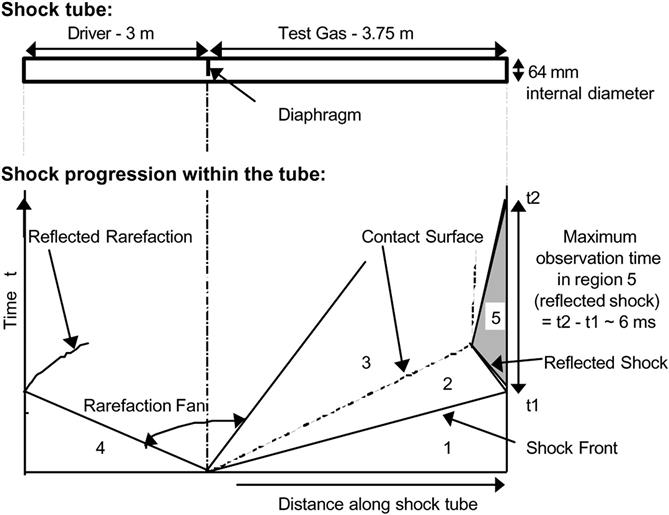
For the majority of the work presented here, the test gas simulated a methane/air mixture with an equivalence ratio of 0.5. Experiments were also performed on a number of other test gases, to investigate the effect on autoignition delay time of variable fuel composition, stoichiometry, and humidity. Each test gas mixture was produced in a vessel by the method of partial pressures, and allowed to mix thoroughly before its introduction into the shock tube. Before filling, the tube was brushed clean of debris from the previous test, and then evacuated. The length of the shock tube enabled a maximum test observation time in the reflected shock region of approximately 6 milliseconds, as shown schematically by the progression of the shock fronts with time in the lower part of Figure 7–62. The long observation times required for lower temperature autoignition measurements can cause the experiment to be compromised, due to low shock velocities in a long tube enabling boundary layer build-up and hence bifurcated shocks within the test section. This will be discussed later.
For all of the experimental work presented here, the onset of pressure rise at the test section end wall was used as the indicator of an autoignition event. This was chosen because an increase in pressure is a definite indicator of exothermic reaction. As the ignition occurs at the end wall of the shock tube, the autoignition delay time is defined as the time interval between the shock front reaching the tube end wall and the pressure rise due to combustion. Light emission was recorded near the end wall of the shock tube at two wavelengths, corresponding to chemiluminescence from OH (308 nm) and CH (431 nm), and this gave good agreement with pressure rise data where all were measured simultaneously. The experimental results cover a range of initial temperatures from 900–1700 K, and initial pressures from 5–20 atm. The results are described for each test gas composition in turn.
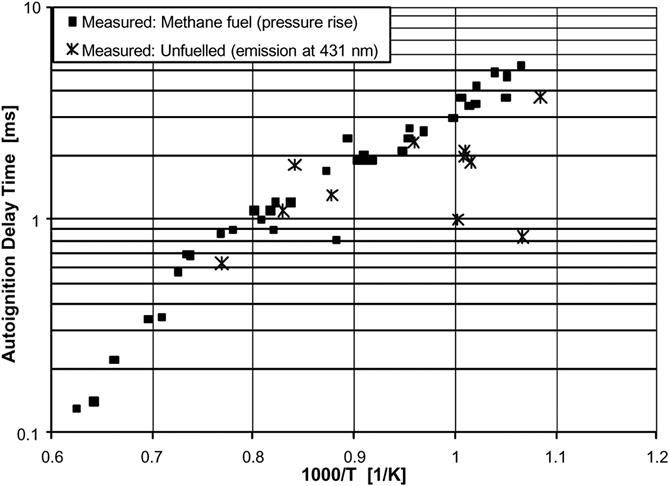
During the course of the current experimental program, a series of control tests were performed to determine the characteristics of the shock tube without any fuel in it. The test gas mixture used in this case was bottled dry air. The results in Figure 7–63 show that, over the entire temperature range, light emission was observed at 431 nm in the unfueled tests at delay times of the same order as the recorded pressure rise during equivalent methane-fueled tests. At temperatures below 1000 K, the light emission was seen after shorter delay times than were typically expected for the autoignition of methane. This indicates that there may be some other source of ignition within the tube, which may affect the validity of the lower temperature data. However, no corresponding pressure rise was observed during the control tests, indicating that there was no significant exothermic reaction in the tube. As the current fueled tests used pressure rise as the indicator of autoignition, the presence of light emission in the control tests is not likely to affect the results presented here. This will be discussed later.
The autoignition delay time for methane is presented as a function of temperature and pressure in Figure 7–64. Predictions made using the GRI mechanism are also plotted; these will be discussed in the next section. The experimental data in Figure 7–64 show that the delay time is strongly dependent upon initial temperature, and is affected by pressure to a lesser extent; autoignition delay time reduces when either temperature or pressure is increased.
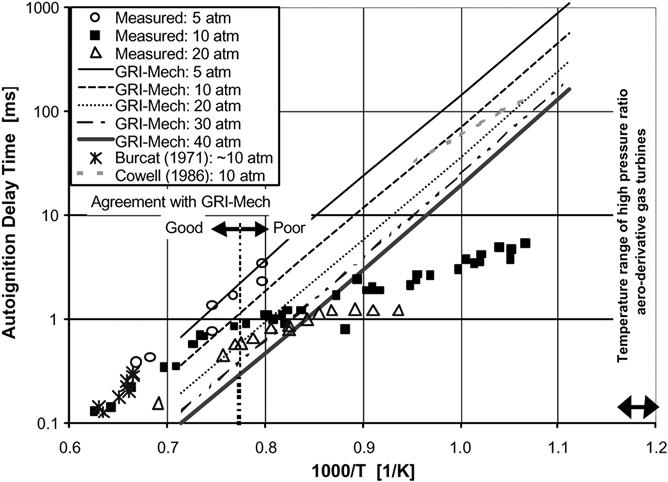
At the upper temperature limit of the present data, it is shown to be in good agreement with previous (1971) works. No other shock tube data were readily available for comparison with the lower temperature results, but flow rig data from a 1986 study, indicated on Figure 7–64, suggest a marked difference between the two experimental techniques at these conditions. Significantly longer delay times were observed in the flowing tests, possibly due to the influence of fuel/air mixing time on the overall time taken for autoignition. The current data appear to show a change in the activation energy at an initial temperature of approximately 1100 K at 20 atm. Similarly, the 10 atm data undergo a change in activation energy around 1300 K.
Having characterized the autoignition behavior of methane, the effect of adding 15% ethane (by volume) to the test fuel was investigated to simulate a possible extreme of natural gas composition. The results are shown in Figure 7–65, where an initial pressure of 10 atm and overall equivalence ratio of 0.5 were maintained for all tests. The data indicate that the autoignition delay time is significantly shortened by the addition of ethane for initial temperatures greater than 1200 K. Below this temperature, the added ethane appears to have no effect on the autoignition characteristics of methane.
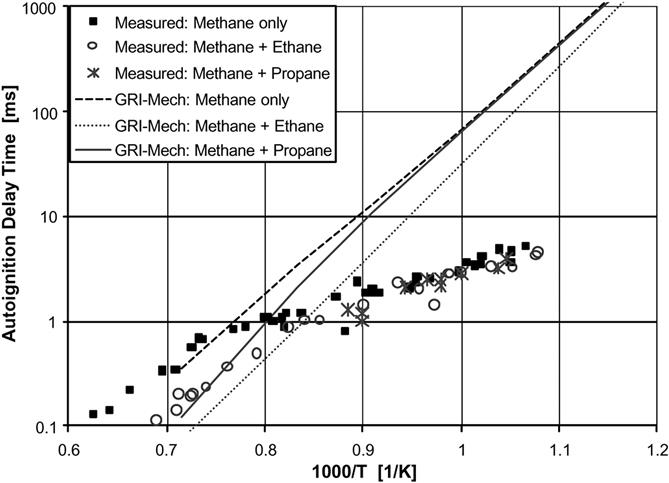
To further assess the impact of natural gas constituents on autoignition, a similar series of tests was performed with 15% propane added to methane. This data series does not extend to a sufficiently high temperature to fully determine its behavior relative to ethane. However, for all three test gas mixtures, shown graphically in Figure 7–65, the delay times begin to tend almost asymptotically towards the observation time limit of the shock tube at temperatures below 1200 K. Under these lower temperature conditions, the results collapse onto one curve, such that the effect of adding this amount of higher hydrocarbons to methane is negligible below 1100 K.
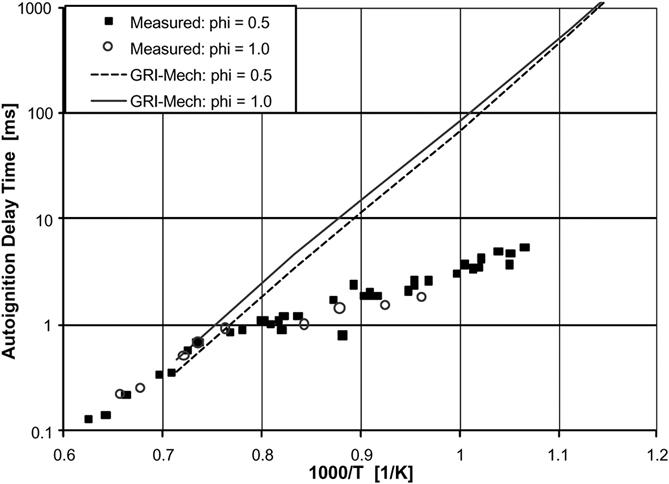
Lean premixed gas turbine combustion systems tend to be optimized to operate at equivalence ratios of around 0.5 at full load conditions, but this may vary widely during engine maneuvers. It is therefore important to understand the effect of variations in equivalence ratio on autoignition delay time, to prevent ignition events occurring during transient operation. Much of the data in the public domain suggest that the equivalence ratio has only a limited effect on the autoignition delay time. The current data, presented in Figure 7–66, confirms that varying the stoichiometry between 0.5 and 1 at 10 atm has only a small effect on the measured delay time. At temperatures above 1200 K the effect was negligible, but at lower temperatures the higher equivalence ratio tended to give rise to slightly shorter autoignition delay times.
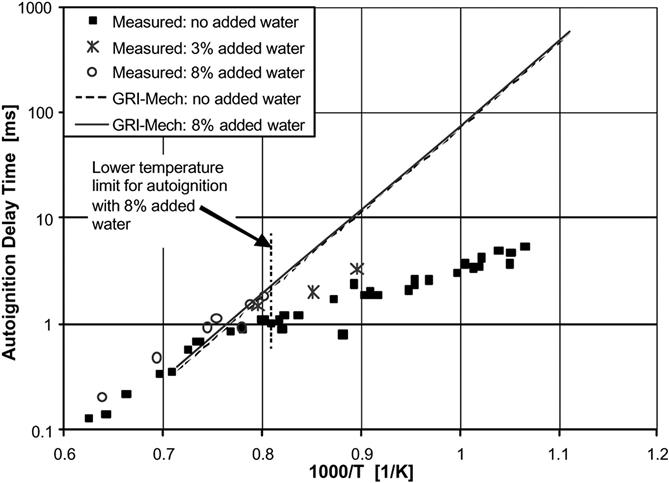
In the final series of autoignition tests, varying amounts of water were added to the test gas to simulate the effects of high air humidity on autoignition delay time. A simulated methane/dry air mixture was used as the baseline test gas, with all experiments carried out at an initial pressure of 10 atm.
Although only a limited number of experiments were carried out with added water, the results in Figure 7–67 indicate that its effect was to slightly increase the autoignition delay time relative to the baseline test. It is also interesting to note that, for the test series with 8% water added, a sharp cut-off temperature was defined (at approximately 1250 K), below which no autoignition occurred.
Discussion
Where other published shock tube data are available, the agreement with the current data is good. However, it is acknowledged that there is a shortage of data in the region of interest to gas turbine combustion. The data tend to be at high temperature (greater than 1200 K), and pressures that are either too low (below 10 atm) or too high (over 50 atm).
The experimental data suggest a change in activation energy at low temperature (below ∼1200–1300 K, depending on the initial pressure conditions). This is depicted by a change in the slope of the data series. The change in slope could be due to other factors than a change in activation energy. Several possible explanations are briefly discussed below:
• A change in the chemistry important to autoignition (i.e., change in activation energy). It is possible that the dominant chemistry at lower temperatures differs from that at higher temperatures. This has also been reported by Petersen et al. (1999) and Li and Williams (2000). The lower temperature chemistry may be dominated by simpler reactions, such as oxygen abstraction, the result of this being that the effects of temperature, pressure and added higher hydrocarbons become small, as was observed experimentally in Figures 7–64 to 7–67.
• A physical limitation of the shock tube. As the delay time approaches the shock tube’s observation time limit, the measurements may be affected. Autoignition events may be spuriously recorded after artificially short delay times. The validity of this statement could be determined by the study of similar tests in different lengths of shock tube.
• Ignition of the mylar diaphragm initiates reactions in the test gas. The series of unfueled shock tube tests revealed light emission from the shocked gases, and a possible source of this emission is combustion of fragments of the mylar diaphragm. At high initial temperatures, where the autoignition delay time of the test gas is shorter than the delay time to emission from the mylar, the data are representative of the test gas mixture. However, at lower temperatures, where the delay time of the test gas becomes longer than that suspected of the mylar, the resulting data may be affected by the diaphragm material. As no pressure rise was observed, it is unlikely that sufficient heat would be generated to accelerate the methane reactions, but it is possible that it could act as a source of ignition. A study of the effect of alternative diaphragm materials would assess this risk.
• Initial heating of the test gas by the incident shock. The current work used the reflected shock technique for the determination of autoignition delay time. As the incident shock passes through the test gas section, it will heat and pressurize the gas, which may cause the initiation of some reactions. This may result in the measurement of artificially low delay times.
• Non-ideal conditions in the shock tube. When studying longer observation times, the likelihood of boundary layers forming in the test section increases. Replacing the nitrogen in the test gas mixture with a monatomic gas such as argon will minimize this effect, but preliminary comparison tests at 10 atm showed this to have a negligible effect on the resulting autoignition delay times.
If the integrity of the lower temperature data is shown to be good, several significant implications arise. Firstly, the suggestion that the actual composition of a natural gas fuel has no impact on the autoignition delay time for temperatures below 1100 K would, if confirmed, offer the potential to greatly simplify the predictive schemes. Also, for practical systems, the ability to elevate the minimum autoignition temperature by the addition of water could signify additional benefits for humid air cycles.
Without exception, all of the predictive methods assessed here show good agreement with the high temperature experimental data.
Case Study 3: From Concept to Commercial Operation—Tri-Fuel Injector Used for LPG and Naphtha Applications14
The tri-fuel injector is an extension of the standard dual fuel multi-passage injector to cover additional fuels such as liquid petroleum gas (LPG) and naphtha at medium pumping pressure (less than 40 Bara). There is an additional passage designed for metering the LPG or naphtha in liquid phase. The fuel system uses a non-contracting rotary pump with modern inverter technology for the pumping of these fuels.
Both tri-fuel injector and fuel system are now in commercial operation on two Tornado engines using LPG, natural gas and diesel fuels. The LPG system is operating just below 30 Bara pumping pressure, and has accumulated about 1029 operating hours on the lead engine. Commercial operation of the Typhoon on naphtha at medium pumping pressure (<40 Bara), with an improved tri-fuel injector, will commence in the near future.
Alstom Power’s industrial gas turbine range was originally designed for operation using standard pipeline quality natural gas, diesel, or both. However, recently there has been increasing worldwide customer interest to operate the turbines on the most economically available top industry and fuels such as liquid petroleum gas (LPG) and naphtha are cheaper alternatives to diesel.
Liquid petroleum gas (LPG) is a by-product of the natural gas treating process or an incidental gas recovered during the oil extraction process. LPG is generally composed of propane and butane, but it can contain lighter and/or heavier hydrocarbons that could be in unsaturated or isomeric forms. LPG fuel quality is closely controlled by international standards.
Table 7–20 shows the comparison of the main LPG fuel properties.
TABLE 7–20
Main LPG Fuel Properties: Propane, Butane
| Properties | Units | Butane | Propane |
| C2 content | % Vol | NIL | 5% max |
| C3 content | % Vol | 15% max | 90% min |
| C4 content | % Vol | 85% min | 10% max |
| C5 content | % Vol | 2% max | 2% max |
| Olefins | % Vol | 60% max | 25% max |
| Vapor pressure at 40°C | Barg | 5.05 max | 15.6 max |
| Dynamic viscosity at 20°C | MPa.s | 0.25 max | 0.2 max |
| Specific gravity at 15°C | 0.585 max | 0.52 max | |
| Heating value (nett) | MJ/kg | 45.82 | 46.29 |
| Autoignition temp (normal) | °C | 360 | 450 |
| Flammability limits | % Vol | 2% to 9% | 2% to 10% |
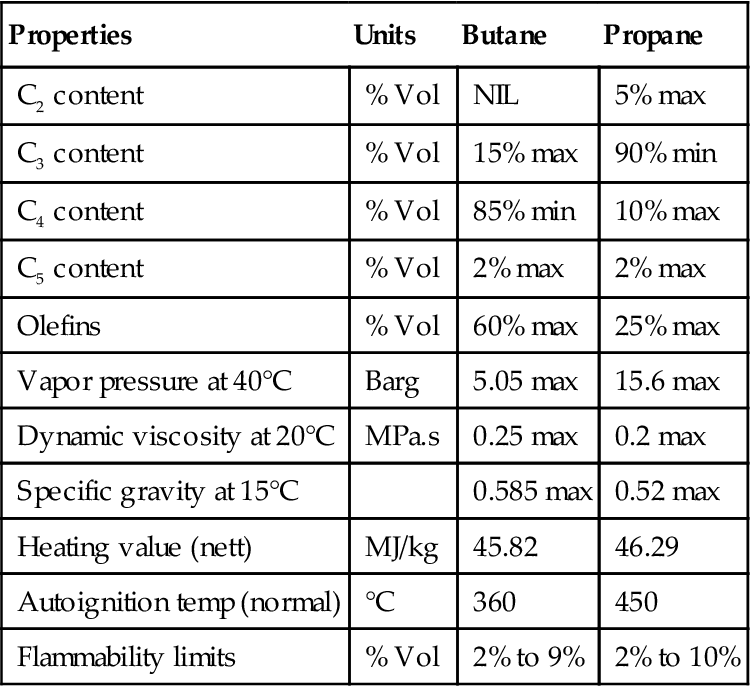
(Source: Alstom Power.)
Naphtha is a generic, loosely defined term that covers a wide variety of light distillates. Naphtha is processed from crude oil through distillation towers in petroleum refineries and it is a primary ingredient in gasoline. It also has wide applications in the organic synthesis and polymer industries. Naphtha fuels are not recognized by standards in the same way as other liquid fuels, although compositions are reported in the literature. Table 7–21 compares fuel properties for gasoline and No. 2 diesel fuel samples with those for a typical naphtha fuel range.
TABLE 7–21
Fuel Properties: Naphtha, Gasoline, and Diesel
| Properties | Units | Gasoline | No. 2 Diesel | Naphtha Range |
| Saturates | % vol | 62 | 68 | 100 max |
| Aromatics | % vol | 35 | 32 | 25 max |
| Olefins | % vol | 4 | <0.3 | 5 max |
| Distillation | ||||
| IBP | °C | 33 | 200 | 30 min |
| 50% | °C | 96 | 297 | |
| 90% | °C | 151 | 353 | |
| FBP | °C | 192 | 379 | 200 max |
| Vap. pressure 37.8°C | Bara | 0.63 | 0.003 | 0.3 to 0.9 |
| Kin. viscosity 37.8 °C | mm2ls | 0.7 | 3.8 | 0.6 to 0.9 |
| Specific gravity | 0.75 | 0.86 | 0.65 to 0.75 | |
| Heating value (nett) | MJ/kg | 42.7 | 42.7 | 43 to 46 |
| Autoignition temp (normal) | °C | 260 | 245 | 220 to 290 |
| Flammability limits | % vol | 0.6 to 8 | 0.8 to 6 |
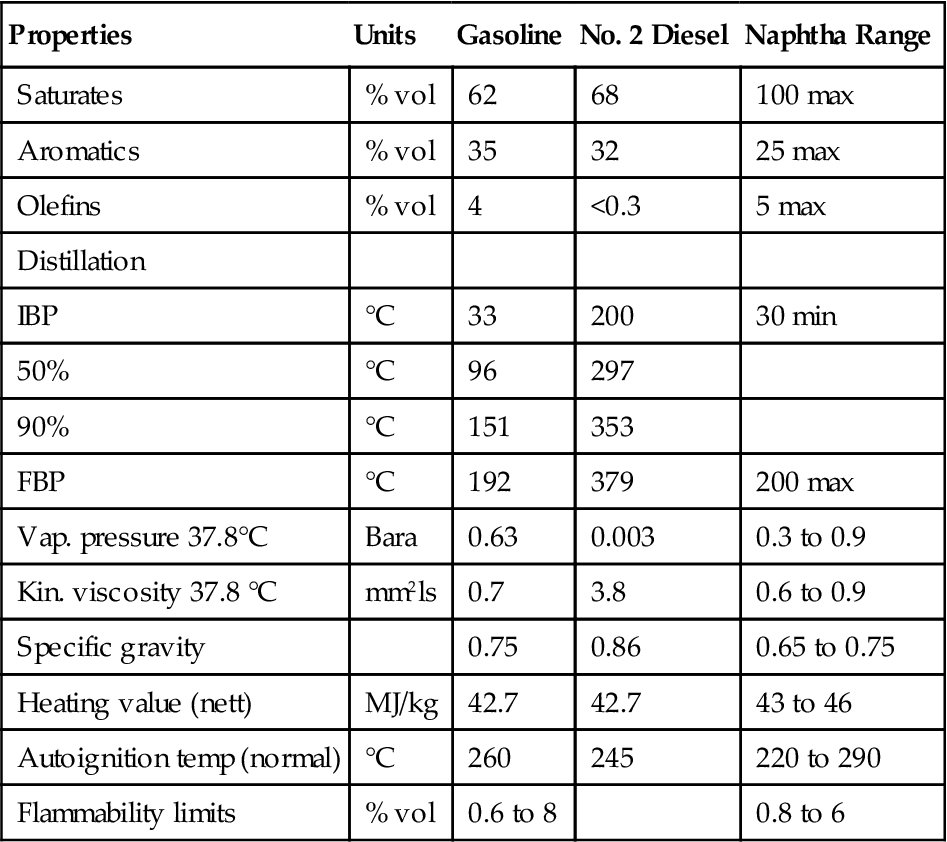
(Source: Alstom Power.)
This case describes the extension of combustion and fuel system technology already proven on natural gas and diesel to cover LPG and naphtha fuels. This technology is being applied to Alstom Power’s Tornado and Typhoon engine range.
Design Objectives
Alstom’s goal was to design a turbine fuel system that could use LPG and naphtha in liquid form, without the need to vaporize the fuel outside of the engine. Significant safety and cost advantages result if the external vaporizer is eliminated if this can be done without the need of a high-pressure fuel system.
There are two engineering problems associated with the handling of liquid LPG and naphtha fuels. Firstly, the fuels must remain in liquid phase while flowing through the fuel system. Two-phase flows consisting of liquid and vapor will cause severe fuel maldistributions to the fuel injectors leading to unacceptable combustor exit temperature distribution and control system instability. Secondly, the fuel system components must be capable of handling low lubricity/high vapor pressure fuels. Lower pumping pressures allow the use of specialist LPG pumps as seen later. The worst design case fuel is LPG propane due to its lowest viscosity and highest vapor pressure at a given temperature.
Figure 7–68 shows plots of saturation vapor pressure versus temperature for propane and butane LPG fuels. To maintain liquid phase the fuel pressure must exceed the saturation vapor pressure at the given supply temperature. Both naphtha and diesel have lower vapor pressures (Tables 7–20 and 7–21).

Alstom’s goal was to achieve a maximum of 40 Bara fuel pressure by operating close to the fuel’s liquid/vapor saturation line. This was achieved by using the thermodynamic properties of the fuel to refrigerate critical components of the fuel injector, this being the hottest part of the fuel system. It is understood that other systems for this type of application directly inject liquid LPG and naphtha at higher pressures between 80 and 90 Bara to ensure that the fuel is well above its saturation pressure.
System Overview
A liquid LPG fuel system was initially designed in order to meet a commercial requirement to supply tri-fuel capability (natural gas, diesel, and LPG) on two Tornado single shaft turbines. This system was designed to achieve maximum LPG pumping pressures of 30 Bara. The naphtha development is discussed later.
In order to meet tight delivery schedules set by the customer, the Tornados were delivered to site as standard dual fuel and the LPG was added later as a retrofit. This delivery matched the customer requirements to run mainly gas but with LPG standby during winter.
Burner and Combustor Installation
Figure 7–69 shows a typical Alstom combustion system, showing the injector to combustor interface. The Tornado system is comprised of eight reverse flow “diffusion flame” tubular combustors. The Typhoon has six similar combustors. There is always one injector per combustion chamber.
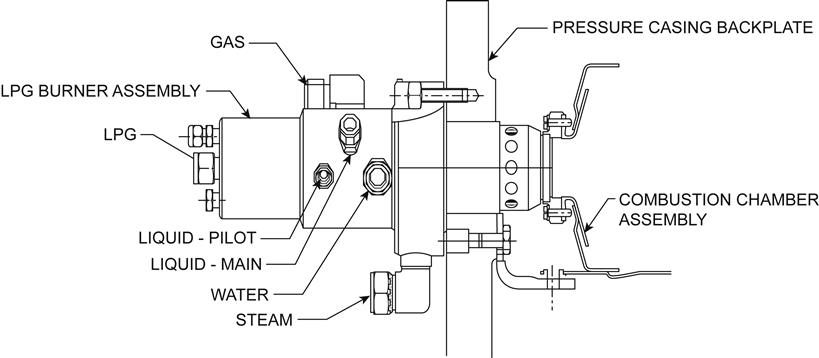
In a tri-fuel LPG system, the fuel system, like the fuel injector, allows the use of fuels close to their vapor point. The system comprises a metering and shut-off valve train inside the turbine enclosure and a separate pumping skid outside of the enclosure.
Due to the widely different thermodynamics properties between diesel and LPG, it was considered less risky to add a separate LPG pump stream to a proven dual fuel system, than to risk the consequences of modifying a single diesel pump stream to cater for LPG. There are also a number of advantages in using separate diesel and LPG pump streams, instead of a single pump stream. These are (a) no risk of cross-contamination between LPG and diesel tanks, (b) able to deliver turbine as standard dual fuel and add LPG later, (c) no requirement to purge the complete LPG system before restarting the turbine on either diesel or natural gas fuels.
Tri-Fuel Injector Design
The tri-fuel injector is an extension of the dual fuel multi-passage injector (MPI) developed jointly with Delavan. The tri-fuel injector (Figure 7–70), like the MPI, has separate passages for No. 2 diesel fuel (pilot and main), gas fuel, compressor discharge air, water, and steam (for emissions control). However, there is now an additional circuit (referred also as tertiary) for both LPG and naphtha.
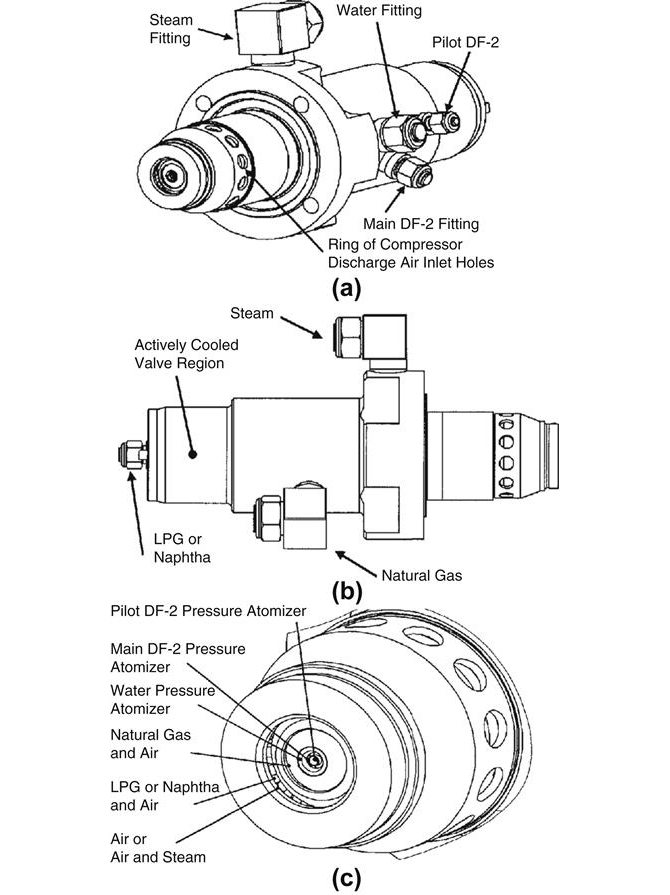
The additional LPG/naphtha circuit comprises a fuel metering device (a flow metering valve and three fixed area metering orifices) and fuel transfer circuits. The valve and fixed area orifices were placed in the back of the injector to limit heat conduction to the valve. Fuel transfer circuits transfer the fuel to the tip where the fuel is vaporized in the LPG version and atomized in the naphtha version.
Fuel Metering Device
The injector’s fuel metering device comprises a metering valve surrounded by cooling circuitry. This is designed to ensure metering of liquid LPG fuel during all turbine-operating conditions. The valve’s piston operates under the action of differential pressure between fuel supply and combustion chamber pressures. Three metering ports are progressively opened as the valve piston moves. The valve crack point is set to give a minimum fuel system pressure of 20 Bara to prevent pure propane from phase changing in the fuel pump, manifold and injector.
As the LPG and diesel supplies are separate, it is necessary to pre-cool the tertiary valve before introducing LPG. For example, if the injector is started on diesel pilot and main and run at part load until steady state, the valve reaches temperatures of 100°C. Before valve crack, expanding a small fraction of the fuel into the separate cooling circuit at the lower combustor pressure actively cools the valve port. The latent heat of vaporization that results from the expansion and phase change, of this small fraction, is utilized to cool the injector valve, keeping the main flow of fuel in liquid phase.
The valve body will always be cooled to a temperature below the saturation temperature of the fuel at the fuel supply temperature. This is the result of the pressure differential and phase change. The lower absolute pressure cooling flow will always be lower in temperature than the saturation temperature of the fuel at supply pressure. This is always true for any composition of LPG even for extreme compositions containing large amounts of ethane, pentane and hexane.
Fuel Transfer Circuits
The fuel is then transferred to the injector tip via three fuel transfer circuits. The cooling fuel flow is kept separate from the main fuel until the fuel is vaporized at the injector tip. The low mass flow, but intermittent high volumetric flow rate of the cooling flow, would result in slug flow if the vapor cooling flow were to be mixed with the main fuel. Slug flow resulting in pulsations of liquid and vapor would be very detrimental to turbine operation.
The fuel transfer passages for the cooling flow have conflicting design requirements. The passages must be sufficiently large in flow area to accommodate a wide variation in volumetric flow rate while being sufficiently small to maintain sufficient high fuel velocity to maintain a dispersed two-phase flow. The volumetric fuel flow rate of the cooling flow varies significantly as the heat load varies. Initially when the LPG flow is initiated the LPG valve can be 100°C or greater. At these conditions the LPG cooling flow would be mostly vapor at the low fuel pressure at which this injector is designed to operate (20–30 Bara). Under prolonged steady state operations on LPG the cooling flow will be mostly liquid, as the steady state heat load becomes small. The ratio of vapor to liquid in the cooling flow will also vary as a function of fuel temperature, fuel composition, engine combustor pressure, and fuel supply pressure.
The coolant passages were designed to have a relatively large flow area in order to accommodate high volumetric flow, when the cooling flow is mostly vapor, while also having relatively small distances between opposing walls in order to limit the size of the bubbles that can be formed. Thin passages with high volumes will only form small bubbles, compared to other passages such as tubes that have minimized wall surface area to flow area. Using thin flow passages for the cooling flow allows large cooling flow areas to accommodate a wide range in volumetric flow rates without resulting in the formation of large bubbles that would cause unstable combustion.
The bubbles that do form in the fuel injector are after the metering device and are limited to the separate cooling flow, which is less than 10% of the fuel flow. Engines in the field have been shown to accept this amount of two-phase flow in the fuel system without resulting in unstable combustion.
Fuel Vaporizer
The active cooling concept of the fuel metering device combined with the design of the fuel transfer passages has provided controlled fuel flow of the mostly liquid main flow and at times mostly vapor cooling flow to the injector tip near to the combustion zone. The fuel must now be injected in a spatially controlled manner into the combustion chamber.
Most conventional fuel injectors would use a pressure atomization or air spray device to accomplish this task.
However, two-phase flow makes the use of any device that creates a pressure drop after the fuel is metered problematic. Only one metering device can be used per single stream of flow and the inlet of this device must have liquid only in order to have consistent predictable flow rates. Others have attempted to address the above problems with liquid LPG injection in two ways.
One way is to use a pressure atomizer at the injector tip with no other fuel-metering device such as a valve. However, this approach requires high minimum fuel pressure to maintain liquid phase (typically 100 Bara). For example, well-insulated fuel injector circuits would require a minimum pressure for propane to be 18–20 Bara (reference Figure 7–68). The difference between the minimum fuel pressure and the lowest operational combustor pressure could be 8 Bara for typical industrial gas turbine engines. This combined with these engines needing a 4:1 fuel range between maximum load and load reject results in very high maximum fuel pressures. The pressure atomizer would therefore require about a 16:1 pressure ratio to accommodate a 4:1 mass flow ratio. For engines that have at least an 8 Bar difference between minimum combustor pressure and the saturation line pressure, the fuel pressure could therefore exceed 100 Bara.
Another way is by placing a variable area metering device, such as a valve, near an air spray atomization device at the tip. This reduces the maximum fuel pressure. The close proximity of these components also prevents two-phase flow from separating into liquid and vapor components by minimizing the time and volume available for separation. However, these devices are problematic because of the difficulties of placing tightly toleranced moving components such as a spool valve in regions of high thermal gradients.
The tri-fuel injector developed jointly by Alstom Power and Delavan has been designed to overcome the reported difficulties with LPG injection, described below.
The fuel-metering device is placed in the back of the injector (see Figure 7–70) to limit heat conduction to the valve, thus minimizing mechanical problems. The injector’s fuel transfer circuits, designed to keep the main and coolant flows separate, also allows the injector’s fuel vaporizer to be positioned close to the injector tip where there is sufficient heat and air for both vaporization and atomization processes.
For the fuel vaporizer, the initial conceptual design was to use an air blast type of prefilming atomizer. The three cooling circuit flows and the three main fuel flows are introduced into an annular vaporizer in an evenly spaced symmetrical pattern. The idea was to use air to spin the LPG fuel into a film where it could be atomized by additional air outside of the injector.
Using air to add momentum to the fuel and spin the LPG fuel into a thin film had two advantages: it induces no pressure drop into the fuel circuit and the heat from the hot air partly expands the fuel thus increasing its volume. Also keeping the existing dual fuel design of the pilot, main, water, and gas circuits meant that the LPG filmer had to be at a larger diameter (see Figure 7–70). This would make the production of a continuous film difficult in this application without somehow increasing the volumetric flow rate of the fuel. The idea of adding more hot air to increase the volume of the fuel in order to create a film therefore developed. The philosophy was therefore just to add hot air and vaporize as much of the fuel as possible and then treat LPG as a gas when injecting it into the combustion chamber.
Carbon formation in the vaporizer is not an issue as long as the temperature of vaporization at the combustion pressure is less than the temperature at which carbon will form. For most industrial gas turbine engines this stays true at least until the fuel contains mostly C8 and higher hydrocarbons. For this reason most naphthas can also be mixed internal to the fuel injector with hot air. As long as the fuel stays partly wet the temperature will stay low. This prevents auto-ignition and carbon formation from small fractions of C16 and higher hydrocarbons in naphtha.
Operating Philosophy
Turbine starting is on either diesel or natural gas fuels. Changeover from the starting fuel to LPG is conducted at part load condition. No direct LPG starting is permitted. During standard dual fuel running, the fuel injector tip components are continuously purged with turbine compressor discharge air.
During changeover to LPG, a thermocouple in intimate contact with the injector body in the valve region measures the local temperature and inhibits, via the turbine control system, the main flow of LPG until the temperature is below 45°C to ensure liquid flow.
After changing over from LPG to gas or diesel fuels, the LPG fuel lines from the shut-off valve to the injectors are nitrogen purged for about 20 seconds to remove any residual fuel.
Commercial LPG Operation
General Operation
The described tri-fuel system entered commercial operation in March 1999 on two Tornado gas turbines (units 1 and 2), both 6.45 MWe rating. Prototype 2 tri-fuel injector became the production standard. The lead engine has accumulated about 1029 hours, while the second has about 361 hours on LPG. Most of the above LPG running has occurred during winter, between November 1999 and March 2000. Including natural gas and some diesel operation total running has now exceeded about 8000 hours.
Fuel Pressures
The reported winter LPG running presented the coldest ambient conditions and therefore the highest power conditions. This operation resulted in the highest LPG fuel pumping pressures. Table 7–22 shows that fuel pumping pressures are within the original design intent (30 Bara).
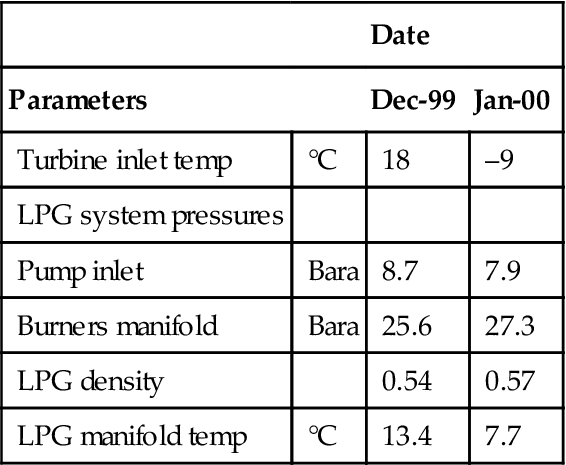
Combustor Exit Temperature Spread
Figure 7–71 shows comparisons of combustor exit temperature spread between natural gas and LPG fuels. This is measured by 16 off thermocouples positioned circumferentially in the inter duct between compressor and power turbines. This spread level has shown no deterioration for LPG running, confirming that all eight injector LPG valves are operating consistently.
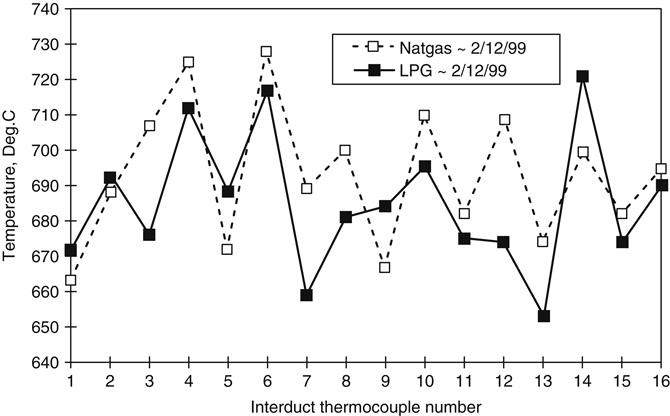
Transient Response
The tri-fuel engines can change over to and from LPG from a reasonable low load, say 1 MW, up to full load with complete confidence, although changeovers to LPG at FSNL have been locked out because of uncontrolled speed rises during the LPG cooling cycle. Changeovers from LPG at FSNL are possible but an uncontrolled speed rise (approximately 250 rpm) does occur during the 20-second nitrogen purge of the LPG manifold. No further work was conducted to optimize low load changeover, as it was not essential. Unit 2 was proven to LPG load shed from a variety of loads including full load; however, Unit 1 could only load shed from 2 MWe. The load-shed abilities are therefore not consistent and further work is required. It may be necessary to further optimize the LPG valves port shape to improve load shed. There are no issues with standard dual fuel operation.
Combustion Dynamics
During initial commissioning in March 1999, a combustion system dynamics survey was conducted for all fuels. An increased level of combustor dynamics, with a center frequency of about 100 Hz, was measured for LPG operation relative to both natural gas and diesel running. The amplitude of this dynamic increased in magnitude as the load increased; although maximum levels never exceeded 300 mpsi RMS. As these dynamics were within levels of experience (< 500 mpsi RMS), no further action was taken to reduce their levels.
Later in November 1999, a low frequency audible rumble in the exhaust became apparent on both turbines when running on LPG. There was no audible exhaust rumble for diesel and natural gas fuels. Combustion system dynamics showed no increase since the initial commissioning. The exhaust noise was reported to change with ambient conditions. It is probable that the exhaust noise is generated by the higher dynamic levels measured for LPG running, which only becomes audible at certain ambient conditions.
Naphtha Development Testing
The tri-fuel injector design has just recently been refined to reduce the dynamics seen during LPG operation, and to make the injector more suitable for naphtha operation. The latter is to support commercial operation of the Typhoon engine on naphtha.
The following modifications have been made to the fuel vaporizer in order to make it more like an air spray device. More air has been added to the injector’s LPG vaporizer circuit. The internal air swirler geometry has been further optimized. The maximum fuel pressure has been increased from 30–40 Bara to account for increased pressure requirements of the proposed naphtha fuel system.
High-pressure rig testing of a naphtha prototype injector has recently been conducted on unleaded gasoline to simulate naphtha. An extreme over test has also been conducted using No. 2 diesel. LPG testing will be conducted in the near future.
Figure 7–72 shows a comparison of smoke emission for unleaded gasoline and No. 2 Diesel through the injector’s LPG/naphtha circuit (tertiary). The results for unleaded gasoline (1–2 Bacharach) are slightly lower than those necessary to further optimize the LPG valves port shape to improve load shed. Table 7–23 summarizes corresponding full and no load emissions levels as well as OTDF measurements. There are no issues with standard dual fuel operation.
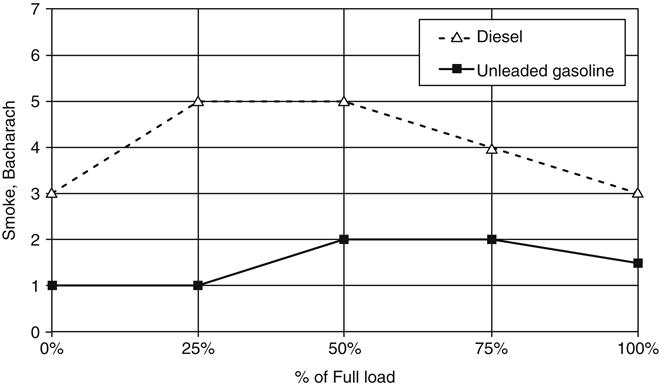
TABLE 7–23
Naphtha Prototype Injector—Emissions Summary
| NOx, ppmv | CO, ppmv | UHC, ppmv | OTDF, % | |
| Tertiary (gasoline) | 316 | 1.2 (96) | 1.4 (4.1) | 19.5 |
| Tertiary (diesel) | 312 | 0.72 (571) | 2.5 (22) | 15.5 |
| P&M (diesel) | 320 | 0.6 (368) | 0.6 (15) | 14.9 |
| Natural gas | 192 | 0.6 (405) | 0.7 (61) | 15.1 |
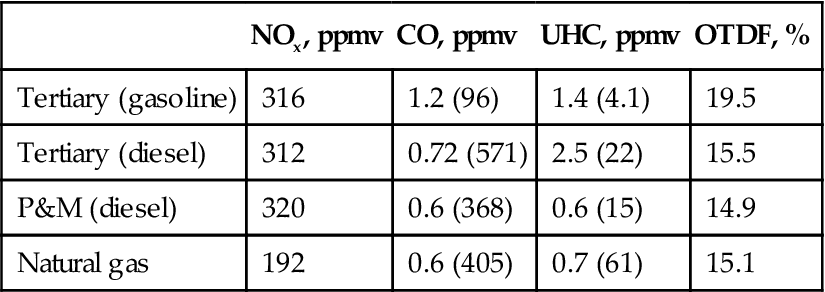
Notes: P&M denote pilot and main.
(Source: Alstom Power.)
Similar full load NOx emissions were measured for tertiary diesel and gasoline operation. This suggests similar mixing degrees for both fuels. Also full load measurements of UHC and CO are negligible indicating high levels of full load combustion efficiency for both fuels. At no load, gasoline results in lower part load CO and UHC emissions relative to No. 2 diesel. This indicates higher part load combustion efficiencies for the gasoline case.
Preliminary engine testing at Lincoln has identified a probable cure to the dynamics problem seen on LPG during commercial operation. Distillate fuel testing through the injector’s LPG circuit has generated a similar dynamics phenomenon to that seen during LPG operation. Similar engine testing of the naphtha prototype injector, with the air spray device replacing vaporizer, has shown negligible dynamics levels. It is therefore probable that the revised injector standard used for naphtha will reduce the dynamics seen on LPG.
Case Study 4: Multi-Fuel Concept of the Siemens 3A-Gas Turbine Series15
To provide maximum fuel flexibility, Siemens has developed a liquid-fuel supply system for its 3A-Series gas turbines (Table 7–24), which in addition to customary distillate can also accommodate special fuels such as naphtha and condensates, and which also enables fuel changeover during gas turbine operation. The high vapor pressure and correspondingly low flash point of naphtha and condensates necessitate a complex fuel system safety concept as well as special flushing procedures when the gas turbine is started up and shut down. The addition of water to the fuel has been shown to be an efficient method of reducing NOx emissions. This addition of water, coupled with the highly variable fuel density, places increased demands on the gas turbine control system. Moreover, it is possible to switch from natural-gas operation to fuel-oil operation and back again when the turbine is operated in the output range near base load.
TABLE 7–24
Siemens V-Series Gas Turbines with Multi-Fuel Systems
| Reference | Paguthan | Faridabad | Santa Rita | San Lorenzo |
| Configuration | One CC | One CC | Four CC | Two CC |
| 3.V94.2 | 2.V94.2 | 1S.V84.3A | 1S.V84.3A | |
| Commissioning | 9/97 | 6/99 | 12/99 | 06/02 |
| Hours of operation | >18,000 | >2,000 | >11,500 | – |
| (June 00) | (June 00) | (Jan. 01) | ||
| Natural gas | X | X | (X) | X |
| Naphtha | X | X | X | X |
| Condensates | X | X | ||
| Extra-light fuel oil | A | A | X, A | A |
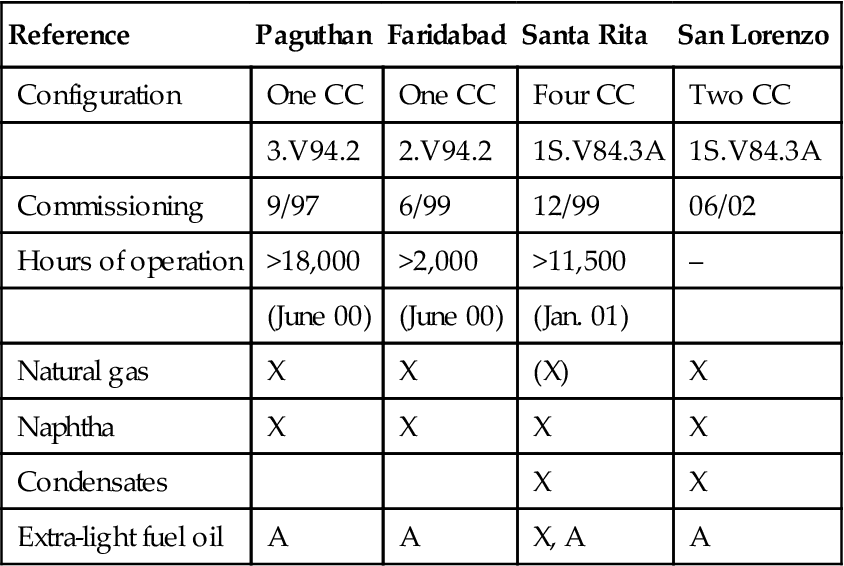
CC: Combined-cycle.
X: primary fuel; (X): planned for mid-2002; A: Fuel used for startup/shutdown.
(Source: Siemens.)
Liquid Multi-Fuel System
In the following, particular attention is given to the most recent innovations concerning the special liquid fuels naphtha and condensates, which are becoming a more attractive regional solution (e.g., in Southeast Asia and India) as a result of the increased cost of commercially available fuel oil on the world market.
Fuels
A large portion of the commercially available naphtha and fuel oil is derived from crude oil by atmospheric distillation. In contrast to naphtha and fuel oil, the term “condensates” does not apply to a specific fuel, but is rather used as a synonym for hydrocarbons that exist in a liquid state at standard temperature and pressure, and that occur as significant byproducts of the natural gas extraction process. Specific properties (Table 7–25) and their validation are of central importance in characterizing liquid fuels. Characteristic of condensates and naphtha are a high calorific value in excess of 42 MJ/kg, low density, low viscosity, a low flash point, and a comparatively high vapor pressure.
TABLE 7–25
Specific Properties of Naphtha, Condensates, and Fuel Oil
| Fuel Type | Naphtha | Condensates | Distillate Fuel Oil No. 2-GT |
| LHV in MJ/kg∗ | >42 | >42 | >42 |
| 43.980 | 43.590 | 42 | |
| Density in kg/m3 | 650–775 | 650–850 | 820–880 |
| 720 | 770 | 830 | |
| Flash point in °C | ∗∗∗ | >55 | |
| <0 | n.a. | >55 | |
| Vapor pressure in bar at 37.7°C | <0.9 | <0.9 | <0.003 |
| Mercaptanes in ppm | — | 4 | — |
| Sulfur in % by wt. | <0.2 | <0.5 | <0.2 |
| <0.15 | 0.05 | <0.2 |
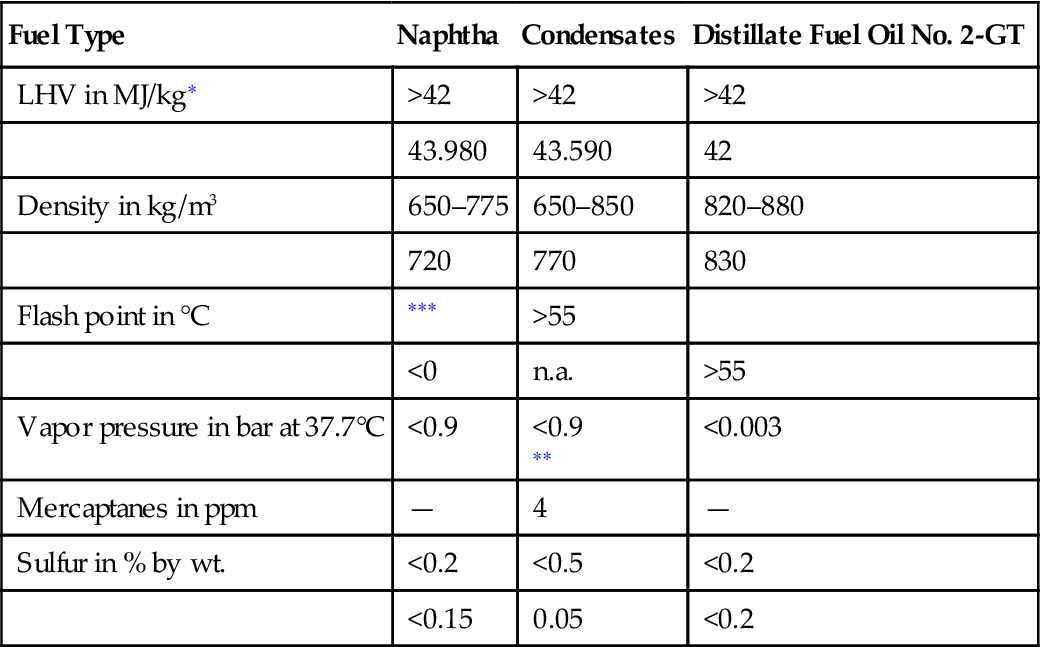
Note: The auto-ignition temperature is approx. 232–277°C, for comparison: appr. 600°C for methane.
∗Lower heating value, in the upper line the specified value and in the bottom line the tested value is listed.
∗∗Always to be taken as lower than ambient or operating temperature.
∗∗∗Specified by the fuel vendor (Santa Rita mercaptans (RSH) 350 ppm).
(Source: Siemens.)
System Description
Fuel Delivery System at the Santa Rita Plant
The primary fuel (condensates, naphtha, and fuel oil) is delivered by tanker to the jetty. Following verification of fuel quality, the fuel is pumped into the three discharge tanks. The fuel treatment system draws fuel from these tanks, processes it, and feeds it into one of the two-day tanks. Two lines, each with redundant pumps, run from the day tanks to the two combined-cycle blocks (two combined-cycle units = one block). The system design allows a different fuel to be used for each block. Both blocks are joined via a common return line to the day tanks.
The startup fuel (distillate or fuel oil) is trucked to the site, and is treated the same way as the primary fuel. The startup system incorporates only one line with redundant pumps, which means that four gas turbines must be started up sequentially.
Gas-Turbine Liquid Fuel System
Whereas the fuel delivery system is designed around those characteristics specific to the power plant, for the gas turbine standard modular skids are used for natural gas and liquid fuels, so that use of a particular fuel is independent of the existing infrastructure.
The annular combustion chamber of Siemens 3A-Series gas turbines is equipped with 24 identical hybrid burners for natural gas and liquid fuels. Each hybrid burner in turn has a diffusion burner and a premix burner for liquid-fuel operation, as well as a diffusion burner, a premix burner and a pilot burner for operation using natural gas. In addition, a separate lance can be used to inject water directly into the flames to reduce NOx formation.
The three natural-gas burners and the premix burner for liquid fuels have controlled feeds, i.e., the entire quantity of fuel supplied by the feed control valve in each case is injected into the combustion chamber. The liquid-fuel diffusion burner has a controlled feed and return, which allows control of not only the quantity of injected fuel but also the feed quantity and injection pressure, and thus permits control of the directly linked atomization quality. The liquid-fuel diffusion burner can operate in the load range from startup to base load (approx. 12 kg/s fuel), without the addition of water. In power operation the return mass flow from the diffusion burners is directly fed to the injection pump again (recirculation).
Compared to water injection via the lances, the direct mixing of water with the fuel and the operation of the premix burner achieve a greater reduction in NOx emissions using the same quantity of water. In the first development phase, as represented by the Santa Rita plant, water is admixed via a jet mixer upstream of the injection pump (Figure 7–73). Moderate water pressure is required, allowing use of the water skid originally designed to be used with lance injection. The jet mixer increases the feed pressure of the liquid fuel/water mixture upstream of the injection pump by up to 10 bar, which also allows correspondingly greater injection pressures to be attained at the burners.
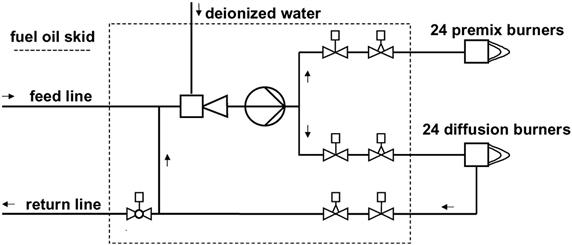
The density and viscosity of the liquid fuel/water mixture vary according to the mixture ratio and the composition of the fuel, which places heavy demands on the injection pump. The mixture ratio is defined as the ratio of the water mass flow to the fuel mass flow. The gas turbines at the Santa Rita plant have been successfully tested with mixture ratio over 100%. A major milestone in the development of the multi-fuel gas turbine was therefore the replacement of screw pumps with centrifugal pumps, as the latter are well suited to low-viscosity liquids (<1 mm2/s for naphtha and condensates) and also have a characteristic favorable to the combined supply of diffusion and premix burners. The zero delivery head of the centrifugal pumps is approx. 1600 m.
Because the water is added prior to branching the mixture to the diffusion and premix feed lines (see Figure 7–73), both have already been implemented for the newest gas turbines via a standard dual-fuel system, water is added separately to the diffusion and premix feed lines, so that the mixture ratio can be varied independently for the two burners.
In gas operation, a switch off/switch on of burners, e.g., at changeover from diffusion to premix operation and back, can be implemented rather easily. No cooling or purging procedures are required. In liquid-fuel operation special precautions must be taken during startup and shutdown of the gas turbine, at changeover to liquid fuel premix operation and when changing over from gas to liquid fuel operation and back. If a liquid-fuel burner is not in operation, there is a risk of circulation flow among the individual burners as a result of slight local pressure differences in the combustion chamber, which would soon lead to overheating or the formation of coke at the nozzles. To prevent the ingress of hot gas when the liquid fuel burners are shut down, water is used to flush the residual fuel from the lines and nozzles, which are then supplied with cooled compressor outlet air, so-called seal air. Before a liquid fuel burner starts to operate, the empty sections of the line are filled with water. This not only allows the atomization pressure to build up rapidly, but also cools the nozzles so that the fuel cannot ignite prematurely.
The safety concept has given rise to the liquid multi-fuel requirement that all liquid fuel lines which are pressurized during startup of the gas turbine (including startup using natural gas) must not contain hazardous fuels such as naphtha and condensates, as these fuels would pose a significant risk to the gas turbine, such as in the event of a faulted start. For this reason Siemens multi-fuel gas turbines generally use fuel oil for startup and shutdown. Moreover, use of fuel oil means that in the event of a leak, which in many cases is not evident until there is pressure in the line, the escaping fuel is initially the much less hazardous startup fuel. Changeover to the primary operating fuel (and back) following gas turbine synchronization takes place within the fuel delivery system, which means that no noticeable changes occur in the operation of the gas turbine. In the event of a gas turbine trip, the lines downstream of the stop valves are completely evacuated and partially refilled with water. The liquid-fuel skid is then flushed.
Operating Experience
The gas turbines at the Santa Rita plant have been successfully tested using naphtha, condensates and fuel oil. When water is added to the fuel in a ratio of 1:1, NOx emissions are well under the World Bank standard of 72 ppm.
In the part-load range the characteristics of the different fuels (primarily the density) led to variable turbine operation, which made it necessary to modify the structure of the gas turbine controller such that the operating characteristic of the gas turbine can be adapted to the fuel in use.
Base load is reached without restriction regardless of the fuel used.
Acceptance measurements were taken in Block 1 in May 2000, using condensates as the fuel, and in August 2000 in Block 2, with distillate oil. It should be emphasized that the expected gas turbine output and efficiency values were either met or exceeded.
Gas Turbine Controller
The gas turbine controller must meet unusually demanding requirements. It must be able to accommodate rapid load changes, e.g., when participating in frequency stabilization or in the event of load rejection to the auxiliary power level, and must also keep output fluctuations as low as possible when cutting a burner type in or out. To meet both of these requirements, it must be possible to quickly and very precisely vary the flow of fuel to each burner.
The flow of fuel to a particular burner is varied by changing the position of the associated control valve. For this reason it was particularly important to map the relationship between valve lift and fuel quantity in the controller:
• The valve characteristic (CV value vs. valve lift) of all control valves is stored in the controller, and checked and modified if necessary during the commissioning process.
• In the natural-gas system the pressure and temperature upstream of the control valves are measured, and used as input variables by the controller in calculating the correct valve lift. If there should be a sudden drop in the natural-gas supply pressure, for example, the natural-gas control valves are directly opened by an amount that is proportional to the change in pressure, thereby preventing a sudden drop in output.
• Similarly, the pressure upstream of the control valves in the liquid-fuel system is measured and evaluated by the controller, making on-line pump changeover possible over the entire operating range of the turbine in the case of systems with redundant injection pumps, for example.
• Because the density of the liquid fuel is highly variable, an algorithm was developed specifically for use in the multi-fuel system which determines the fuel density at any given time based on the pump characteristic and measurement of the pump outlet pressure.
• In adding water directly into the liquid fuel, the accumulator effect of the piping was taken into consideration. To increase volumetric flow of the water while holding turbine output constant, for example, the volumetric flow of the fuel must be decreased by the same amount until the new mixture is actually present at the burner nozzles. In this regard a path model consisting of dead time and delay modules was developed, which is optimized during commissioning.
• A fuel balancing system that acts on all active burners and is subordinate to the load controller ensures that when a burner is cut in or out, a corresponding quantity of fuel is added or subtracted at the main burner in each case. Appropriate dead time and delay modules take the effect of filling fuel lines into account.
Fuel Changeover
Quick fuel changeover with minimum gas-turbine load reduction is particularly important for operators who wish to use liquid fuels primarily as a backup source of energy if the supply of natural gas should fail. The on-line fuel changeover system, which switches between natural-gas premix operation and fuel-oil diffusion operation, was developed for use with 3A-Series gas turbines in the upper load range to satisfy this requirement.
For safety reasons, in the multi-fuel system startup fuel (fuel oil) is always used when changing over from natural-gas to liquid-fuel operation. The process is thus identical to fuel changeover in the standard dual-fuel system (natural gas and fuel oil).
On the natural-gas side, the fuel changeover process is in principle the same as the changeover from diffusion operation to premix operation, with the exception that the diffusion flame is a fuel-oil flame. On the liquid-fuel side, the fuel-oil diffusion burner is first operated as a feed burner during the ignition process (when changing over from natural gas to fuel oil), which avoids the danger posed by hot gas entering the initially unpressurized return line. When the fuel-oil burner is switched off (when changing over from fuel oil to natural gas), the fuel oil remaining in the lines and the burner is flushed out using water, and the water and fuel oil are removed via the return line. Thus the system can be effectively flushed using a high mass flow without resulting in significant load fluctuations.
Fuel changeover takes approximately two minutes, and has been proven successful at the Berlin test facility using a V84.3A gas turbine.
Case Study 5: Use of Blast Furnace Gas to Fuel 300 MW CC Plant16
The project has the following features:
1. It is the world's largest class for a BFG firing CCPP and was the first order in China.
2. The first design cooperation for power generation plant with the design and research institute of an iron and steel company in China.
3. The first installation of a power generation plant in an extremely cold area (the minimum monthly average temperature is less than −15°C).
4. Collaborative plant adopted Chinese-made products as related equipment for the bottoming cycle
Figure 7–74 shows the scope of supply of this plant.
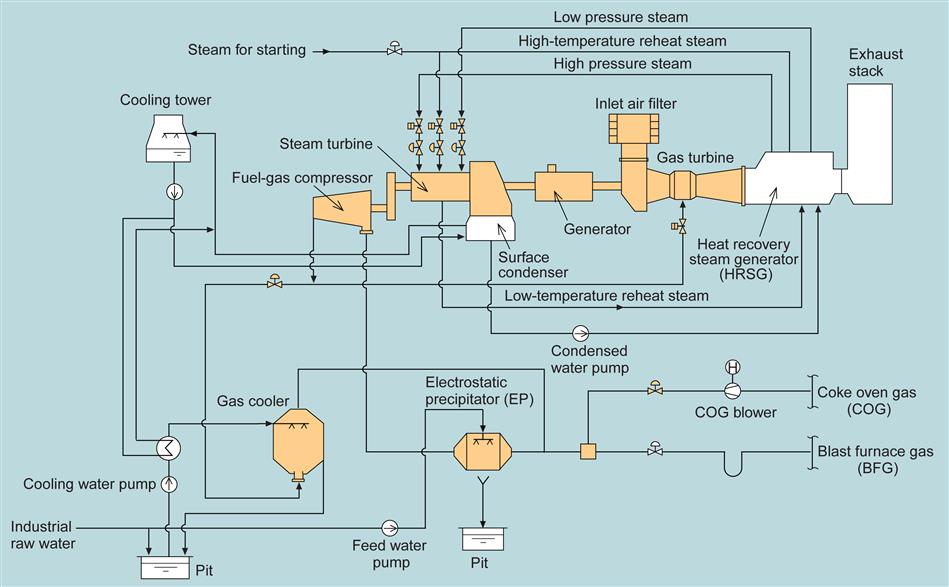
Features of the Plant
The features of the plant are as follows:
1. Adoption of combined cycle power plant equipped with the most advanced, high efficiency blast furnace gas firing gas turbine model M701S (F).
2. Adoption of a gas turbine inlet air heater, considering the startup and load operation during extremely low atmospheric temperatures.
3. Realization of total integrated plant control including customer supplied equipment such as HRSG.
4. Adoption of monitoring and control graphic screens written in Chinese for the plant control system.
Figures 7–75 and 7–76 show the turbine floor layout and a longitudinal sectional drawing of the total assembly.
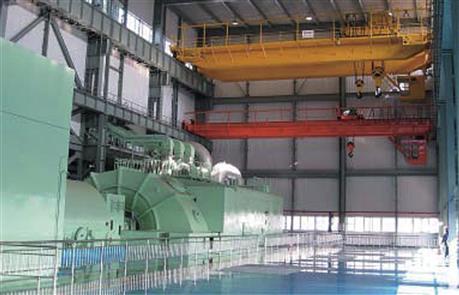
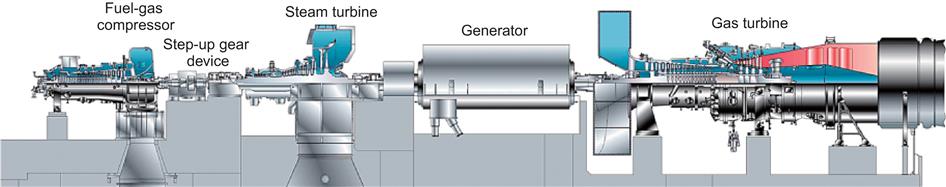
Main Specifications of Major Equipment
Table 7–26 shows the main specifications of the major equipment including the customer supplied HRSG. See Figure 7–77 for the plant output characteristics that show that the power plant is able to generate a maximum output of 300 MW at an ambient temperature of 15°C or below.
TABLE 7–26
Main Specifications of Major Equipment
| Major Equipment | Particular | Specifications |
| Power generation facility | Model output | Single-shaft type combined cycle power plant 300 MW |
| Gas turbine | Model output Turbine inlet gas temperature Rotational speed |
Open cycle single-shaft type M701S(F) (MHI) 183.0 MW 1300°C class 3000 rpm |
| Heat recovery steam generator (HRSG) | Model steam flow rate | Triple-pressure natural-circulation reheat boiler (China Hangzhou boiler) 586.4 tons/hr Details: High pressure 239.9 tons/hr Medium pressure 282.2 tons/hr Low pressure 46.3 tons/hr |
| Steam turbine | Model Output steam pressure/temperature Rotational speed |
Single-casing reheat mixed-pressure condensing type SRT-30.5” (MHI) 117.0 MW High pressure 10.2 MPa (a)/538°C Medium pressure 2.95 MPa (a)/538°C 245°C/245°C 3000 rpm |
| Generator | Model Capacity Cooling system Rotational speed |
Horizontal-shaft tubular rotary field type (Mitsubishi Electric Corporation) 340,000 kVA Hydrogen gas cooled 3000 rpm |
| Fuel-gas compressor | Model Rotational speed |
Single-casing axial flow type (MHI) 5025 rpm |
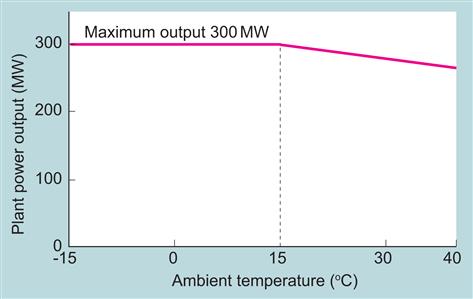
Measures against Low Ambient Temperatures
A gas turbine consumes a great deal of air as the driving source. While a lower ambient temperature helps increase the power output, too low a temperature causes the following problems:
1. Decreasing the compressor surge margin due to increasing thrust force and pressure ratio limits the maximum power output.
2. Combustion pressure fluctuations create an unstable combustion zone during startup and acceleration.
To cope with these problems, an inlet air heater was installed to heat up the gas turbine inlet air in cold weather. As the steam source for heating, auxiliary steam is used during startup and acceleration while low-pressure steam is extracted from the HRSG during load operations. The used steam is reclaimed by the surface condenser as a condensate to reduce the amount of waste water as an environmental measure.
Figure 7–78 is schematic of the inlet air heating system.
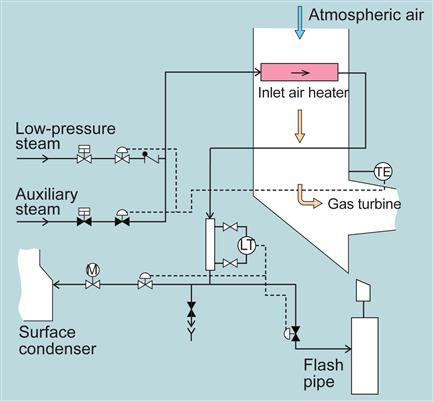
Automatic Control System
Figure 7–79 shows the control system configuration. MHI supplied the total plant control system which has the functions of automatic control, operation, and monitoring of all the equipment directly related to power generation including the customer supplied equipment such as HRSG and boiler feed water pump.
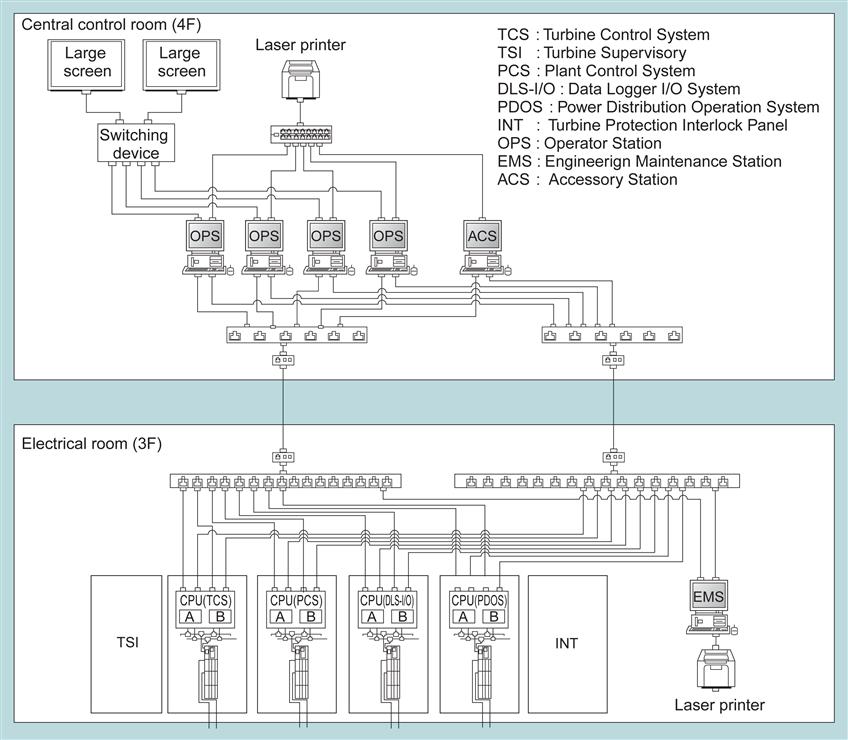
(1) Startup Characteristics
This power plant adopts a steam turbine starting system. After reaching the rated speed, it switches from the existing steam to HRSG steam once the conditions of the HRSG steam become acceptable for the steam turbine. The plant then increases its load automatically up to the minimum operational load of 150 MW. Once reaching 150 MW, the load can be changed between 150 and 300 MW depending on the power demand. The power plant also shuts down automatically. During load down, the cooling down process is designed to make the mismatch between the steam and the steam turbine metal temperature small so that the time to the next hot start is shortened. The expected time for starting (from ignition up to full-load operation) is approximately 90 minutes for a hot start, 150 minutes for a warm start and 200 minutes for a cold start.
(2) Plant Performance
Table 7–27 shows the actually measured performance. The plant output and plant thermal efficiency after compensation to the standard conditions (ambient temperature at 15°C and LHV base) sufficiently satisfy the planned values. The plant thermal efficiency reaches 51.2% compared to the planned 48.5%, and achieves the highest level in the world for BFG firing CCPPs.
(3) Environmental Characteristics
By effectively transducing the low calorific blast furnace gas to electric power, this power plant contributes greatly to environmental preservation as follows. Firstly, this is a combined cycle power plant that effectively utilizes the blast furnace gas instead of the coal fired thermal power plants popular in China. It is estimated that the plant emits approximately 1,900,000 tons less CO2 a year (assumed operation of 7000 hours per year) than that emitted by burning coal in a coal-fired thermal power plant of the same output. Secondly, although the environmental characteristics depend significantly on the composition of the blast furnace gas, as it contains nitride and sulfur compounds, its combustion produces less thermal NOx than burning natural gas because of its low calorific value. Thus, this plant indicates the significantly low NOx value of 15 ppm (15% O2 base, without a de-NOx system).
Operation Records
Table 7–28 shows the availability of the plant for about five months from May 2007, when the plant was taken over, to the end of September. While the plant availability depended on the scheduled shutdown due to maintenance of the blast furnace shortly after taking over the plant we experienced the degradation of plant availability because of initial failures and other incidents. After that, the plant reliability improved gradually, finally reaching 100% in September 2007.
Case Study 6: Biodiesel as an Alternative Fuel in Siemens Dle Combustors - Atmospheric and High Pressure Rig Testing17
Atmospheric and high-pressure rig tests were conducted to investigate the feasibility of using biodiesel as an alternative fuel to power industrial gas turbines in one of the world’s leading Dry Low Emissions (DLE) combustion systems, the SGT-100. At the same conditions, tests were also carried out for mineral diesel to provide reference information to evaluate biodiesel as an alternative fuel.
Siemens Industrial Turbomachinery Ltd. (Lincoln, UK) was involved in the recently finished European project AFTUR (Alternative Fuels for Industrial Gas Turbines) to investigate the feasibility of using biodiesel as an alternative fuel to power industrial gas turbines. Siemens conducted both atmospheric and high-pressure rig tests in the SGT-100 using one of the world’s leading DLE combustion systems. Reference data were obtained by carrying out the same tests with mineral diesel. In an atmospheric pressure rig, extensive ignition tests were conducted to investigate engine start reliability, lean ignition and extinction limits to establish biodiesel’s operability in gas turbines. In high-pressure rig testing, emissions and combustion dynamics were investigated. The biodiesel selected for this study was supplied by C Zero Energy Ltd., produced from recycled cooking oil and was consequently derived from a mixture of feedstocks. All tests were with the standard DLE SGT-100 burner, combustor and transition duct and 100% biodiesel (BD100) was used. The reference mineral diesel was BS 2869 Class A2/D.
Siemens DLE Combustion System
Siemens Industrial Turbomachinery Ltd. (SIT Lincoln, UK) is the manufacturer of small industrial gas turbines from the SGT-100 at ca. 5 MW to the SGT-400 at 13.4 MW, which have now accumulated more than 3 million hours of experience. The SGT-300 and SGT-400 are offered commercially for less than 10 ppmv NOx (@15% O2) emission for certain markets, for example the SGT-300 operating at the University of New Hampshire, USA. The dual fuel DLE combustion system is designed as a reverse-flow tubo-annular type as shown in Figure 7–80. The combustor consists of three main sections: (1) the pilot burner, which houses the pilot fuel galleries and injectors for both gaseous and liquid fuel; (2) the main burner, which houses the main air swirler and main gas and liquid fuel injection systems; and (3) the combustor, which includes the prechamber and is of a double skin construction and is cooled through impingement cooling. Downstream of the combustor, a transition duct is used to condition the flow from the circular combustor exit to a sector of the turbine entry annulus. In order to cover all the power range, rather than having a single combustor design and applying different numbers of combustors to each engine type, the combustors have been scaled. Figure 7–81 shows the DLE combustor family. The SGT-100, 300, and 400 have 6 combustors per engine and the SGT-200 has 8.
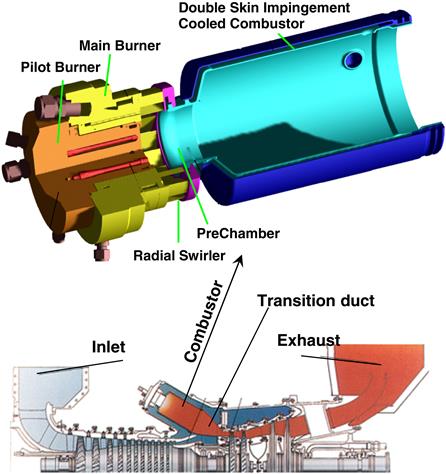
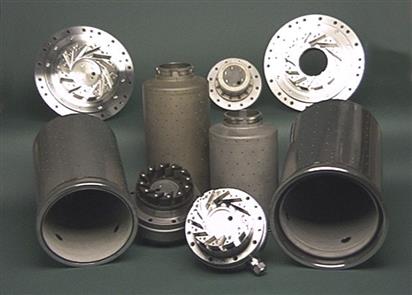
A schematic of the combustion concept is shown in Figure 7–82. The main combustion air enters through a single radial swirler at the head of the combustor. The flow then turns through a right angle into the prechamber followed by a sudden expansion into the combustion chamber.
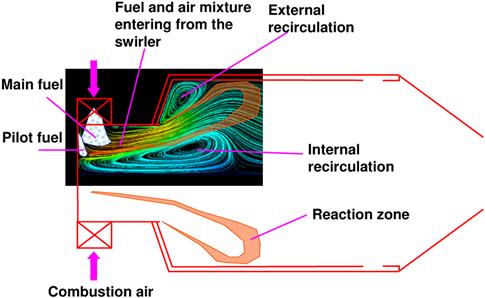
The swirl number is sufficiently high to induce a vortex breakdown reverse flow zone along the axis. This is termed the internal reverse flow zone. In the concept, this reverse flow zone remains attached to the surface of the pilot burner, thereby establishing a firm aerodynamic base for flame stabilization. In the wake of the sudden expansion, an external reverse flow zone is established. The flame is stabilized in the shear layers around the internal and external reverse flow zones.
The fuel, either gas or liquid, is introduced in two stages as shown in Figure 7–83: the main, which results in a high degree of premixedness and hence low NOx emissions, and the pilot, which is steadily increased as the load demand decreases in order to ensure flame stability. The pilot is arranged such that as the pilot fuel split increases, the fuel is biased towards the axis of the combustor.
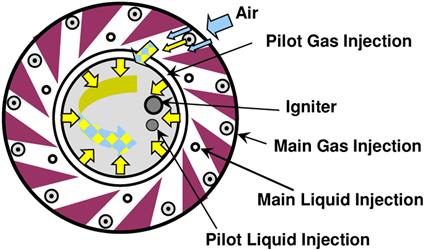
Capability of the DLE System for Fuel Flexibility
Siemens has a continuous policy of expanding its fuels capability and as well as the above-mentioned DLE combustion system, Siemens also has conventional combustion systems which can burn various fuels in the Wobbe index range from 4–70 MJ/m3.
Conclusions
Extensive ignition, emissions and combustion dynamics testing of biodiesel on standard DLE SGT-100 combustion hardware has been conducted to investigate the feasibility of using biodiesel as a fuel to power industrial gas turbines.
In ignition testing, two series of tests were performed to identify key properties of the proposed fuel. The first set of tests identified the likelihood of the engine lighting based on the measured probability of the ignition of a single combustor.
This demonstrated that a high likelihood of ignition would be possible depending on the choice of air assist pressure. The second series of tests investigated the lean ignition and extinction limits at various air temperatures. This showed that the ignition limit was different to that measured for mineral diesel, with the biodiesel being easier to ignite at high air mass flow rates and harder at lower flow rates. It was also demonstrated that air temperature did not have significant impact on the lean ignition limit. It was further shown that the ignition window for the SGT-100 lay well within the predicted curves for the lean ignition limit and therefore that good ignition should be possible. The lean extinction limits were found to be very similar to the ignition limits.
Emissions and combustion dynamics were measured in a high-pressure test rig. Performance of the burner on biodiesel was mapped by variation in operating conditions such as the air inlet pressure, temperature, the combustor pressure drop and flame temperature. The results were compared with those of diesel at the same conditions. For all the operating conditions tested, biodiesel had lower NOx emission than diesel. For biodiesel at an air inlet pressure of 14 bar, there was a strong link between NOx and the combustor pressure drop, where the NOx level was reduced as the combustor pressure drop was increased. It was not the case for biodiesel at 9 bar and for mineral diesel at all pressures investigated.
However, after FBN correction, comparable NOx emissions were obtained, although diesel showed slightly higher NOx emission than biodiesel at 9 bar inlet pressure.
Analysis of the high-pressure rig testing results showed that for biodiesel at low flame temperature and low air inlet pressure, a high degree of premixing was achieved, so NOx level was independent of inlet pressure and combustor pressure drop. At high pressure and high flame temperature, the optimal level of mixing could not be achieved due to the amount of fuel supplied. Where mixing is not optimal the thermal NOx formation is higher and dependent on inlet pressure and combustor pressure drop. However, for mineral diesel, good premixing was achieved at all pressures investigated and little dependence on inlet pressure and combustor pressure drop was observed.
At lower flame temperature, biodiesel had a significantly higher level of CO than diesel, particularly at a lower inlet pressure of 9 bar. For both fuels, the combustor pressure drop had apparent influence on CO at lower flame temperature with CO level decreasing with the combustor pressure drop decrease, and this influence diminished as flame temperature was increased. Both fuels had comparable levels of UHC emission at higher inlet pressure and biodiesel had slightly higher UHC emissions at lower inlet pressure.
For combustion dynamics, both fuels had comparable frequencies, but biodiesel had lower rms dynamic pressures at lower flame temperatures and higher when flame temperatures exceeded full load value.
Fuel droplet sizes were calculated and biodiesel had bigger droplet size, particularly at lower pressure, lower flame temperature and lower combustor pressure drop. The dominant contribution of big droplet size for biodiesel came from its much higher viscosity.