
Training and Education
Abstract
With the gas turbine developing at the rate that it does, education and teaching methods struggle to keep pace. This chapter provides specific examples and case studies of training and education in both the industrial and academic worlds. All cases are detailed with regard to program structure and content. However, in the hands of creative in-house trainers in industry or professors, they could suggest potential for creating one’s own tailor-made program.
Keywords
Industry training; education; academia training programs
“I was gratified to be able to answer promptly. I said I don’t know.”
—Mark Twain
With1 the gas turbine developing at the rate that it does, education and teaching methods struggle to keep pace. This chapter provides specific examples and case studies of training and education in both the industrial and academic worlds. All cases are detailed with regard to program structure and content. However, in the hands of creative in-house trainers in industry or professors, they could suggest potential for creating one’s own tailor-made program.
Industry Training
All OEMs offer some kind of training to their customers. These presentations can vary from “sales-type” commercial overviews to those that are considerably more comprehensive. The latter are generally given to customers who bought the OEM’s equipment, and the training is included in the price, in other words, “free.”
In addition to theoretical courses, the OEMs offer practical training at the customer’s plant or in their own plants, with a very “hands-on” approach. This type of training is generally given to key mechanics, operators, and service crew.
Independent firms, which frequently are owned and staffed by ex-OEM senior people, offer similar training. They point out that they offer a more objective perspective than an OEM might.
The job titles given to engineers in field operations or field operations consulting are varied: Field service representative, field service engineer, applications engineer, field engineer, or simply OEM’s rep are common. Project application engineers is the term used by the OEM authors of Case 1. In some cases, that engineer is one that the OEM dispatches to solve field problems that an end user may have. In others, the engineer may be one who follows an individual project within the OEM’s walls, through all phases, including but not limited to initial customer specification, manufacture, testing, commissioning, and even optimization (also called streamlining or debottlenecking). These individuals are well equipped to then also serve the OEM as field troubleshooters.
Depending on the corporate culture (OEM or otherwise) involved, a successful field service or project applications engineer may be moved to “technical sales” or marketing. In certain corporations, the senior officers have been promoted from these “nuts and bolts” beginnings.
The following extracts were written by senior staff within an OEM’s organization. This OEM makes small- and medium-sized gas turbines, as well as associated packages for mechanical drive and power generation service. However, the template they provide is a sound one for all gas turbine OEMs and, in fact, all OEMs.
Case Study 1: OEM Project Application Engineers Training2
Project application engineers (PAE) are a critical link between the customer and the OEM. His or her knowledge of both internal capabilities and the customer’s business make the PAE an important contributor in developing new projects. Despite the fact that this position can be an important and satisfying career path for engineers, its existence is widely unknown among engineering graduates. Therefore, a description of the tasks, duties, and challenges for project application engineers is provided.
We (i.e., Solar Turbines) cover the training and education of application engineers for packaged industrial gas turbines. However, most of the concepts are applicable to application engineers for most engineered products.
Packaged industrial gas turbines, especially in the oil and gas industry, consist of pre-engineered and custom-engineered components. The gas turbine and power turbine themselves are usually standardized products. The package components may, depending on the manufacturer’s philosophy and the project requirements, be either mostly pre-engineered with some customized components or mostly custom designed. The driven equipment may be standardized (such as a generator), or as for most compressors and pumps, either customized using pre-engineered components or entirely custom designed.
The Job Description
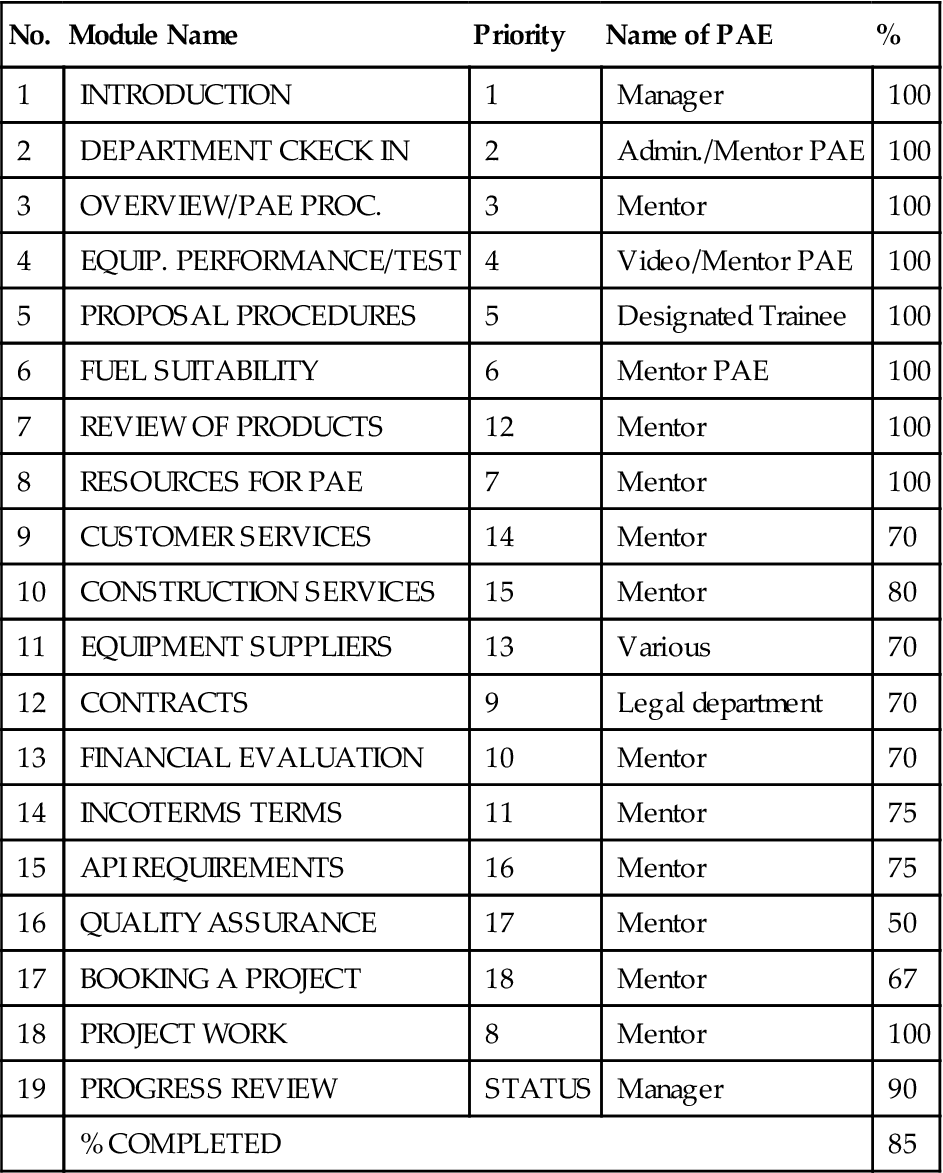
The application engineer is the interface between in-house technical, commercial, and legal disciplines, on the one hand, and the sales force and ultimately the customer, on the other hand. The exact boundaries vary from company to company and also depend on the extent of project related special engineering (Table 17–1).
TABLE 17–1
| No. | Module Name | Priority | Name of PAE | % |
| 1 | INTRODUCTION | 1 | Manager | 100 |
| 2 | DEPARTMENT CKECK IN | 2 | Admin./Mentor PAE | 100 |
| 3 | OVERVIEW/PAE PROC. | 3 | Mentor | 100 |
| 4 | EQUIP. PERFORMANCE/TEST | 4 | Video/Mentor PAE | 100 |
| 5 | PROPOSAL PROCEDURES | 5 | Designated Trainee | 100 |
| 6 | FUEL SUITABILITY | 6 | Mentor PAE | 100 |
| 7 | REVIEW OF PRODUCTS | 12 | Mentor | 100 |
| 8 | RESOURCES FOR PAE | 7 | Mentor | 100 |
| 9 | CUSTOMER SERVICES | 14 | Mentor | 70 |
| 10 | CONSTRUCTION SERVICES | 15 | Mentor | 80 |
| 11 | EQUIPMENT SUPPLIERS | 13 | Various | 70 |
| 12 | CONTRACTS | 9 | Legal department | 70 |
| 13 | FINANCIAL EVALUATION | 10 | Mentor | 70 |
| 14 | INCOTERMS TERMS | 11 | Mentor | 75 |
| 15 | API REQUIREMENTS | 16 | Mentor | 75 |
| 16 | QUALITY ASSURANCE | 17 | Mentor | 50 |
| 17 | BOOKING A PROJECT | 18 | Mentor | 67 |
| 18 | PROJECT WORK | 8 | Mentor | 100 |
| 19 | PROGRESS REVIEW | STATUS | Manager | 90 |
| % COMPLETED | 85 | |||
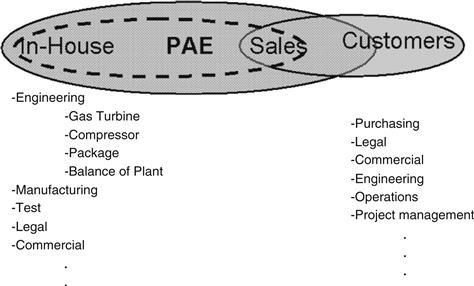
In-house technical disciplines include engineers specialized in equipment design, manufacturing and testing of the equipment, or the design of ancillaries and balance of plant items. They also include legal and commercial specialists.
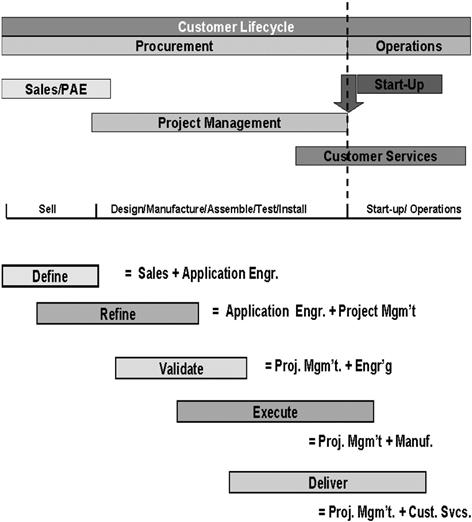
However, this should not be construed as the PAE being just a transmission vehicle. Rather, his knowledge of both internal capabilities and knowledge and the customer’s business make him an important contributor in developing new projects. Again, depending on company strategy, the distribution of tasks between the sales engineer and the project application engineer can vary. Ideally, they work in close cooperation as a team. Table 17–2 shows the typical steps in the project cycle. The PAE supports primarily the selling process with his technical expertise and product knowledge. In this role, the PAE helps define the scope of the project, as well as the type and the features of the product offered. An important milestone in a project is the handover process from the business development organization (which sells and defines the product) to the business management organization (which is responsible to manage all necessary steps to execute the project). The project application engineer tends to stay involved during this time to make sure that the project is fully defined.
TABLE 17–2
Typical Training Module [17-2]
Custom-engineered products, such as centrifugal gas compressors, require more involvement by the engineering organization, while standardized or pre-engineered products may be handled entirely by applications engineers, equipped with product knowledge and application guidelines.
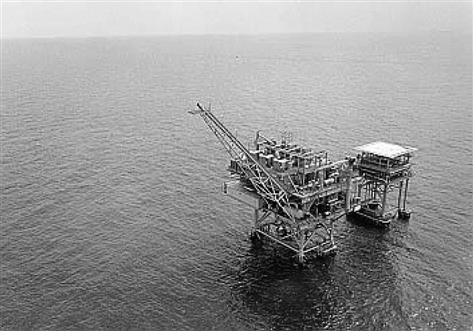
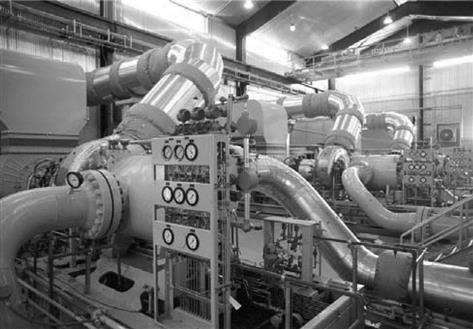
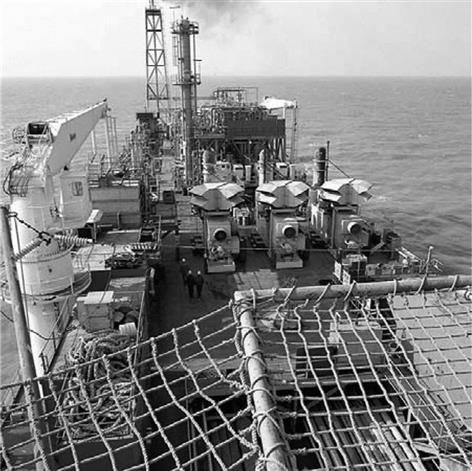
Typical projects include land-based power generation with simple-cycle or combined-cycle gas turbines, gas compression stations for pipelines, power generation, gas compression, and pump applications in offshore applications (Figures 17–1 through 17–3).
In many cases, the scope includes not only the turbomachinery but also the ancillary equipment; balance of plant items may be included and, often, complex testing requirements as well as legal and commercial aspects have to be covered.
To meet this rather broad requirement, the application engineer has to be able to communicate both with internal organizations as well as the sales force and with the customer. This, in turn, requires that he or she understands the tasks, options, capabilities, and preferences of the internal organization. This is more than just “product knowledge” but rather the capability to think as if a member of a variety of internal organizations. This is the reason why a large number of application engineers have worked in one or more of the (usually technical- or commercial-oriented) internal organizations.
Another important task lies in the understanding of the customer’s business. Since turbomachinery products are bought by the industry in order to achieve commercial success, a good application engineer has also to understand the customer’s business (which is why sometimes application engineers are former employees of gas turbine users). In a sense, the task of acting as an interface between internal organizations and customers exists in a similar fashion for the project manager, who is responsible for the project execution in the order fulfillment process.
Finding the Right People
Obviously, the wide spectrum of knowledge and experience just described is not achievable without training and education. There is—to our knowledge—no program in any US or European university dedicated to the professional development of application engineers. Nor would such a course be feasible without a close interaction between academia and industry. Even general descriptions of careers in the gas turbine industry sometimes omit the existence of application engineers. On the other hand, successful application engineers often come from the ranks of the technical or commercial (such as business management) disciplines within the companies whose products they are supposed to support. Another successful route tends to be people who worked operating or specifying the equipment in question. The “right people” are therefore not only defined by a predetermined education but rather by a certain mindset, including good communication skills, the capability to learn the basics in new fields fast, the capability to work in a team and with limited supervision, the capability to work multiple tasks and prioritize, and a wide educational and professional background.
Because most of the business in the gas turbine industry is international, it is of significant advantage for any application engineering organization to retain employees with a variety of language capabilities and cultural backgrounds. In this context, differences in the educational and business structure in different countries have to be understood.
Development
The ideal application engineer in an ideal application engineering organization is a person with working knowledge in all facets of topics required to represent the product and in-depth knowledge in one or more of these topics. The ideal department has engineers such that at least one expert is available for any topic required. In many instances, the screening process comes as a result of months of internal networking searches for future candidates. Together with the networking efforts, managers can seek aid from the human resource personnel to develop a solid interview process. Areas of consideration for the development of a good interview process should be discussed and agreed upon. Points of reference follow:
1. Review of previous performance appraisal and interview supervisors and peers to determine the candidate’s track record
2. Request for a writing sample
3. Panel interview to target technical background and gauge interpersonal skills
4. Development of a scheme to measure applicant’s problem-solving skills
Training Program
The complete self-paced training program must consist of individual modules with specific objectives targeting business applications. Still, for the training program to work, managers are recommended to promote initiative and assertiveness from all participants.
The components of the training program follow and are described next:
Self-Paced Modules
If not already available, management must develop a list of applicable themes related to the industry and accountabilities related to the position. As an example, Figure 17–4 provides commercial and technical themes applicable to the turbomachinery industry.
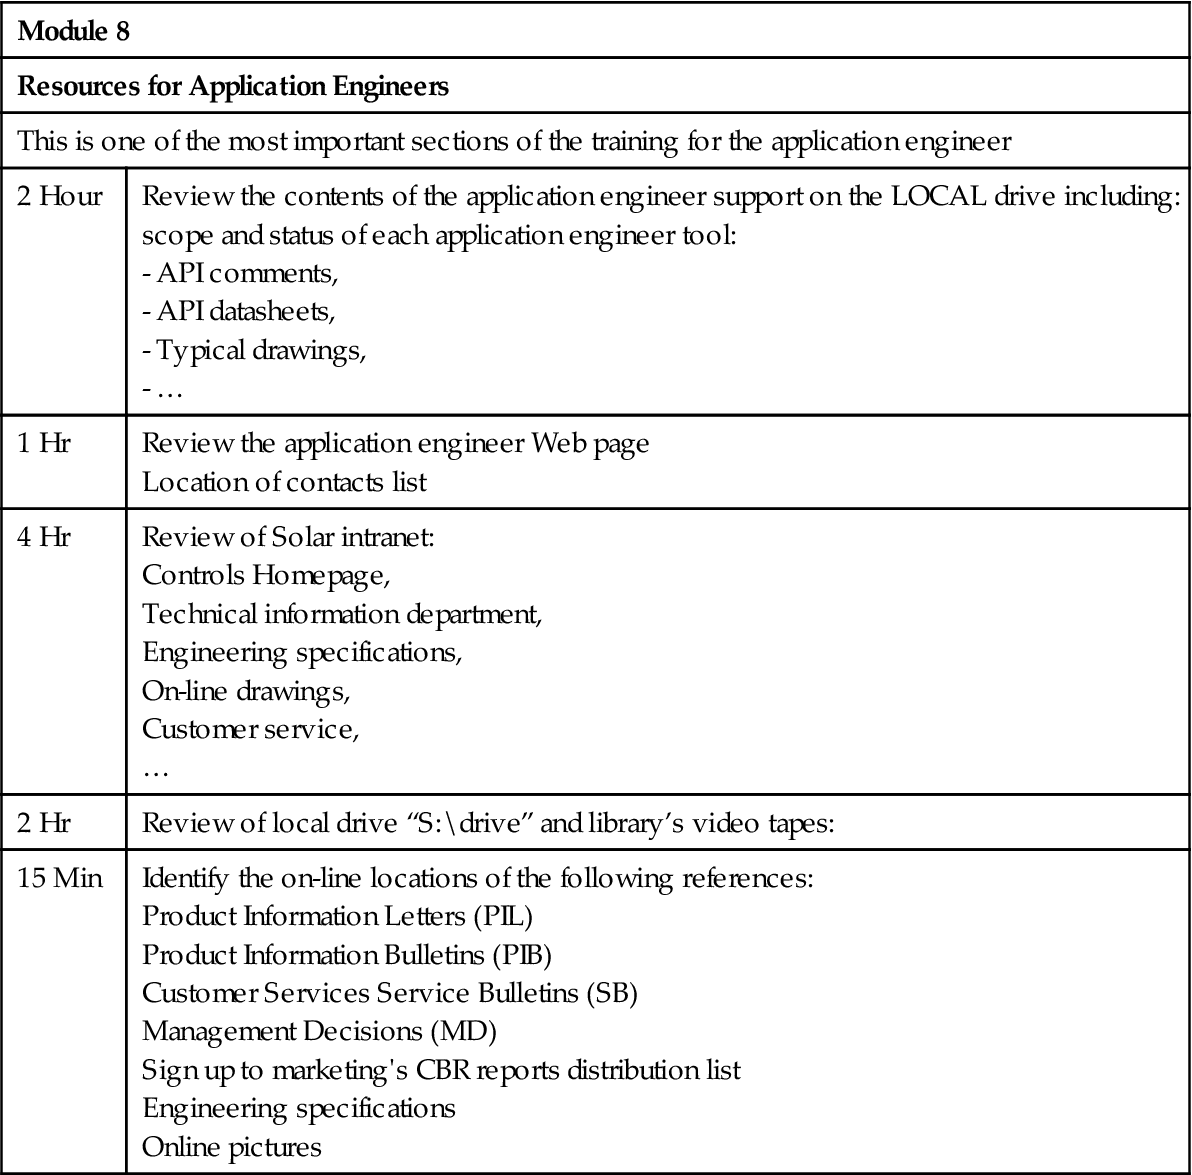
Each of these modules should be structured with a self-study outline covering related topics. An illustration detailing a typical module is provided in Figure 17–5. As noted in Figure 17–5, the module provides a list of the reference material to be reviewed and highlights the main points under study. In addition, the module topics can incorporate estimated times for completion.
Introductory Modules (1–3 and 8)
These first modules should familiarize newcomers with the organization and must be written to allow a smooth transition. Typical items covered in these sections should encompass a checklist to work logistics (credit card, phone card, cubicle location, etc), PC hardware and software, passwords (networks, programs, etc.), and provide direction to coordinate software application training.
Technical Modules (4–7 and 9–11)/Commercial/Legal Modules (12–14)
As a minimum, the technical aspects should encompass areas related to product packaging, turbine and compressor theory, fuel suitability analysis, etc. This portion should be matched with specific areas of the business (i.e., customer services, balance of plant equipment, engineering, etc.). Other examples of technical areas to consider are listed next:
• Turbine and compressor performance guarantees
• Packaging and controls theory
In turn, the commercial modules must provide a full understanding of company’s policies from a legal and contractual perspective. Examples of commercial/legal topics to consider are denoted here:
• Review of company’s policy of terms and conditions of sale exchange policy
• Commercial tools (i.e., bank guarantees, bonds, letters of credit, etc.)
At the end of the self-paced training, an application engineer must be able to develop an understanding for technical considerations from a commercial/legal perspective. In turn, the training process will allow for good decision making while managing risk.
Hands-on Training
A newly hired application engineer should spend several days in the workshop and test cells. The idea is to provide new application engineers with a better understanding of the product and present a global picture of the business. Typical areas for review during this portion of the training program are:
1. Testing capabilities (i.e., ASME PTC 10, ASME PTC 22, American Petroleum Institute test requirements, etc.)
2. Manufacturing capabilities (product lines, shop lineup, lead-time factors, etc.)
3. Understanding of demand management functions
4. Review of bill of materials, package maintenance, controls, etc.
Formal Training
Application engineering management must balance the preceding training with the company’s formal training program. For example, some of the areas useful to application engineers can be tied to human resources courses related to interpersonal skills:
Project Work
Depending on training progress, management must bring application engineers in direct contact with customer inquiry work from day 1. Application engineers can be exposed to these areas in a step fashion to start building their accountabilities. For example, a trainee can help a senior application engineer with budgetary proposals, help solve technical queries, and obtain exposure as an observer during technical clarification meetings. These tasks help trainees develop the required confidence to cope with the assigned work responsibilities.
Progress Review
Finally, a monthly status report must be completed to monitor the progress of trainees and obtain feedback on the effectiveness of the training program. The monthly status report should include a signed copy of the sections that have been completed during the given month.
Training Programs within Academia
When it comes to undergraduate engineering courses, standards vary all over the global map. However, the ease of communications and especially the Internet is slowly closing gaps between curricula in different countries.3
At one point in the 1960s, universities (all universities) offered little more than a few ideal and theoretical cycle diagrams with equally theoretical heat balance calculations. If the university was fortunate enough to have well-funded labs, the practical equipment may have included a steam turbine, a diesel turbine, perhaps some car engines for the students to strip and reassemble.
The first university/OEM joint educational accredited course venture in the United States may have been the University of Cincinnati/General Electric collaboration back in the 1920s. Their example was not one other US universities were swift to follow but follow they eventually did.
The early 1970s saw the start of a landmark program in the United Kingdom. In 1971, Dr. D.B. Spalding, then professor of Heat and Mass Transfer at Imperial College, London, England, conceived COBALT (computer-based learning and teaching). He wanted experimental rigs constructed or modified to demonstrate the efficacy of prediction flow formulas. Experimental readings on the rigs were used in nontheoretical calculations and compared with the computer program results that iterated flow parameter values, starting with boundary layer conditions. The program would thereby introduce masters’ level program material to second-year undergraduates. Some of those predictive flow formulas are still used in performance analysis (PA) systems, such as are described (in Chapter 10 on Performance Optimization) and designed 20 years later, so that earlier work is still current. That summer in 1971, I was one of two students hired to realize Spalding’s plan, and after the other became unavailable, the only one. The initial work scope I had been tasked with was finished in the summer of 1972.
OEM/university joint ventures are still not quite as common as they could be. When they are in place, however, they benefit students greatly. University students may be able to complete some experiments that the OEM cannot perform more inexpensively in its own facility. This can and ought to be organized throughout the undergraduate degree program and, if possible, still earlier.
With most gas turbines, simulators, flight or otherwise, are used to train plant operators, naval seamen, and pilots or “refresh” their own skills periodically. Schools and universities often cannot afford the investment that good simulators or real gas turbines (even small ones) require. They depend on donations and other help from industry (see the examples and cases that follow).
Today, students are lured into fields seen as more lucrative, such as law or business. Some engineers may soon realize that, if they want to make more money, they need to go back to school for an MBA. Of the few who stay loyal to the basic profession, still fewer may be attracted to the subdisciplines within the engineering field that need new blood. On the other hand, if somehow an engineering student gets a detailed enough look at the reality of operating turbomachinery when a student, his interest is often anchored for life. Employers find the “catch-up” time that fresh graduates take to come up to speed is then reduced to a substantial extent.
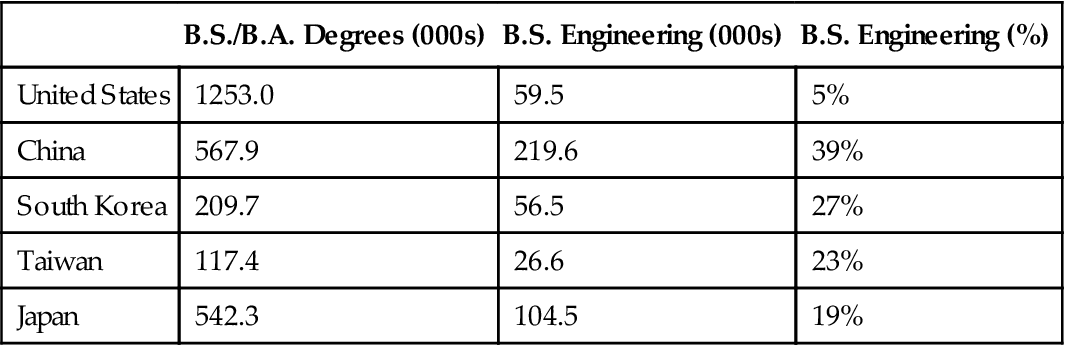
Engineering student recruiting numbers stand at low to dwindling. Robert Herbold (former COO, Microsoft) compiled the data in Table 17–3.
TABLE 17–3
Engineering Degrees∗
| B.S./B.A. Degrees (000s) | B.S. Engineering (000s) | B.S. Engineering (%) | |
| United States | 1253.0 | 59.5 | 5% |
| China | 567.9 | 219.6 | 39% |
| South Korea | 209.7 | 56.5 | 27% |
| Taiwan | 117.4 | 26.6 | 23% |
| Japan | 542.3 | 104.5 | 19% |
∗Source: http://www.vcconfidential.com/2006/04/leisure_class.html.
All four Asian countries have four to eight times the per capita number of students going into engineering and China and Japan have four times and twice, respectively, the annual number of B.S. degrees in absolute terms compared to the United States.
Consider also the numbers for students receiving Ph.D.s in physical science or engineering, shown in Table 17–4.
TABLE 17–4
| 1987 | 2001 | Growth | |
| US citizens getting Ph.D.s Asian Citizens |
4700 5600 |
4400 24,900 |
(6.4%) 345% |
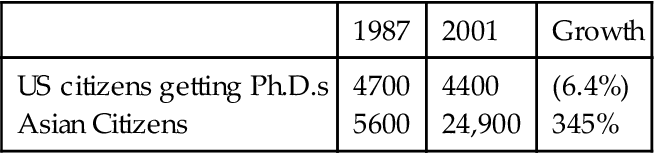
Data sources indicate that the United States in 2005 graduated only 10% in US-resident engineer numbers that China did and 20% the number that India graduated. Many of those engineers will work for US and European corporation branch offices without ever leaving their home country. Also, the total US graduate engineer population is effectively halved because half of them are foreign and cannot get a work permit since the start of the US-Afghanistan war in September 2001.
Given the current US policy of exporting technical jobs to countries with cheap labor, the figures are not likely to change much in the near future. Many US students argue that there is no future in engineering.
The cultures in these countries that rival the United States for the globally available engineering jobs are more apt to place an engineer in a top management position than a lawyer or an accountant. For many years, Europe was similar in this regard. The “MBA-rules” perspective has taken over with some European companies, but it is still not as widespread as in the United States.
To demonstrate the effectiveness as well as the “nuts and bolts” of specific academic programs, I have included some examples and case studies of academia’s efforts to bring the outside world and gas turbines into their classrooms. They provide excellent templates for ambitious professors and the potential for endless variations.
The first example involves an industry (BMW-Rolls Royce and MTU Munich)-academia (Berlin University of Technology) joint venture in Germany.
Case Study 2: Industry Supported Multimedia Aeroengine Design Case4
The Jet Propulsion Laboratory at the Berlin University of Technology introduced an aeroengine design project, Project Jet Propulsion. The seminar, in which the German aeroengine industry is actively involved, is directed at students who have successfully finished their basic engineering training course.
The objective of the course is to provide experience in all stages of the complete design process of an engine component in a genuine industrial working environment. The component is selected to ensure that a wide range of design requirements, including customer requirements, aero-thermodynamic and mechanical design, pricing and certification, must be considered. An experiment supporting the design completes the course.
The course lasts for one year. Minutes are kept and action lists checked. The students are encouraged to work on their own.
Industry participates with telephone conferences, giving their comments on the work of the group and answering questions, a video conference sometimes, and in-house OEM progress reviews at intermediate and final design stage.
The incentive to start this program was prompted by the realization that a basic engineering education tends to produce engineers who know a little about many different subjects, while postgraduate and Ph.D. education tends to produce engineers who know a lot about a few subjects. Industry [used to] promotes this trend developing generalists who in the long run know nothing about everything and specialists who know everything about nothing. . . .
Classical teaching has not changed significantly over the past 50 years. Most of the reforms introduced in this period of time have been concerned with the opening of the universities to a larger number of young people rather than with a quality improvement. The universities have little flexibility to adapt to a changing environment.
The Germans are trying to remedy matters.
The objective of the Jet Propulsion Project is to lead the students through the interdisciplinary process required to define and develop a gas turbine component or system.
Several theory courses provide the background basics, including:
• Component characteristics (intake, compressor, combustor, turbine, nozzle)
• Engine performance and partial-load operation
• Engine systems (air, oil, control system)
• Measurement techniques (laboratory, engine)
A course in turbomachinery aerodynamics presents:
• Short review of fundamental gas dynamics
• 1D axisymmetric hub-to-tip and 2D blade-to-blade design (quasi-3D design system)
• Overview of CFD techniques and applications
A course on mechanical design and cooling teaches:
• Engine architecture alternatives
• Hot and cold annulus diagram
• Bearings and oil system design
• Air system components (restrictors, seals) requirements
• Design principles and analysis
• Heat transfer and thermal control of engine parts
The Jet Propulsion Project is an integrating course. One of the objectives is getting used to preparing a complete solution to a technical problem and presenting the results in a team. The participants have to communicate data, technical, and time scale information and learn how to behave in a team to achieve a common goal within schedule constraints.
The objectives of the first phase, which lasts about one third to one half the course, are as follows:
• Provide the necessary background information, like requirements, performance data, design constraints, etc.
• Preliminary study of alternative solutions, evaluation, and selection of realistic configurations; one may be selected after a review
The second design phase includes:
The last meeting is a final design review at a supporting company. The course is finished with a final report and an evaluation of the course by the students.
Two problems treated by the Jet Propulsion Project were the design of an HP-Compressor bleed system for a two-spool turbofan (1997/98) and the design of an LP shaft failure protection system for a turbofan engine (1998/99). The results from this project included student-designed items that were “industry ready.” One is described next.
Two electronic systems for an emergency fuel shutoff were investigated. The first uses two shaft speed gauges, one on the fan end of the shaft and the other on the LP turbine end. The signal difference is used for actuation. The second system uses the LP turbine speed gauge and responds to the acceleration rate of the rotor. To determine if the signal is sufficiently fast, transient performance of the engine was analyzed. It was found that acceleration rates after shaft failure is several orders of magnitude greater than in normal operation. Both systems require a speed gauge in the “hot” part of the engine.
System accuracy ensures that no undesirable fuel shutoffs occur.
The system using the rotor acceleration rate appeared preferable, because it uses only one speed measurement and is therefore more reliable. To reduce response time, the students came up with digital electronics for a faster evaluation of the signal than in current systems. This proved to be of major importance for the response time. To support this evaluation, experiments were performed in the laboratory with three speed gauges and the signals were analyzed in the time domain to define the requirements on the electronic treatment.
The investigations ended with a final assessment of the sequence of events after engine failure and the resulting turbine overspeed. This required an analysis of the dynamics of the system and the engine during and after fuel shutoff, when the HP rotor feeds energy back into the core mass flow. Three out of four systems satisfied the FAA requirements, so no extra overspeed capability has to be designed into the LP turbine disc design.
Since all the systems investigated were new, tests were needed as part of the compliance with the FAA certification requirements. The students produced an engine development plan lasting two years, which used eight engines.
Case Study 3: Theoretical Calculations Compared with Actual Cogeneration Plant5
In another project, the Royal Institute of Technology in Sweden ran a program, assisted by ABB Stal. The students chose an optimum design configuration for a cogeneration application and then were able to visit the actual plant and compare their own work with ABB Stal’s choices. Table 17–5 indicates how close they came.
TABLE 17–5
Comparison between the Model Plant and the Result of the Students, Major Components [17-4]
| Item | Neubrandenburg | Student Result |
| Gas turbine | 2 × 23.7 MWel (ABB GT 10B) | 2 × 25 MW (ABB GT 10) |
| Steam turbine | 1 × 27 MWel (ABB V40AHH) | 1 × 24 MW (ABB VAX HP 16) |
| Pressure levels | 2 levels | 70 bars, 7 bars |
| Waste heat boilers | 2 | 2 |
| Supplementary firing | 10–100% | Up to 100% |
| Bypass | Yes | Possibility to add |
| Transformer | 2 × 40 MVA for 110 kV | For 3 transformers for feeding the electric grid |
The following two cases6 are courtesy of K.W. van Treuren, Baylor University. As with most gas turbine academics, he is keen to spread the word on gas turbines and he has presented his work at different venues, including IGTI conferences.
The first case involves using commercial software and spreadsheets for gas turbine design that accommodates a flight mission profile. The second is work on a land-based gas turbine that the university was given to work on in its laboratory. The starting point for the first case was the US Air Force Academy (USAFA). The USAFA program was adapted for use at Baylor University in Texas.
Case Study 4: Undergraduate Engine Design Program6,7
A unique, three-part undergraduate gas turbine engine design project was developed to acquaint students, working in teams of two or three, with the process of engine cycle selection. The design application is a low-flying, close air support (CAS) aircraft using a separate exhaust turbofan engine. Both spreadsheets and commercial software are used. The commercial software is included with the course textbook, Elements of Gas Turbine Propulsion, by Dr. Jack D. Mattingly. Using commercial software, reinforced by classroom lectures, allows the students to focus on the design decisions.
The first part of the project is mission analysis, which introduces the student teams to the design problem. A spreadsheet template is given to each student team that includes aircraft and mission profile specifications. The students must complete the spreadsheet and develop the relationships for lift, drag, thrust required, and fuel burn to calculate a usable fuel remaining at the end to the mission. The spreadsheet allows the students to obtain an average specific fuel consumption that results in 1500 lbm of fuel remaining at the end of the mission. This target value is used in the second part of the design process, on-design parametric cycle analysis (PCA), as a basis for engine cycle selection. Parametric cycle analysis is accomplished using the program PARA.EXE. PARA.EXE generates a carpet plot of possible engine design choices by varying the compressor pressure ratio, bypass ratio, and fan pressure ratio. From these carpet plots the students must identify three possible engine cycles that meet the target value for specific fuel consumption found during the mission analysis.
Trade-offs between thrust and fuel consumption are discussed, and the students are required to justify their choices for the engine cycle. The last part of the project is the off-design engine performance analysis (EPA) using the program PERF.EXE. The chosen engines must fly the mission and meet the required performance and mission constraints. Based on the overall mission performance, the students narrow the field of three possible engine cycles to one. Each student team then does a sensitivity study to determine if there is an additional benefit for slight changes in the design choices. The result of this sensitivity study is the students’ final engine cycle. With this cycle, an additive drag calculation is made using the program DADD.EXE to account for losses (off-design) and these losses are then factored back into the performance spreadsheet to check the engine’s capabilities for completing the mission. The iterative nature of the design process is emphasized throughout, but only one pass through the process is accomplished. Units are given in English Engineering, as that is what is required for the project. Both SI and English Engineering units are taught in the course.
![]() = Specific thrust, lbf/(lbm/sec)
= Specific thrust, lbf/(lbm/sec)
k = Drag due to lift factor for given wing platform
![]() = Mass flow rate of air, lbm/sec
= Mass flow rate of air, lbm/sec
![]() = Mass flow rate of fuel, lbm/sec
= Mass flow rate of fuel, lbm/sec
S = Uninstalled specific fuel consumption, (lbm/hr)/lbf, (![]() )
)
T = Installed thrust, lbf, (F–Dadd)
TSFC = Installed specific fuel consumption, (lbm/hr)/lbf, (![]() )
)
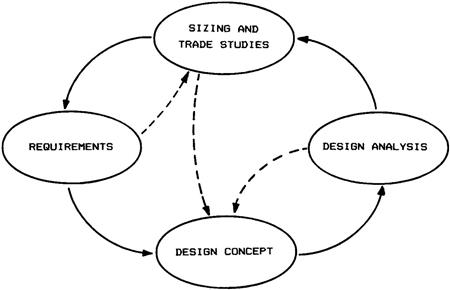
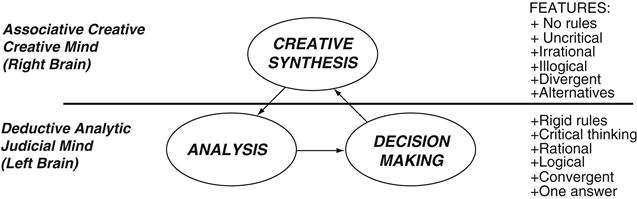
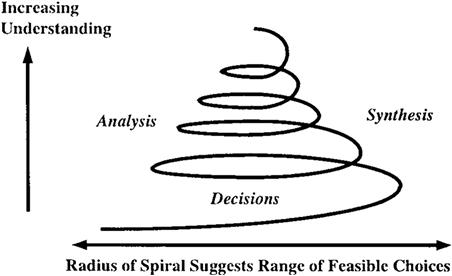
The need for design in an engineering curriculum is further emphasized in the recent engineering criteria (EC) 2000 developed by the Accreditation Board of Engineering and Technology (ABET). The design described next is not a capstone design experience but is meant to emphasize the conceptual design portion of the process. For the engineer, this is often thought of as creative problem solving. The problem can be defined in great detail or may be something very ill-defined. Whatever the detail, the engineer must develop an acceptable solution that satisfies the requirements. This process of arriving at an acceptable solution uses the cyclical nature of the design process as seen in Figure 17–6. Here, engineers use all their mental faculties to be creative with ideas, analyze the ideas, and then decide on their relative merit, as is shown in Figure 17–7. This often leads to more ideas to be evaluated and further decisions that must be made. Eventually, the engineer repeats this cycle many times until an acceptable solution is determined, as shown in Figure 17–8.
The project described in this section acquaints the students, working in teams of two or three, with the process of engine cycle selection and reinforces the design decisions necessary for the conceptual design of a gas turbine engine. Cycle analysis, according to Oates (1988), is the process to obtain estimates of the performance parameters (primarily thrust and specific fuel consumption) in terms of design limitations (such as maximum allowable turbine temperature), flight conditions (the ambient pressure and temperature and the Mach number), and design choices (such as compressor pressure ratio, fan pressure ratio, and bypass ratio). With these goals in mind, the initial development of the project was accomplished at the US Air Force Academy by Lt. Col. Brenda Haven and has been subsequently adapted for use at Baylor University in an elective course on propulsion systems for mechanical engineers. The degree program at Baylor University is a more traditional undergraduate B.S. in Engineering with a mechanical or electrical emphasis. Baylor does not have a graduate engineering program, but approximately 13% of the students take additional study at other institutions and receive advanced degrees. Approximately 10 students take this course in the fall of their senior year. Mechanical engineering students often have a keen interest in aerospace topics. This project reinforces that interest and presents the complexities of designing a gas turbine engine. Prerequisites for this course are fluid mechanics and an advanced course in thermodynamics. Heat transfer is taken concurrently. Propulsion systems are presented as an application of these fields.
The project has great value in light of ABET EC 2000. Teamwork is strongly emphasized as the students work in teams of two or three. Student teams are thought of as industry competitors. They are allowed to work with their partner and the professor but not allowed to talk with other students about the details of their project or use material from previous semesters. At the end of the course the student teams present their design and discuss its performance. After each team presents its results, the class decides on the “winner” of the competition. A final, written report is also required, thus exposing the students to both written and oral presentation. Higher-order thinking skills are developed, as the students must conduct multiple paper studies of various engines and make engineering trade-offs. While there are many solutions, the desire is to optimize the results for the “best” solution possible. In the process of selecting the engine, the students are using design tools such as spreadsheets and performance analysis programs.
The design project is accomplished in three parts. Basic physical concepts and analysis techniques required by the design process are emphasized throughout the course and provide the basis for these parts. The first part is a mission analysis, which introduces the student teams to the design problem. The request for proposal (RFP) calls for an aircraft to fly the close air support mission. The students are given the requirements for the mission and need to determine lift, drag, thrust required, and fuel burn at each mission point. The next part is the parametric cycle analysis, where the students are required to select the design choices for the engine cycle after comparing potential engine performance at the chosen engine on-design point. The last part of the design process is the engine performance analysis, where the chosen engine is “flown” off-design to see if it satisfies the mission requirements. After the engine is shown to meet these design requirements, an additive drag calculation is accomplished and the engine run again to determine if the engine still satisfies the design requirements. This last check of performance emphasizes the iterative nature of the design process.
Mission Analysis
The first part of the project, mission analysis, introduces the student teams to the design problem. The students are placed in the scenario of being young propulsion design engineers working for a contractor. Their task is determining a suitable engine cycle for the USAF’s next generation two-engine, thrust vectoring, close air support aircraft. This part of the design process is the conceptual design phase, where engineers, logisticians, and technical support team that includes aircraft and mission profile specifications (see Table 17–6 for completed spreadsheet).
TABLE 17–6
Design Project—Part 1: Mission Analysis [17-5]
| Aircraft Specifications | |
| Number of Engines: | 2 |
| Ordinance (Ibf): | 16,000 |
| Dry A/C Weight (Ibf): | 22,000 |
| Usable Fuel (Ibm): | 9500 |
| Parasite CD: | 0.023 |
| k: | 0.045 |
| Wing Area (ft2): | 400 |
| CLmax: | 2.8 |
| TO distance (ft): | 3000 |
| Mission Specs: | Altitude ft | Density Ibm/ft3 | Temp R | Mach No. | Velocity (ft/s) | Time (minutes) | PHI- |
| 0-1 Warmup/Taxi | 0 | 0.07647 | 518.7 | - | - | - | - |
| 1-2 Take-Off | 0 | 0.07647 | 518.7 | - | - | - | 0.17 |
| 2-3 Climb | n/a | - | - | - | - | - | - |
| 3-4 High Cruise | 2000 | 0.0721 | 511.6 | 0.65 | 721 | 20 | 0.02 |
| 4-5 Descent | n/a | - | - | - | - | - | - |
| 5-6 Combat | 200 | 0.07609 | 518.0 | 0.40 | 446 | 100 | 0.03 |
| 6-7 Low Cruise | 200 | 0.07609 | 518.0 | 0.57 | 636 | 20 | 0.02 |
| 7-8 Landing/Taxi | 0 | 0.07647 | 518.7 | - | - | - | - |
| Mission Particulars: | |||||||||
| Leg | Fuel Used (Ibf) | A/C Weight @ Start of Leg (Ibf) | New A/C Weight (Ibf) | CL | CD | T Required (Ibf) per Engine | TSFC (Ibm/hr)/Ibf | F Required (Ibf)per Engine | Average S: (Ibm/hr)/Ibf |
| Warmup/Taxi | 38 | 47,500 | 47,462 | - | - | - | - | - | - |
| Take-Off | 475 | 47,462 | 46,987 | - | - | 6312 | - | 7605 | - |
| Climb | 470 | 46,987 | 46,518 | - | - | - | - | - | - |
| High Cruise | 1266 | 46,518 | 45,251 | 0.1998 | 0.0248 | 2886 | 0.6582 | 2945 | 0.645 |
| Descent | 5 | 45,251 | 45,247 | - | - | - | - | - | - |
| Combat | 4731 | 45,247 | 24,516 | 0.4483 | 0.0320 | 2134 | 0.6649 | 2200 | 0.645 |
| Low Cruise | 996 | 24,516 | 23,520 | 0.1282 | 0.0237 | 2270 | 0.6582 | 2317 | 0.645 |
| Landing/Taxi | 12 | 23,520 | 23,507 | - | - | - | - | - | - |
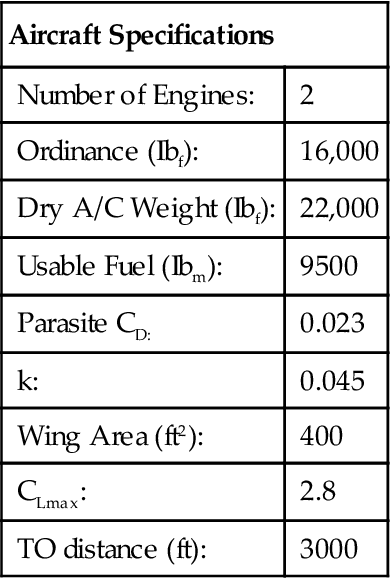
The students must complete the spreadsheet and develop the relationships for lift, drag, thrust required, and fuel burn to calculate a usable fuel remaining at the end of the mission. The design constraint for this mission is the aircraft must land with 1500–1510 lbm of usable fuel remaining after engines are shut down. The students are led through an algorithm for this analysis (see Figure 17–9). Not all necessary information is available at this time, and the students must use an average specific fuel consumption that results in required fuel remaining at the end of the mission. Class time is used to review the RFP to ensure the students know what is required. The mission presented is a simple mission as given in Figure 17–10.
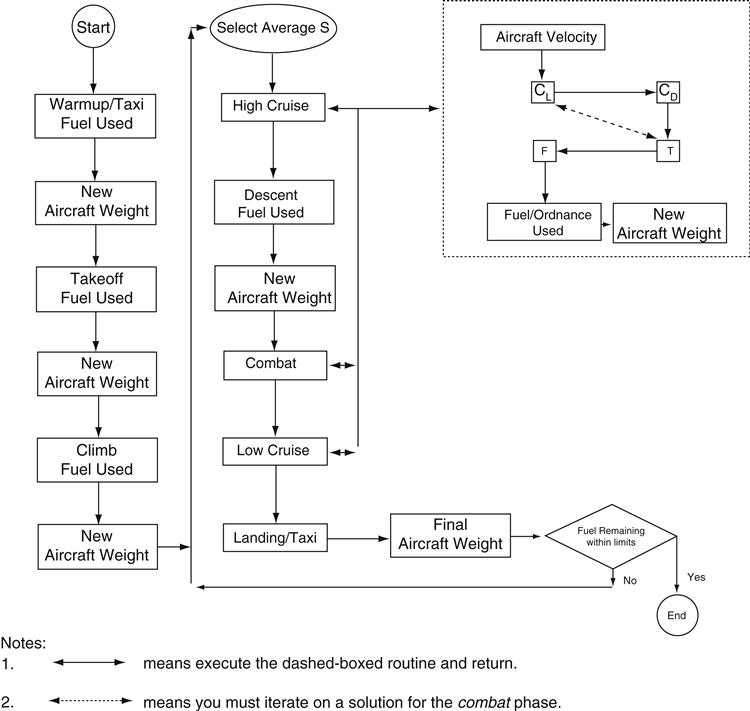
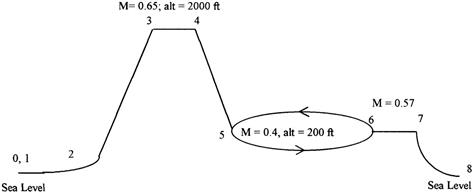
The mission profile consists of the following mission legs: 0–1 Warmup/Taxi, 1–2 Takeoff, 2–3 Climb, 3–4 High Cruise, 4–5 Descent, 5–6 Combat, 6–7 Low Cruise, and 7–8 Landing/Taxi. Guidelines for fuel usage are given in the RFP. Standard percentages for fuel used are given for all legs except the High Cruise, Combat, and Low Cruise legs. These are the legs where the team must determine the amount of thrust required for the aircraft. The aircraft is expected to combine some of the best features of the A-10 and AH-64 platforms, including survivability, lethality, efficiency, and maneuverability, while being cheaper, lighter, and more versatile in extreme weather. Thrust vectoring only occurs at the combat condition and the vector angle is 45°. The aircraft loiters for 100 minutes at the combat conditions and then expends its ordinance. The aircraft specifications are given in Table 17–6. These values are programmed into the spreadsheet template that each student team is given. Students then develop the drag model and ultimately calculate the uninstalled thrust. A separate exhaust turbofan has been selected as compressor pressure ratio, fan pressure ratio, and the bypass ratio. The designers are required to calculate the uninstalled thrust, F, and the uninstalled specific fuel consumption, S. To relate these quantities to their installed counterparts, T and TSFC, the teams use a first “guess” for the installation loss coefficient, φ or PHI, as given in Table 17–6.
Fuel-used calculations for cruise legs are made with a user input value of S. The spreadsheet is developed in such a way as to allow an update of the engine performance S values at the off-design condition, when this analysis is accomplished later in the design process. A sample spreadsheet with example values is given to the students so they can validate their spreadsheet formulas for accuracy. However, the numbers given do not represent a viable engine solution.
To satisfy the first phase of the conceptual design process, Design Project I, the team must deliver a written report containing:
2. Information on current technology medium/high-bypass turbofan engines (i.e., provide typical values for specific thrust, specific fuel consumption, engine diameter, πc, πf, α) for attack aircraft
3. A discussion of the purpose of doing a mission analysis
4. The complete mission description
5. Full and complete discussions of the equations used in the spreadsheet and their corresponding assumptions
6. The average S needed for the mission and what drives the selection of average S
7. The effect of installation losses on engine thrust required and specific fuel consumption
Several skills are used in this part of the exercise. The students use spreadsheets for calculation. While a template is supplied into which equations for lift, drag, and uninstalled T and TSFC are coded, the students still must develop and validate their equations in the spreadsheet. The spreadsheet equations also make use of basic principles learned in fluid mechanics and aerodynamics, reinforcing the concepts of lift, drag, thrust, and fuel consumption. Next, the students must research current technology engines of this size. They are shown the importance of historical data from which to make projections for future technology capabilities.
Parametric Cycle Analysis
The second part of the design project is to accomplish the on-design parametric cycle analysis. Mattingly et al. (1987) state three reasons for PCA:
Firstly, off-design analysis cannot begin until the design point and the size of the engine have been chosen by some means. On-design analysis is much less tedious and time consuming than off-design, often providing mathematical optima that can be directly exploited. Thirdly, and most important, identifying the combinations of design choices that provide the best performance at each mission flight condition reveals trends that illuminate the way to the best solution.
Computer labs introduce the students to each of the commercial programs used: PARA.EXE and PERF.EXE. In the lab, the students are given a self-paced tutorial worksheet to familiarize themselves with the operation of the program. This has worked remarkably well as PARA.EXE is a Windows-based program and is menu driven. The program calculates the on-design cycle performance that was previously discussed in class. In the Design Project I handout, the students are given a discussion of how to generate data and how to present data using a carpet plot. A second page explains how to import the data into a spreadsheet and then create the plot. PARA.EXE calculates engine performance and generates the data. The carpet plot displays possible engine design choices that result from varying the compressor pressure ratio, bypass ratio, and fan pressure ratio (see Figure 17–11). This is a parametric study of the three design variables available to the turbofan designer; πf, πc, and α, and observation of the trends in specific thrust, ![]() , and specific fuel consumption, S, as the design variables are changed. The program PARA.EXE, developed by Dr. Jack Mattingly, is used to input the on-design conditions and output the
, and specific fuel consumption, S, as the design variables are changed. The program PARA.EXE, developed by Dr. Jack Mattingly, is used to input the on-design conditions and output the ![]() . and S for variations in the design choices. The results allow the design teams to narrow the field of possible engine designs. The students are given a range of values for the design choices that must be explored, as reported in Table 17–7.
. and S for variations in the design choices. The results allow the design teams to narrow the field of possible engine designs. The students are given a range of values for the design choices that must be explored, as reported in Table 17–7.
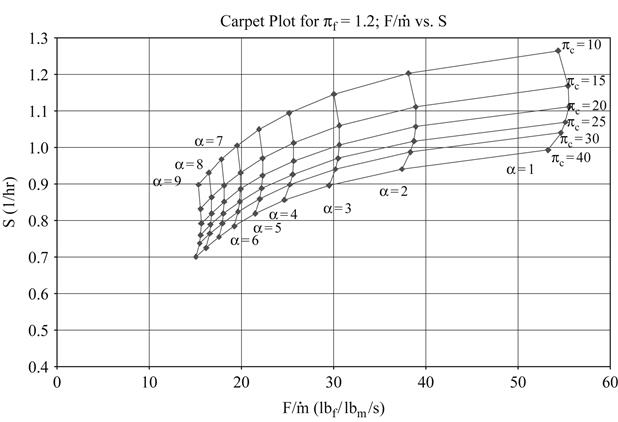
A carpet plot shows how ![]() and S vary for a given πf, and variable πc and α. Plots are generated for the range of πf. For each πf value, the design team must determine combinations of πc and α that might satisfy the maximum average S requirement determined from the previous Design Project I exercise. Drawing a horizontal line on the carpet plots corresponding to the maximum allowable average S does this. Based on these plots, the teams have now identified many different engines that have the same value of S at the design point (albeit different values of πc, πf, and α), with this value equaling the average S calculated from Design Project I. Each possible engine design might meet the mission requirements, although it is still too early in the design process to tell for sure, as the analysis is incomplete without an off-design calculation. The students must choose the final engine cycle after carefully considering the trade-offs required. The students must also justify their answer by looking at factors such as pressure rise per stage, number of stages, cost, weight, size, etc.
and S vary for a given πf, and variable πc and α. Plots are generated for the range of πf. For each πf value, the design team must determine combinations of πc and α that might satisfy the maximum average S requirement determined from the previous Design Project I exercise. Drawing a horizontal line on the carpet plots corresponding to the maximum allowable average S does this. Based on these plots, the teams have now identified many different engines that have the same value of S at the design point (albeit different values of πc, πf, and α), with this value equaling the average S calculated from Design Project I. Each possible engine design might meet the mission requirements, although it is still too early in the design process to tell for sure, as the analysis is incomplete without an off-design calculation. The students must choose the final engine cycle after carefully considering the trade-offs required. The students must also justify their answer by looking at factors such as pressure rise per stage, number of stages, cost, weight, size, etc.
After generating the carpet plots, the students must identify three possible engines that will satisfy the mission constraint of 1500–1510 lbf fuel remaining at the end of the mission. Trade-offs between thrust and fuel consumption are discussed, and the students are required to justify their choices for the engine cycle based on their knowledge of technology, performance, cost, etc. Class time is devoted to going over the Design Project II handout and parametric cycle analysis. During this part of the design process, the teams begin to explore the vast number of possible turbofan designs that might be encouraged to use the combat loiter flight condition (M = 0.4, altitude = 200 ft) as the on-design point. Since the aircraft will spend about 70% of the mission time at this condition, this is a logical candidate.
The requirements for Design Project II are as follows:
1. Justification for doing a PCA. What does it reveal, in general?
2. The significance of picking an on-design point. Why is an on-design point needed?
3. Inclusion of Design I mission analysis and how it relates to PCA.
4. Physical explanations of the trends in S and ![]() when each of the three design variables are changed.
when each of the three design variables are changed.
5. Selection of three engine designs (unique combination of πc, πf, and α) that meet the maximum average S requirement. Also required is a discussion of the justification with regard to size, potential cost, unique technology requirements, etc.
Design Project I is intended to be an introduction to Design Project II as well as part of the final report (Design Project III). Previous spreadsheet errors should be corrected by now. Students are encouraged to begin collecting a list of figures, nomenclature page, references or documentation, etc. as they go. They also should include a closing statement/paragraph regarding how this PCA effort will provide the foundation for the next step in the design process, engine performance analysis.
Engine Performance Analysis
The last part of the project is the off-design engine performance analysis accomplished on the three engines chosen in Design Project II. The chosen engines must “fly” the mission and meet the required performance and the mission constraints. The EPA is conducted using commercial software PERF.EXE. The on-design file from PARA.EXE is input into PERF.EXE and Figure 17–12 shows the algorithm for each cruise condition. For the chosen engines, the off-design values of the uninstalled specific fuel consumption, S, at the two cruise legs and the combat leg will be input into the mission analysis spreadsheet written in Design Project I. A final selection of the best engine and a justification of this choice is required.
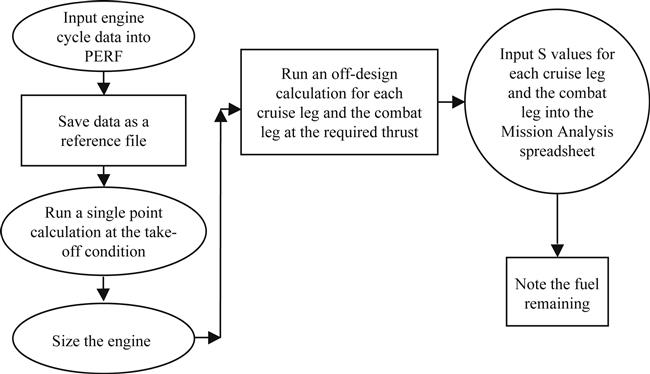
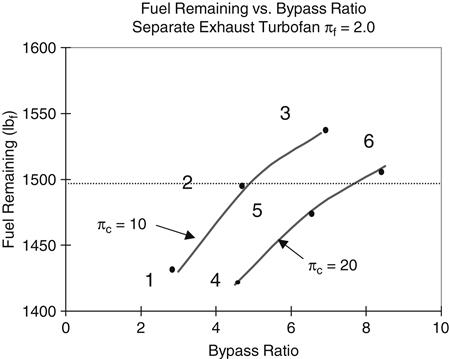
By comparing the different fuel-remaining values generated for each engine, along with relative knowledge of engine technology, cost, reliability, weight, materials, and size, the student teams refine the engine design for the aircraft and decide on a final engine configuration described by a unique set of πc, πf, and α values. The output of the spreadsheet program, as previously discussed, will be a final fuel-remaining value for the engine/airframe combination. Using this selected engine, the students do a sensitivity study to determine if there is an additional benefit for slight changes in the design choices. Five additional engines are run to determine if the selected design choices are optimum (see Figure 17–13). From the fuel remaining vs. bypass ratio plot and relative knowledge of cost, technology, etc., the design team chooses one engine (a combination of πc, πf, and α) to satisfy the RFP. This engine must lie on one of the two πc lines from the sensitivity analysis, it must meet the fuel remaining limit (no more, no less than 1500 lbf), and it will most likely require linear interpolation to determine the appropriate. The design team must then take this new engine, size it, and run the mission spreadsheet with the new S values to ensure the final design will satisfy the requirements.
As a final step, a calculation is made to determine the actual additive drag of the chosen engine at the takeoff, high cruise, combat, and low cruise mission legs. To do this, the program DADD.EXE is used. This program uses the PERF.EXE results at the different mission legs. The students also perform one hand calculation at the takeoff condition for verification purposes. The program DADD.EXE will ask for on-design and off-design values of the Mach number, altitude, and mass flow. Once the additive drag is calculated, the new values for φ are input into the mission spreadsheet and the fuel remaining is recalculated. Students discuss how good the original assumptions were for additive drag and what the impact on the final design is. The next step, iteration, is discussed but not required for this project. The iterative nature of the design process is emphasized throughout the course but only one pass through the process is accomplished. The students must deliver a final design report incorporating Design Projects I and II with the following new information added:
1. A general discussion which answers the “What is it?” and “How is it done?” of EPA.
2. A summary table listing the results of the EPA for the chosen engine. Include values of πc, πf, α, S (at each cruise/combat condition), and the amount of fuel remaining at the completion of the mission.
3. A plot of fuel remaining vs. bypass ratio, along with a complete explanation of the observable trends in fuel remaining as functions of πc and α.
4. A table for the additive drag. Comment on how close the estimated values are to the calculated values. How do the calculated values affect the fuel remaining? If the fuel remaining decreases due to the higher additive drag, what might the designer do?
5. Strong justification for why the chosen engine should be produced.
6. Computer/spreadsheet output that provides the supporting information for all plots, tables, figures, calculations, and numerical results.
Again, a variety of skills are used to arrive at the finished product. Written skills are present with the final design report. Students had the benefit of feedback on their writing skills for Design Projects I and II. An oral presentation is given at the close of the project, giving important performance parameters and a justification for why their engine is the best. After all students have presented their engines, the class determines which engine should be declared the “winner” of the competition. The students used a variety of tools, including spreadsheets and commercial software, to aid in their design analysis. They made difficult choices concerning the trade-offs associated with design of gas turbine engines. A sense of accomplishment is evident in their confidence when they complete the course.
Case Study 5: Gas Turbine University Laboratory Study8
An important part of teaching a gas turbine course is exposing students to the practical applications of the gas turbine. This laboratory proposes an opportunity for students to view an operating gas turbine engine in an aircraft propulsion application and to model the engine performance. A Pratt and Whitney PT6A-20 turboprop was run at a local airfield and engine parameters typical of cockpit instrumentation were taken.
The students, in teams of two, then modeled the system using the software PARA and PERF in an attempt to match the manufacturer’s specifications. This laboratory required students to research the parameters necessary to model this engine that were not part of the data set provided by the manufacturer. The research and modeling encompassed areas such as technology level, efficiencies, fuel consumption, and performance.
The end result was a two-page report containing the students’ calculations comparing the actual performance of the engine with the manufacturer’s specifications. Supporting graphs and figures were included as appendices. The same type laboratory could be adapted for cogeneration gas turbines. Over 121 colleges and universities have cogeneration facilities on campus and that presents a unique opportunity for the students to observe the operation of a land-based gas turbine used for power generation.
A 5 MW TB5000 manufactured by Ruston (Alstom) Gas Engines is available on the Baylor University campus and is highlighted as an example. Potential problems encountered with using the Baylor University gas turbine are discussed, which include lack of appropriate engine instrumentation.
Much emphasis is being placed by ABET EC2000 (www.abet.org) on topics such as the students having an ability to design and conduct experiments, as well as analyze and interpret data; however, with budget constraints, purchasing commercial equipment for many types of practical laboratories is prohibitive due to cost. Floor space at many universities is also at a premium.
If a school has the equipment for student laboratories, leaving the equipment set up year round is often not an option. At Baylor University’s mechanical engineering laboratory, space available for use by undergraduates is very limited. The single fluids/thermal laboratory must serve as classroom, laboratory, and storeroom for any experimental apparatus.
Much of the equipment is used for demonstration purposes only once or twice each year. Due to cost and space limitations, the addition of desirable labs involving large-scale hardware is restricted. The possibility exists for virtual laboratories or computer exercises to fill some of this void. However, students need exposure to actual “hands-on” experiments with hardware to solidify much of what is learned in the classroom. There is no substitute for practical experience.
In thermodynamics, the basics of the first and second law are discussed and an introduction to the Brayton cycle is accomplished. The students learn about the individual components, such as the compressor, combustor, and turbine and link these components in a cycle toward the end of the course.
A senior elective course at Baylor University looks at the gas turbine engine as a propulsion system. The course has students design an engine cycle for an aircraft application. This includes choosing the appropriate cycle compressor pressure ratio, fan pressure ratio, and bypass ratio. After selecting these design choices, the student looks at the engine cycle’s off-design performance. As part of the course, two lessons each on rotating machinery, combustors, and inlets/nozzles are included. One lesson shows the history of the component with current technology and future trends. Without hardware, appropriate pictures of components are included for the students to see. The additional lesson develops the design methodology and shows design considerations for the components. Included in these lessons are short discussions on operational issues such as stall, surge, flame instability, and emissions. After studying these topics it would be a natural extension of the class to look at the performance of an actual gas turbine engine.
Cprop = Propeller work output coefficient
Ctot = Total work output coefficient
Aircraft Gas Turbine Engine Experiment
Several options exist to give the students an experimental laboratory experience with gas turbines when such a facility does not currently exist on campus. The simplest option, and perhaps the most costly, would be the purchase of a commercial gas turbine test system. Prices range from $30,000 to well over $100,000.
Looking at the capabilities, these machines are very versatile and offer the greatest opportunities for students to learn about gas turbines in a laboratory setting. Most engine test systems commercially offered have the capability to perform basic cycle analysis in addition to detailed experiments on component performance. The test systems also have the capability of being integrated with computers for control of the experiment/engine and for data acquisition.
However, the cost is prohibitive for most universities. At best, these high-dollar items must be budgeted several years in advance and integrating their use into the curriculum during the appropriate courses to the maximum extent possible is absolutely necessary to justify their cost.
Another option would be to design and build a gas turbine test system similar to the commercial systems. Suitable engines exist, such as those currently being used in R/C model aircraft applications. While the design process itself is beneficial, the cost is still high (about $5000 to $10,000) and the time involved with the development cycle can be long.
As part of the gas turbine propulsion elective course, the class visited the Baylor University Department of Aviation Science test facility at a local airport and was able to take data from an operating turboprop engine. Not every university has a Department of Aviation Science with such a facility. Other options to run a turboprop engine might be available from a local community college or aviation maintenance school.
Another avenue for exposure to gas turbine engine operation is a cogeneration plant, such as the one located on the Baylor University campus. This work explores the use of the Baylor University Department of Aviation Science test facility and suggests the use of the Baylor University cogeneration plant to augment Brayton cycle instruction in the classroom.
In preparation for the visit to the airfield, two lessons on turboprops are given as a precursor to the turboprop laboratory. At this point in the course the students have studied cycle analysis, component performance, and engine cycle off-design performance. Students understand performance parameters and what figures of merit are used to characterize gas turbine operation. They understand efficiency, specific fuel consumption, and specific thrust. The turboprop lessons introduce them to turboprop operation, including work coefficient. The first lecture develops the equations of performance to include the core and power turbine work coefficient. Since the course is a propulsion system design course, propeller efficiency is also discussed.
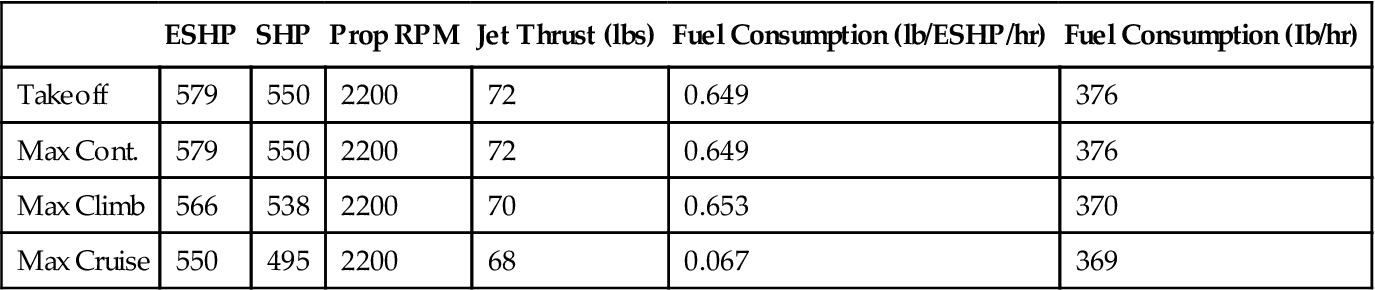
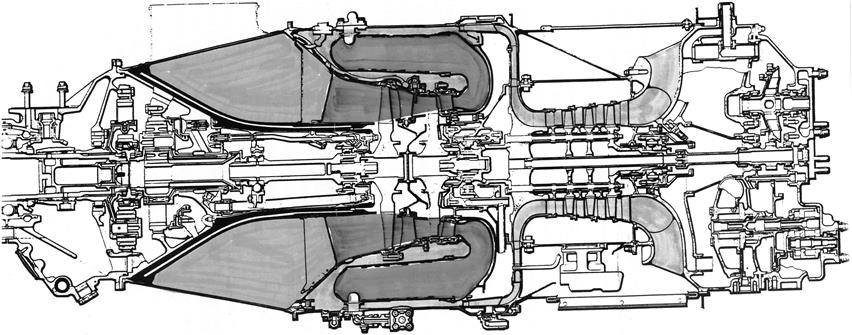
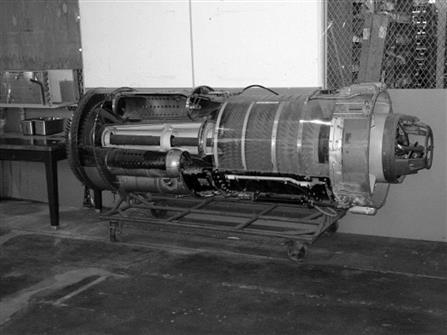
The second lecture looks specifically at the engine to be tested. The engine is a Pratt and Whitney PT6A-20 turboprop with the specifications given in Table 17–8. A cross-section diagram of the engine gas path is discussed as well as prominent features of the engine (see Figure 17–14). The students are to run the engine, collect typical cockpit data, and then model the performance of the engine for comparison to the manufacturer’s data. The laboratory requirement includes a two-page report with supporting graphs and figures as appendices.
TABLE 17–8
Manufacturer’s Data in Cockpit Instrumentation Units [17-6]
| ESHP | SHP | Prop RPM | Jet Thrust (lbs) | Fuel Consumption (lb/ESHP/hr) | Fuel Consumption (Ib/hr) | |
| Takeoff | 579 | 550 | 2200 | 72 | 0.649 | 376 |
| Max Cont. | 579 | 550 | 2200 | 72 | 0.649 | 376 |
| Max Climb | 566 | 538 | 2200 | 70 | 0.653 | 370 |
| Max Cruise | 550 | 495 | 2200 | 68 | 0.067 | 369 |
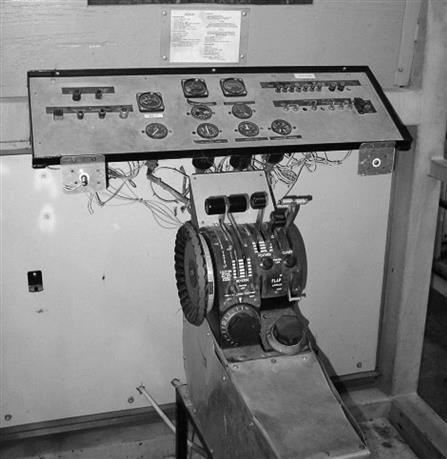
Baylor University is fortunate to have this particular engine available through its Department of Aviation Sciences. The department is focused on the development and qualification of alternative fuels. As part of their program, they have a PT6A20 mounted on a truck bed (Figures 17–15 and 17–16). The engine runs regular aviation fuel in addition to fuels such as ethanol and bio-fuels. The airfield is approximately 10 minutes from campus and is easily accessed by the students. Extra time must be allocated for this laboratory above the normal class time. The students were given one class period (approximately 1 hour and 20 minutes) for compensation but the overall laboratory takes approximately 2 hours including transit time. Upon arrival, the students were given a tour of the engine and facilities. Components, such as the inlet, starter-generator, compressor, etc., were identified by the students. The students also examined the propeller connected to the power turbine as shown in Figure 17–18. Eventually the engine technician explained the starting procedure for the engine prior to initiating the sequence. The control panel was equipped with the standard engine instruments found in any cockpit (see Figure 17–17). Table 17–9 displays the experimental data. The engine was run at five power settings and is allowed to stabilize prior to taking data. These data formed the basis for the comparison with the manufacturer data and the theoretical engine simulation.
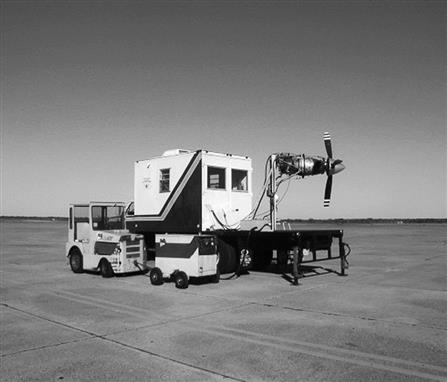
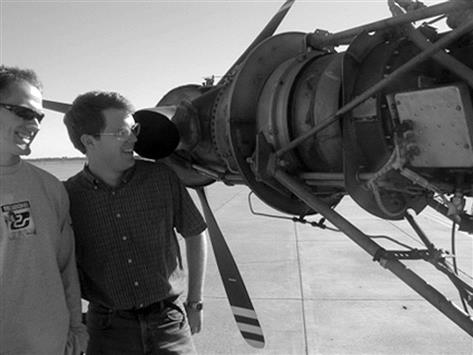
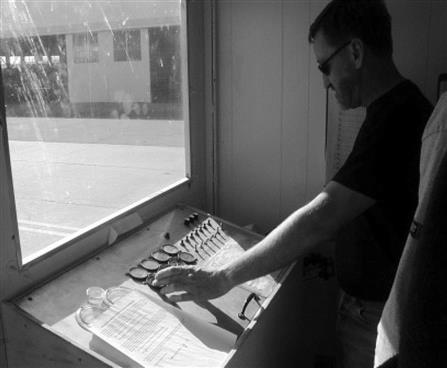
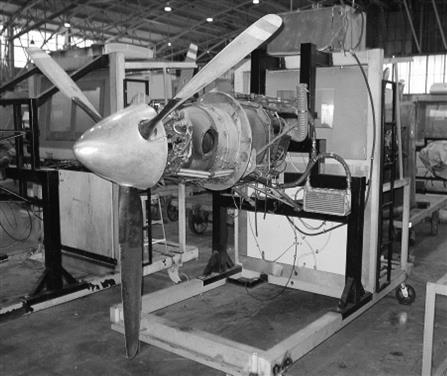
TABLE 17–9
Typical PT6A-20 Cockpit Engine Data (Fall 2002) [17-6]
| Turb inlet (°R) | 1410 | 1437 | 1482 | 1590 | 1626 |
| Torque (ft-lbf) | 100 | 290 | 500 | 850 | 950 |
| Nl RPM (%) | 51 | 70 | 80 | 90 | 93 |
| Fuel | 132.5 | 125.0 | 220.0 | 295.0 | 325.0 |
| Flow (lb/hr) | |||||
| Power (ft-lb/s) | 11,750 | 4676 | 92,153 | 176,243 | 20,353 |
| Power (hp) | 18 | 89 | 160 | 241 | 327 |
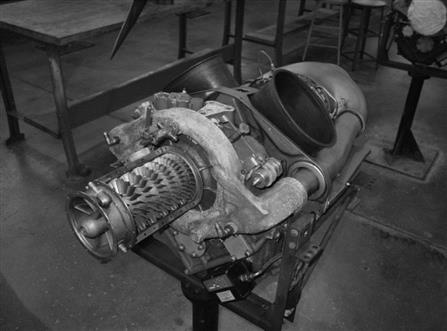
Colocated at the same airfield with Baylor University’s Department of Aviation Science is the Texas State Technical College (TSTC), which also possesses a PT6A-20 engine on a test stand. Figure 17–18 shows this test stand. It is used for students to become familiar with running an engine and test engines after their disassembly and reassembly. The engine test stand contains all cockpit controls as shown in Figure 17–19. The same cockpit data can be taken with this engine as compared to the Baylor engine. An added bonus with visiting the TSTC campus is the cutaway engines (Figures 17–20 and 17–21) and the spare parts available for viewing (Figure 17–22).
When this on-design engine was run off-design at sea level, several problems were encountered. Firstly, it was not clear where the quoted mass flow rate from the manufacturer was taken. If one assumes the mass flow rate and compressor pressure ratio stated by the manufacturer were given as the sea-level values, then the on-design mass flow and compressor pressure ratio had to be adjusted.
When this was accomplished, the original engine would not run at sea level and input values were changed to determine a combination that would work. After much iteration, the mass flow and compressor pressure ratio were correct for sea level, but the power distributions between the core and the propeller had been changed significantly. More research must be done to find the proper engine data to provide a more accurate model. Calculations were made with engine data, as shown in Table 17–9, but the engine was not able to be run at maximum power on the ground.
As stated previously, some problems were encountered finding parameters, such as efficiencies, and the calculated output did not always closely match the manufacturer’s data or the experimental results. The exercise was valuable, as the students learned to do a sensitivity analysis for the various input parameters to decide which parameter might be in error and by how much.
Cogeneration Gas Turbines
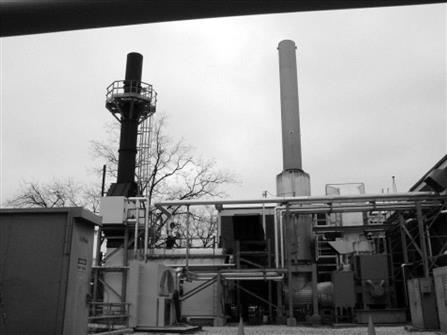
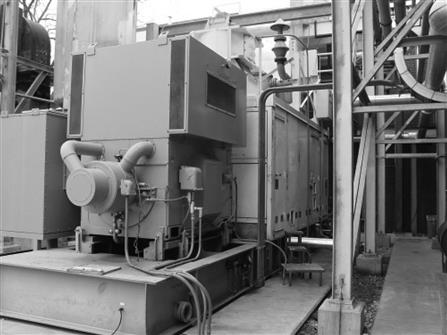
Another alternative to the aviation gas turbine is the cogeneration plants. Baylor University is one of over 121 colleges and universities across the United States that has such facilities on campus. Baylor’s cogeneration plant is located in the center of the campus and generates approximately 4.1 MW of electrical power 24 hours a day for seven days a week.
See Figures 17–23 and 17–24 for pictures of the facility. The gas turbine is a 5 MW TB5000 manufactured by Ruston (Alstom) Gas Engines installed in 1989. It uses exhaust gases to heat water and also includes a mister for the inlet to increase performance during the hot Texas summers. The thermodynamics and freshman orientation classes have been visiting the facility as a field trip. The purpose of these trips is to expose the students to power generation as an illustration of the cycles discussed in class.
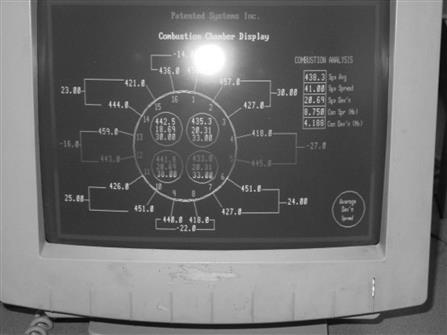
Of all the colleges and universities listed with cogeneration facilities, only one has made academic use of the facility. The University of Florida had a laboratory/control room simulator with “read-only” computer output. At this time the website is no longer functional, indicating the university has suspended this program. At Baylor University, not enough parameters are being monitored by the facility to enable calculations of performance. The energy complex at Baylor University is only concerned with electrical power output and not with efficiency. More work could be done to look at the possibility of instrumenting the engine to take engine health parameters. Discussions are in progress to explore possibilities. Any data would be taken from existing monitoring screens as shown in Figure 17–25.
In summary, this work investigated several alternatives to purchasing commercial gas turbine demonstrators. Using an aviation gas turbine on a dedicated test stand is the option discussed in the paper, however, facilities at either a local community college, aviation maintenance school, or at a fixed-base operator at the local airfield could provide a suitable alternative.
As an alternative to the turboprop laboratory, cogeneration facilities exist at numerous colleges and universities. These facilities are underutilized and could be developed for academic purposes.
Case Study 6: OEM Working with Several Universities on Gas Turbine Prototype Development9
The Siemens H-class system (Figure 17–26) is the result of an intensive R&D program to evolve a competitive, efficient, and flexible fully air-cooled engine (Figure 17–26). It is also the first new frame to be developed since the merger of Siemens KWU and Westinghouse aiming to combine the best features of both companies’ existing product lines with advanced technology.
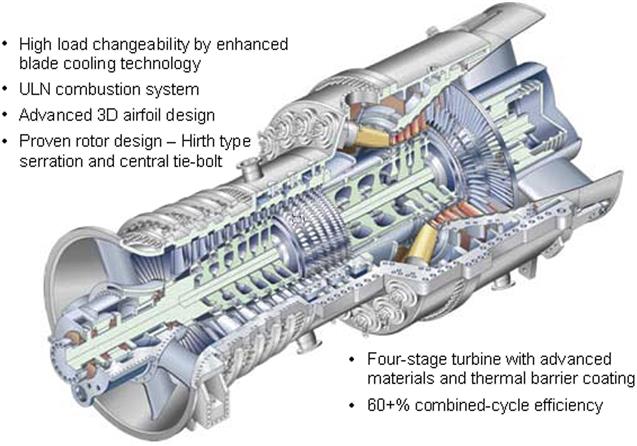
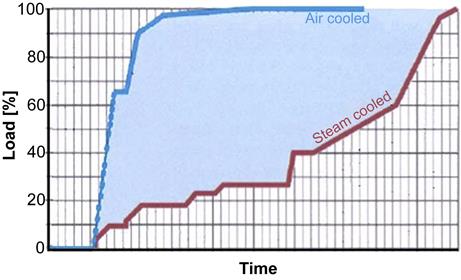
With less complexity in the engine and plant leading to greater operational flexibility, the fully air-cooled engine offers a much quicker startup time than a steam-cooled system, as shown in Figure 17–27, e.g., a hot restart to base load within less than 1 hour.
Extensive component, subcomponent and material testing were performed in the development phase of the SGT5-8000H. Materials testing focused mainly on thermal and mechanical properties. Subcomponent tests involved testing of key features of individual components, for example blade cooling holes. Component testing involved testing of actual or scaled parts under conditions that simulated actual engine conditions as closely as possible. Most of the key gas turbine components (including the turbine and secondary air system as presented below) have already been pre-validated by a number of tests. For example, testing programs were conducted or are in process at the following sites:
• Texas A&M University (College Station, Texas), high Reynolds number turbine airfoil, advanced trailing edge for film and heat transfer, labyrinth seals
• Northeastern University (Boston, Massachusetts), high Reynolds number turbulated channel augmentation and Impingement Leading Edge
• Forschungszentrum Karlsruhe GmbH (Karlsruhe, Germany), high Reynolds number turbulated serpentine channel and pressure drop
• Virginia Tech (Blacksburg, Virginia), impact of turbulence on turbine airfoil film and heat transfer
• University of Duisburg (Duisburg, Germany), pre-swirl particle separation
• Siemens Mülheim Testing Lab (Mülheim, Germany), pre-swirler effectiveness/aerodynamics, advanced sealing concepts
• University of Central Florida (Orlando, Florida), Florida Turbine Technologies, aerodynamics and heat transfer
• Siemens Berlin Test Facility (Berlin, Germany), turbine component testing
The validation effort is culminating in an 18-month prototype test program that began in December of 2007 at E.ON Energie’s Irsching, Germany, power plant. Figure 17–28 shows an external view of the SGT5-8000H.
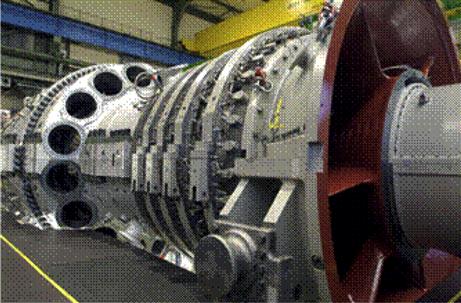
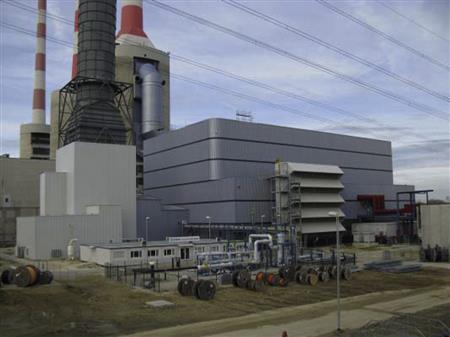
Figure 17–29 shows the SGT5-8000H prototype power plant.
Turbine Validation
As previously mentioned a number of universities and institutions were selected early on to conduct generic research studies to support the down selection of technologies that would be incorporated into the final design phase. After several airfoil designs had reached a sufficient level of maturity component specific test programs were initiated to support the overall risk mitigation and validation strategy. Two of the more comprehensive test programs concentrated on the first stage highest customer value including performance and operational availability.
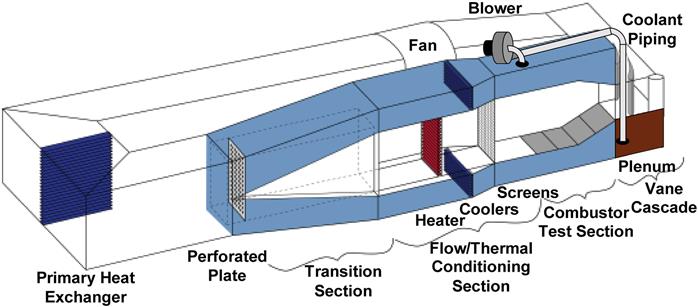
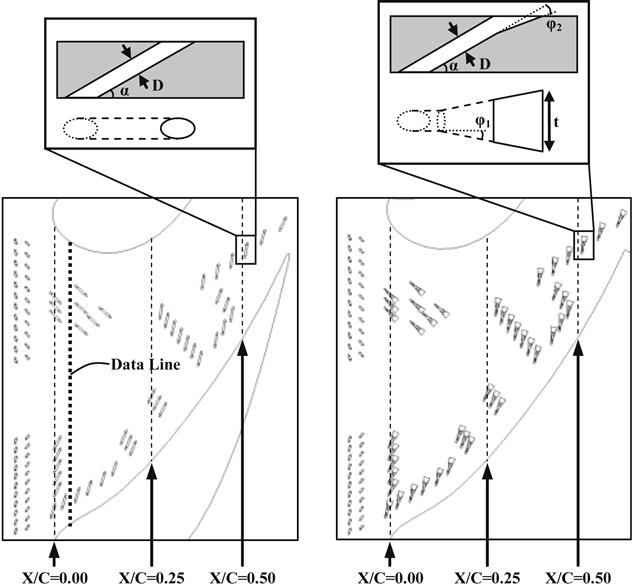
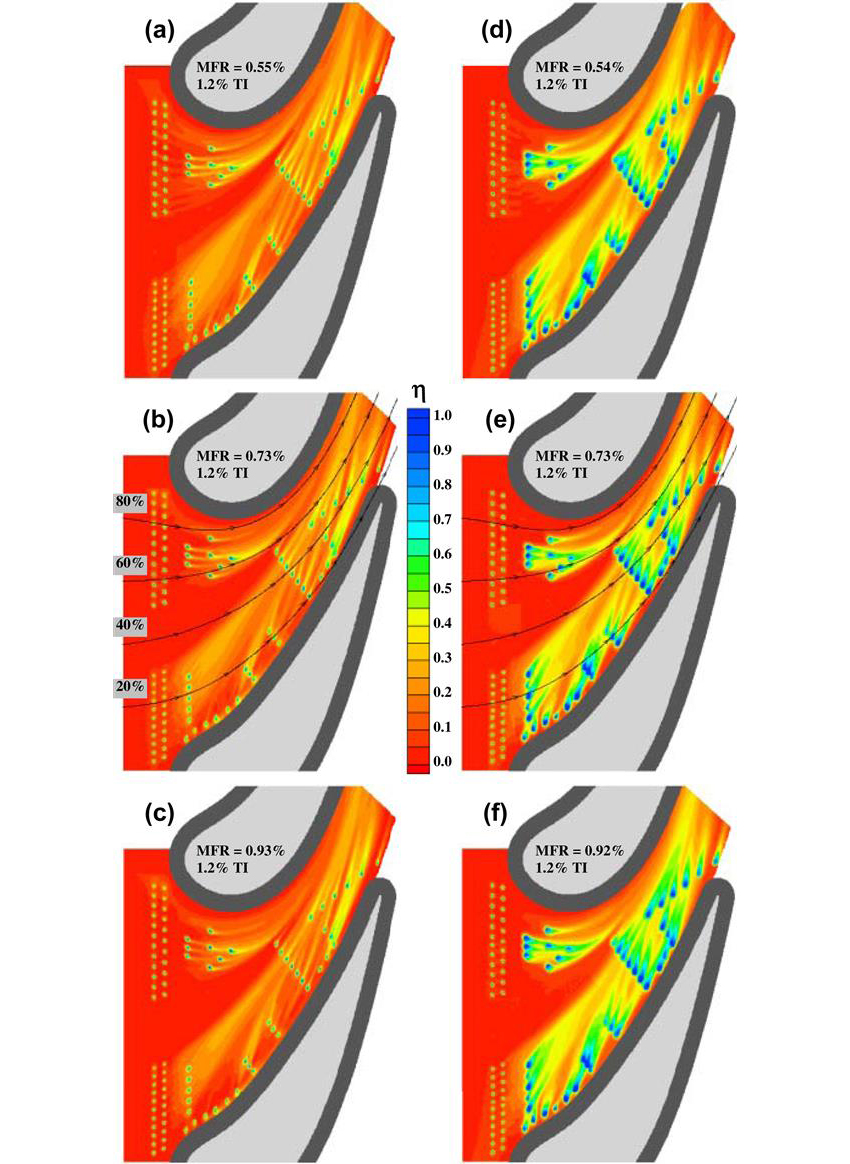
Figure 17–30 provides a general overview of the wind tunnel at Virginia Tech where the first vane heat transfer and film cooling tests were conducted on both the airfoil and endwalls (see Figures 17–31 and 17–32). Although there are numerous papers that have investigated the impact of shaped holes on film effectiveness on flat plates, there is little information found in literature on the impact on airfoil and endwall surfaces. Due to the additional cost of incorporating shaped geometries for cooling holes, additional detailed information was required to verify that the increased cost for manufacturing was offset by a reduction in cooling flow.
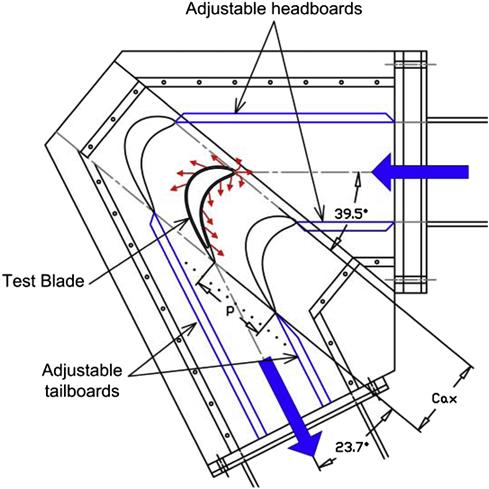
The CASCADE test that was conducted at Texas A&M followed a similar philosophy as the Virginia Tech test program, in that the results needed to prove that their incorporation produced the best overall LCC for this particular component. In order to improve data relevance, the CASCADE testing facility was upgraded to achieve near full engine design inlet Mach numbers. Figure 17–33 provides a general overview of the CASCADE test facility.
Turbine Testing Validation
The final assembly of the SGT5-8000H was conducted at the Siemens Berlin manufacturing plant. (Consult the source for details of the testing methods and other details.)