
Controls, Instrumentation, and Diagnostics (CID)1
Abstract
Potential diagnostics on a system have reached a new level. Today, “artificial intelligence” is possible, allowing software to “select” a “solution” from a matrix of parameters, potential problems, and solutions. In most cases, artificial intelligence works better on highly monitored test systems, such as some of the cutting-edge research being done by the US Air Force laboratories. Most software monitors today can retain a “snapshot” of the condition at the time of its occurrence and over a predesignated time interval before and after it occurs. However, the actual prevention of such occurrences depends on overall system sophistication to a point. In other words, the old paradigm still holds: “Garbage in, garbage out” with respect to all software programs. There is not much use in providing a system with relatively crude controls (or instrumentation) with a high degree of sophistication in diagnostic potential. The mismatch will result in errors, few results of accurate significance, and, worst of all, a false sense of security.
Keywords
Diagnostic systems; controls; instrumentation; CID technology; optical pyrometery; digital telemetry
“Enjoy the little things in life, for one day you may look back and realize they were big things.”
—Antonio Smith
System Scope and Selection for Gas Turbines
Controls and instrumentation on contemporary gas turbine engines serve several purposes. They include but are not limited to:
1. Providing the operator with indicators in terms of pressure, temperature, vibration, strain, and other parameters that give the operator a snapshot of how the gas turbine and gas turbine system is performing.
2. Making life easier for the operator in terms of providing a sometimes automated means to control a system with less manual labor and, in some cases, less “guessing.” However, with complex systems, the easier the system is to operate, the higher the level of operator knowledge required.
3. Providing owners and operators with a means of controlling a turbine system remotely.
4. Coupled with PLCs, Pentiums, and other software, they provide an operator with an ability to diagnose the problem on a system.
With the advent of complex software architecture and other technology, such as fuzzy logic, potential diagnostics on a system have reached a new level. “Artificial intelligence” is now possible, allowing software to “select” a “solution” from a matrix of parameters, potential problems, and solutions. In most cases, artificial intelligence works better on highly monitored test systems, such as some of the cutting-edge research being done by the US Air Force laboratories. The “intelligence” can work with only the data it is given, however. “Real-world” systems are prone to mishaps, such as operators knocking into things (like sensitive proximity vibration probes), systems undergoing sudden surges, or excursions in temperature.
Most software monitors today can retain a “snapshot” of the condition at the time of its occurrence and over a predesignated time interval before and after it occurs. However, the actual prevention of such occurrences depends on overall system sophistication to a point. For example, if a gas turbine system is running with a crude fuel of variable quality or is designed for only gaseous fuel (and prone to slugs of liquid in the gaseous fuel), or tends to surge when it takes in a “mouthful” of sooty exhaust (when close to the discharge of a wing-mounted weapon system), that system will always be prone to spikes in operating parameters.
These spikes can often confuse an intelligent system if they were not part of the original programming. In other words, the old paradigm still holds: “Garbage in, garbage out” with respect to all software programs. Also there is not much use in providing a system with relatively crude controls (or instrumentation) with a high degree of sophistication in diagnostic potential. The mismatch will result in errors, few results of accurate significance, and worst of all, a false sense of security.
Which Parameters on What Applications2
Observations made on CMS or ECMS (engine condition monitoring systems) proposals and purchases in large plants include a case where a highly sophisticated system was being recommended as part of the retrofitting for a thermal power plant. The thermal plant had a large number of turbines, conservative in terms of peak operating temperatures. The turbines were steam turbines, but the following illustration might apply equally to a mature gas turbine fleet. The fleet had been operating relatively trouble free for about 20 years, as had the associated boiler feed pumps. The original OEM-supplied CMS would not have managed the parameter accuracies a newer turbomachinery system might require, but it was adequate for the limited temperature ranges and vibration those conservatively designed steam turbines and feed pumps would ever see.
One recommended system for power generation units would have been appropriate for the test cells of the latest in 90,000 pound plus thrust development aeroengines. Its specification described an expert system that also included instruments for remeasurement of basic parameters already measured on the existing system. For the turbine generator(s):
• Displacement probes vibration monitoring (VM)
• Dual thrust position monitoring
• Dual case expansion monitoring
• Differential expansion monitoring
• Dual valve position monitoring
• Rotor speed indicator (all of these with panel indicators)
For the boiler feed water pumps:
• Accelerometer monitoring for two positions on the hydraulic coupling
Such a system might measure basic parameters to greater accuracy than the existing system, but greater accuracy for these parameters in this application was not necessary. The “expert system” then went into specific, in some instances overconservative, specifications with respect to:
• Operating temperature ranges of transducers
• Temperature sensitivity of probe and cable
• Differential pressure withstanding (of gear oil) potential of transducers
• Double braiding of shields on cables
• Environmental specifications
• Transducer frequency response range
• Relay configuration and contact ratings
• Calibration reprogramming or disabling of any monitor
• Online continuous monitoring
• Expert system diagnostics and a whole host of other factors that could effectively eliminate vendors that otherwise would be competent to supply CMS for the turbines and pumps in question
What might have been more to the point for turbines already advanced in total operating hours (with excellent availability history) was continuous monitoring for creep fatigue degradation. The need for this expense, too, would need to be assessed in terms of where the turbomachinery components lay on their stress endurance curves for normal operation and abnormal cyclic operations. Existing earlier methods would have used measurements taken from thermocouples and pressure transducers to perform offline calculations and used conservative design codes. The online method system supplied by some vendors has the potential for entering data from inspections at shutdown, modeling future potential temperature excursions, storing data for trending, and visual, real-time displays, some of which can be incorporated into LCA (life cycle assessment) counters.
In summary, the effectiveness of controls and instrumentation in performing their functions (which includes diagnostics) depends on their successful integration into the overall gas turbine system. In Chapter 10 on performance optimization, there are cases where the retrofit CID packages for PA, LCA, VA, or ECMS purposes or as part of power augmentation or metallurgical component life extension projects are far newer than the basic turbine, both in terms of actual service age or technology level. In these cases, the retrofit can succeed, but only if its appropriateness for the entire system is carefully considered during engineering retrofit design.
Basic Controls and Instrumentation (C&I) on GT Systems
At the 1984 ASME IGTI annual meeting, I noted that the control display portrayed in a presentation on offshore gas turbine systems closely resembled that of a HUD (head up display) of the gas turbine engines on a fighter aircraft. The annual IGTI session on “ECMS as They Affect Gas Turbine TBOs (time between overhauls) and Component Lives” was thus born.
Attendees at this panel session were, for the most part, operators who are prepared to learn from land, sea, and air users, regardless of where their turbines operate. The technology gap between land, sea, and air applications used to be considerable, with the most sophisticated technology deployed on military aeroengine applications. Large commercial aircraft engines, commuter aircraft engines, land-based aeroderivative engines, and land-based industrial engines followed, more or less in that order. When there was this distinction in terms of level of sophistication, very few gas turbines were used in marine applications. The contemporary stakes being what they are in terms of fuel efficiency, risk insurance, and environmental legislation and taxes, the sophistication boundaries first blurred and now are all but nonexistent for new installations.
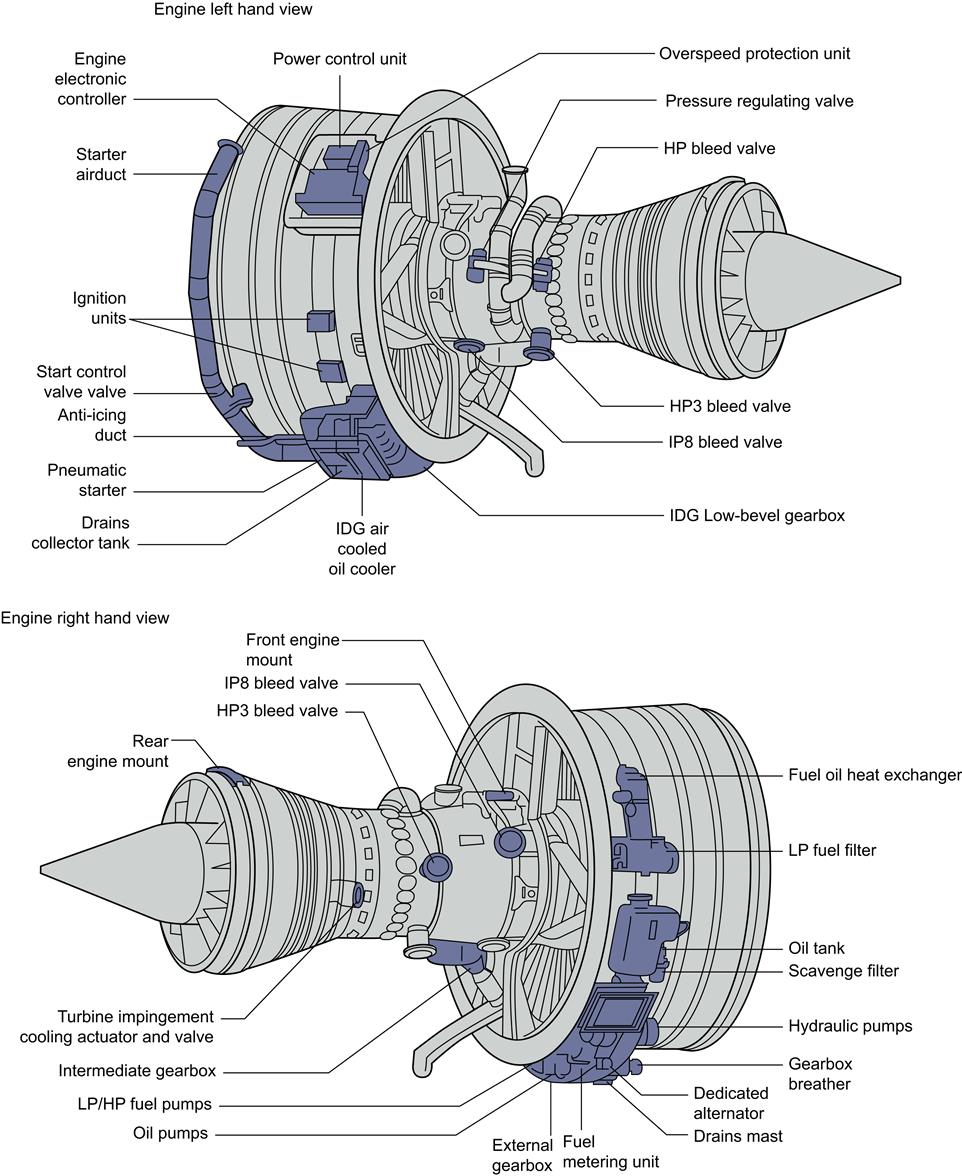
The controls and instrumentation basic description that follows is for an aeroengine gas turbine; however, the reader can find system commonality with its features in land or marine applications. The analog dial gauges illustrated in this subsection are quite common on numerous plants that were supplied and commissioned before the digital age. Newer systems have digital gauges and readings. Later in this chapter, C, I, and D features of nonaeroengines also are discussed.
The gas turbine engine has many different applications, each with different requirements, and therefore each with its own control equipment and system architecture. However, the basic principles and functions of a gas turbine control system are essentially the same for all applications.
Principles and Functions of a Control System
After initial checks, the control system is required to start the engine, and accelerate it safely to a point where the gas turbine can sustain its speed without starter power and is stable (idle speed). Thereafter, the pilot or operator will require various levels of power output, depending on the operation required. The control system accelerates or decelerates the engine by changing the fuel flow and manipulating compressor variables (and others) to ensure the maneuvers are smooth and surge-free. During deceleration, care must be taken not to reduce fuel flow below the point at which combustion would be extinguished. When the pilot or operator shuts down the engine, the controller sets fuel flow to zero, and the engine decelerates to a stop. In some applications, further tasks are carried out to ensure that maintenance on the engine can be carried out safely and the engine is prepared for the next start. Before, during, and after the operation of the engine, data are transmitted by the control system for display to the operator.
Expressed in these terms, the control system's task is simple, but there are some additional complexities. For example, determining the engine power required by the pilot or operator involves a rating calculation, which, in an aero-engine application, involves flight condition (altitude and Mach number) and takes into account the non-propulsive power being extracted for aircraft services. Thus, for a given nominal power demand from the aircraft during climb, actual power will be varying continually.
The control system also has to perform self-checks; it ensures it is operating without failures and it must not be working with incorrect data—either situation would result in erroneous control decisions or incorrect data being sent to the pilot or operator. The rigor of the design and analysis of the control system reflects the safety, economic, and other consequences of such an error.
Above all, the control system must ensure that the engine is operating safely within its defined limits, even if the engine or control system fails. In some circumstances, the control system has no alternative but to shut down the engine—for instance, if there is a danger of rotor overspeed because the electronics can no longer control the flow of fuel to the engine. There is nothing the electronics can do in these circumstances and the rate of change of fuel flow may be too rapid to expect the operator to intervene. For this reason, all systems have independent means of measuring a limited set of data (typically rotor speeds) and commanding an immediate engine shutdown, or some other safe state, if set limits are exceeded. The control system contains many features designed to provide this safety protection, and the design and testing of these features is a major part of the designer's task.
Control Laws
Each manufacturer has different control strategies, and each engine type has detailed differences in its control laws. However, aerospace applications place certain common requirements on control:
• An engine must be able to accelerate from low power to high power in a fixed time so that an aircraft can abort a landing and achieve max take-off thrust—for example, to avoid a runway obstruction. The control laws may use a closed loop acceleration algorithm, where rate of change of speed is a function of current speed, to ensure that at a given condition acceleration time is always the same.
• As an engine wears during its life, the thrust it provides at a given condition must remain above a certain level if the aircraft is to achieve its take-off performance. Thus, a parameter must be chosen which provides a close measurement of thrust, and any inaccuracy in the measurement compensated by providing additional power. The control system must then control to that parameter very accurately.
• An engine must accelerate from stationary to idle in a reasonable time in order that the aircraft can taxi under its own power. The starting algorithms must accelerate the engine at a rapid rate, avoiding any stall or stagnation regions.
• The pilot must always be able to shut the engine down—the system's hardware must provide a separate mechanism to allow the pilot to override the control system if required.
• Above all, an engine must always be operated within its safe limits. The control system, therefore, must be programmed with data on all the relevant limitations and the action to be taken if such a limitation is approached.
This is necessarily only a small subset of the engine control requirements and consequences on the system (see Figures 9–1 to 9–6).
Components of a Control System
The complex functions described above are performed most effectively by digital electronics. All modern engines feature this form of control, and many older engine designs have been modified to include it. However, there are some purely mechanical control systems in service.
Control systems for aerospace (and some marine) applications often use bespoke electronic and mechanical equipment because these applications have limited space for their systems, which must also be low in weight. Energy and other marine applications do not have the same restrictions so their control systems can be implemented using equipment closer to industrial standards.
A typical engine control system has many constituents:
• An electronic controller that computes and commands the control functions; it contains one or more microprocessors and other circuitry, which read data from sensors, and control actuators and valves.
Engine parameter sensors, including pilot power demand and feedback signals from actuators.
A means of metering fuel being delivered to the engine, and of shutting the fuel off.
• Actuator systems to provide variable geometry control and/or modulation of secondary systems (for example, bleed valves, variable compressor stator vanes and tip clearance control actuators).
• An electronic ignition system to generate high voltage sparks at the surface of an igniter plug in the combustion chamber, required to initiate combustion, which is then self-sustaining.
The most common form of starter is an air turbine system connected to the accessory gearbox. High-pressure air is used to rotate the HP turbine.
• A means of communication with the vehicle or plant systems. Today, this is usually with an electronic serial databus using an industry standard appropriate to the application, bandwidth, and integrity requirements.
• Separate systems dedicated to ensuring that control system failures cannot result in a dangerous condition.
• The other “component” of the system is the software in the microprocessor, which has to implement the complex functionality required. There are different standards for the development of this software in different industries.
Aeroengine Control Systems
Civil Aircraft Engine Controls
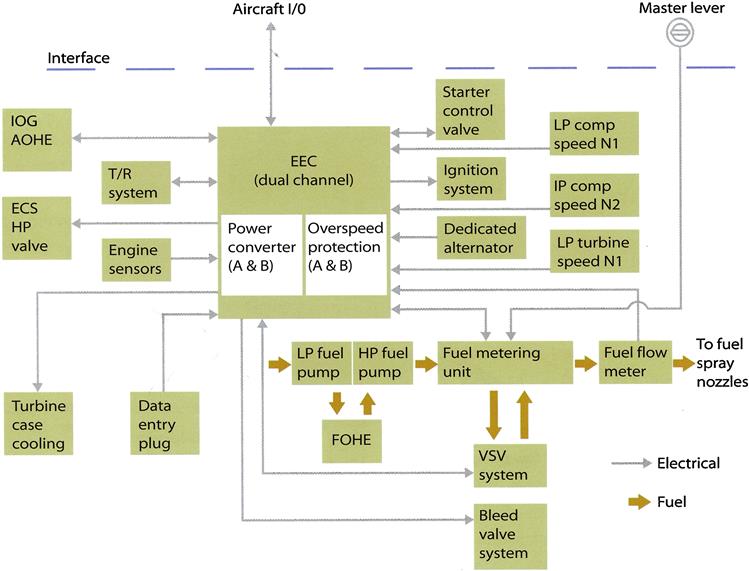
Controllers for modern engines are based on digital electronics. For historical reasons, the collection of control system elements in an aero engine is often referred to as the Full Authority Digital Electronic Controller (FADEC).
The components of a FADEC system are similar to those described in the general system above, with typically the following additions:
Engine Electronic Controller
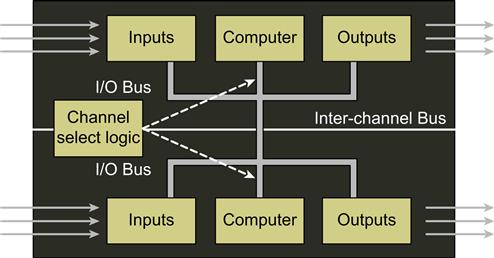
At the center of the FADEC system is the engine electronic controller (EEC). The stringent requirements for safety and availability of an aero engine cannot be met with simplex electronics. For this reason, FADEC designs generally include two channels of electronics, sensors, wiring harnesses, and duplicated electrical parts of actuators. So that the system is fully operational following a single electrical or electronic failure. The two channels within the EEC include features that enable them to exchange data, which are used to detect failures in the system and to allow continued operation. However, the channels must be designed so that a fault in one channel cannot propagate to the other.
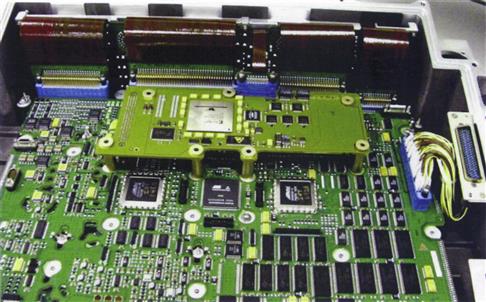
In some cases, the two electronic channels are housed in separate enclosures, but more usually, they are contained in a single unit. The EEC may be installed in the airframe, particularly in military aircraft or in civil fuselage-mounted engine installations. For wing-mounted engine applications, typical of large civil turbofans, the EEC is mounted on the engine. This installation places particularly harsh environmental requirements on the electronics, while further emphasizing the need for low weight and volume—a need reflected in the components used, the construction techniques, and mounting arrangements. One environmental threat, particular to electronic systems, is electro-magnetic radiation from, for example, lightning (both on the ground and in the air) and airport radar. The substantial connector housings used are in part designed to help alleviate these threats.
The EEC reads data from the sensors, other information from the aircraft avionic systems, and the pilot's inputs to calculate the new required position of the actuators, and uses its drive circuits to move them, often by means of secondary servos in the actuators. It also transmits data relating to the engine condition back to the aircraft, along industry standard serial data busses. The aircraft manufacturer is responsible for deciding which data are displayed to the pilot, subject to certification rules and the engine manufacturer's installation manual.
The EEC gathers information on any failures it has diagnosed within the electronics, the remainder of the FA DEC system, or in some cases in the gas turbine itself. This information is transmitted to the aircraft systems, but if the system considers itself to be in a safe configuration and no action is required in flight, the information is often not displayed in the cockpit—it is available to the pilot if required, but is intended for use by maintenance personnel on the ground.
This fault information may also be stored within the EEC itself for retrieval by the ground crew and may include more detail than is transmitted to the aircraft. Should the EEC be removed as a result of a suspected failure, these data are also used to assist in the diagnosis of the fault at the repair base.
Fuel Metering Unit (FMU)
In a FADEC system, a single unit is dedicated to accepting fuel from the piiDlping system and uses inputs from the EEC to meter the flow of fuel to the engine. A proportion of the high-pressure fuel supply is used, after appropriate filtering, to power a hydraulic servo system, which operates valves within the unit. One of these valves maintains a constant pressure drop across a port in the sleeve of a second valve.
A two-stage servo uses the electrical current from the EEC to position a piston within this sleeve, which opens or covers the port. In this way the current is related to flow by the shape of the port in the sleeve. A feedback device measures the position of the piston and the reading used by the EEC to assist in control, and to ensure that the position and hence flow control is operating correctly.
The servo supply is also used to power other hydraulic circuits within the unit, for example, the fuel shut-off valve. In response to electrical signals from the EEC, it can also power the actuators controlling, for example, variable stator vanes in the compressor.
Actuation
Actuators can use various power sources, in addition to high-pressure fuel:
• Pneumatic systems are simple and rugged, but heavy and relatively slow in response.
• Hydraulic systems offer high levels of power and response, at a low weight, but require complex ancillary equipment.
• Low-pressure fuel systems have relatively low power but are sufficient to move components such as inlet guide vanes.
• Direct electro-mechanical systems, which offered low response times and were relatively heavy, can now be replaced with more modern technology, ensuring that they are lighter, less bulky, and operate at significantly higher speeds.
Fuel Pumps
The pumping system has to be able to deliver sufficient fuel flow to the engine under all conditions and at pressures high enough to overcome the gas pressure in the fuel spray nozzles generated by the engine compression system. Flow is also required to power the servo systems. The pumps are driven from the engine accessory gearbox.
The input pressure to the pumping system depends on the aircraft fuel system; in some cases, the engine pumps are required to continue to feed the engine with fuel if the aircraft fuel pumps fail—the engine pumps would then have to deliver fuel from the aircraft tanks. Generally, it is not possible to provide the suction and fuel pressure required with a single pump, and so two pumps are often used in series: a low-pressure centrifugal pump provides suction and delivers fuel to a high-pressure pump (most commonly a positive displacement gear pump), which in turn delivers fuel to the FMU.
In all cases, the pumping system must deliver enough fuel for the engine. The nature of the positive displacement pump sets a unique relationship between speed of rotation and flow delivered, resulting in more flow from the HP pump than is required by the engine. To accommodate this, the FMU returns unwanted fuel to the inlet of the HP pump, which then recirculates it. A consequence of this can be excessive heating of the fuel as it is repeatedly compressed and decompressed. A cooler is often required to dissipate this heat.
Bleed Valves
Many engines include bleed valves in the compression system, which allow intercompressor flows to be matched at low speeds. The position (open or closed) of these valves is signaled by the EEC, and fuel, electrical, or pneumatic servo systems are used to actuate them.
Electrical Power Supply
The reliability and availability of the electrical and electronic parts of the system are dependent on the quality and reliability of the electrical power supply. Each channel of the FADEC system requires independent power and, for aircraft, this is typically provided by a dedicated, gearbox-mounted generator. Aircraft power is also supplied for starting, and to provide a backup should the dedicated generator fail. In some military aircraft, only aircraft power is used, mainly because of the dependability of the aircraft supplies.
Software
The software embedded in the EEC defines the system behavior. The performance of this software is therefore vital to the operation of the engine. The software is generated from the requirements using disciplined processes and extensive testing. These processes are defined in industry standard documents and guidelines. Software developed to these standards is expensive to generate and can take a considerable time, particularly due to the effort required in testing and qualification. Software tools and techniques are becoming available to reduce this effort but these are far from mature.
Indication Systems
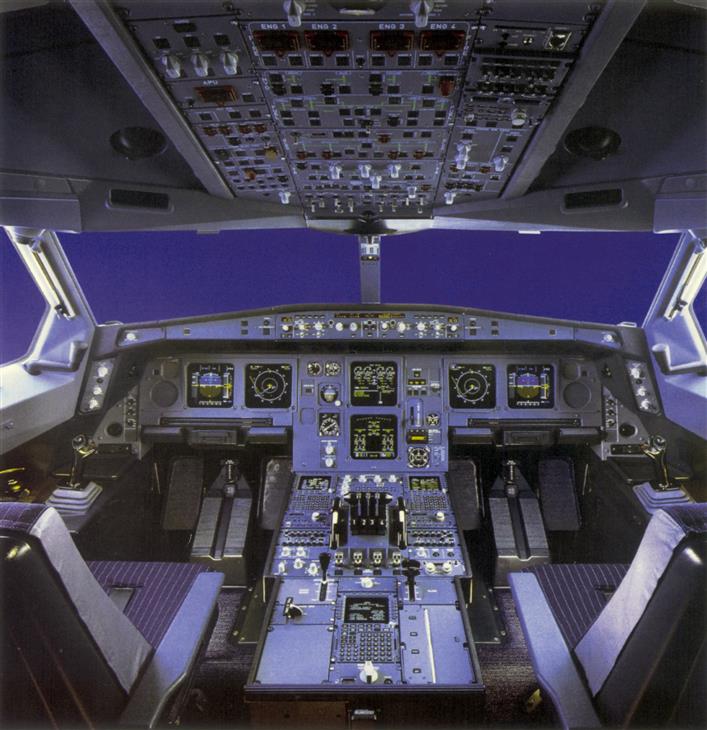
In modern systems, data from the control system and other sources is displayed on one or more display units mounted in the instrument panel; multi-function screens, which display basic engine data such as rotor speeds, turbine temperature, and power, have replaced the multitude of dials and individual instruments found in older aircraft. The multi-function screens are programmed to reconfigure themselves to display other data in response to abnormal circumstances, or as required by the operator. The information is displayed on the screen in the form of virtual dials with digital readouts and warnings; cautions and advisory messages are shown as text. A mimic diagram representing the physical layout of the equipment may be provided to assist in locating a problem. The displays are color-coded and, when necessary, linked to audible warning systems so that the operator is aware of the severity of any problem.
In military aircraft, these data may be displayed using a “head up display” (HUD). The HUD system projects information and instrument images onto the screen in front of the pilots.
Using this technology means that pilots do not have to divert their attention from the view around them. On some applications, information can also be shown on the visor as part of the headgear worn by the pilot.
Engine Health Monitoring
It is in the interests of all customers to minimize the cost of operation of the gas turbine and its associated equipment.
The costs of operation include fuel, scheduled maintenance, and unforeseen events that result in the engine not being available when required. Monitoring systems can help to reduce all of these costs. Scheduling of major engine maintenance (for example, to restore performance after many hours of operation) is a complex economic decision for which monitoring systems can provide important supporting data.
Although it is not strictly part of the control system, the EHM electronics are often housed within the control system enclosure, and the two systems are to some extent integrated.
It is important to note, however, that the safety requirements of the two systems are different and the design of each, and their integration, must reflect this. A function in the monitoring system cannot be adopted for use in the control system without considering the reliability of its implementation.
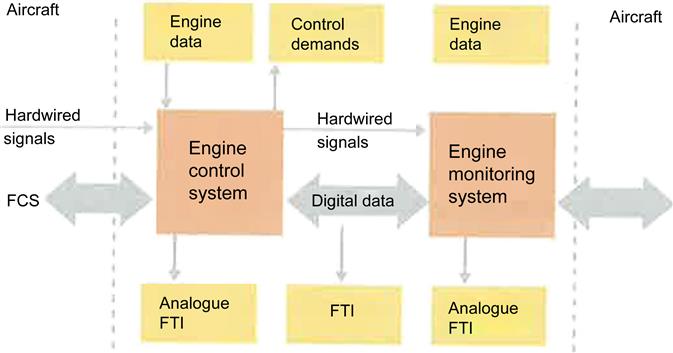
Data from the EHM systems are not generally available to the flight crew. Large amounts of data are stored although data reduction and analysis algorithms are used to make storage requirements more reasonable. Aircraft systems are used to transmit the data to a ground station, which in turn will forward the data to a center where further analysis can be carried out in order to inform maintenance logistics (Figure 9–7).
Sensors
Whatever the particular application, a series of parameters needs to be measured at various locations around the engine system in order to control the engine and provide useful indication of performance to the operator. Typically, these are temperature, pressure, and speed measurements. The transducers used to take these measurements are chosen on accuracy, response time, and durability requirements.
Temperature Sensors
Thermocouples
Thermocouples are used to measure high temperatures, typically at HP compressor exit, and in and around the turbines. The temperature of the gas in the turbine is measured at several radial and circumferential positions in order to even out any local temperature variations due to turbine entry temperature traverse effects. Thermocouples have the advantage of being very reliable, small, and cheap; they also have a relatively quick response time over a large temperature range, and generate their own output—and so do not require an external power supply. However, thermocouples are easily damaged, and can lose accuracy through oxidation (Figure 9–8).
Resistance Temperature Devices
These devices are most often used to monitor engine intake air temperature. They consist of a platinum coil, exposed to the airflow, which changes its electrical resistance with temperature. Often, the device will consist of a single probe with a twin output and a heated body for anti-icing. The advantages of these sensors are that they are resistant to damage (when in a housing) and give very accurate outputs with long-term stability. However, they have a slow response time when in a housing, need a constant current source to operate, and are relatively expensive.
Pyrometer
In this method, an optical device is used to view, for example, the turbine blades, connected to an infrared (IR) detector by a fibre-optic cable. This method enables rapid, accurate measurement of temperatures. However, a compressed air supply is needed to keep the lens clean, and the output needs sophisticated signal processing.
Pressure Sensors
Pressure sensors broadly divide into those required to provide high accuracy, and those that focus on transient response. Accurate measurement is required when pressure ratio is used to measure engine thrust. Transducers based on a variety of technologies are used for this purpose, but they generally need electronics to support their operation or to provide calibration information, and therefore the assembly is usually housed within the EEC, which can involve quite long pipe runs. If high bandwidth is required, simpler transducers, often based on strain gauge technology, are used and may be mounted close to the engine to avoid pipe delays.
Rotor Speed Sensors
Types of speed sensor include tachogenerators and magnetic variable reluctance (VR) probes. A tachogenerator is a shaft-driven, electrical generator with a variable frequency output, which is related to speed. These devices are very rugged, but produce a relatively low output signal. If a VR speed probe is used, it is positioned on the compressor casing in line with a small disc, which has accurately machined notches on its circumference and is mounted concentrically on the shaft. Rotation of the shaft results in a current being induced in the probe with a frequency content proportional to engine speed (Figures 9–9 and 9–10).
Position Measurement
Position measurement is used to confirm that actuators are operating correctly and to assist in closed loop control. There are three main types of device used: the LVDT (linear variable differential transformer), RVDT (rotational variable differential transformer), and the resolver.
An LVDT consists of three adjacent coils of wire wound around a hollow form through which a core of permeable material (such as steel) can slide freely. The middle winding is known as the primary coil, and is excited by a relatively high frequency AC voltage. This sets up a magnetic flux, which is then coupled through the core to the other two, secondary windings, inducing a voltage in them. When the moving core is centered between the secondary coils, the voltage induced in them is equal and opposite. If the core is displaced, then an imbalance is set up, creating a voltage that can be read and calibrated to give a position.
RVDTs and resolvers are based on similar principles, but are used to measure rotational angles.
Vibration
Many engines are fitted with sensors that continuously monitor the vibration level of the engine. Indication of excessive vibration is shown on the control display unit using signals from engine-mounted transducers. There are three main types of vibration sensor:
• Piezoelectric accelerometers produce a very low value charge signal through deformation of a crystal lattice, and require the vibration signal to be processed using a charge amplifier and sophisticated cabling.
• Piezoresitive accelerometers change their resistance relative to an applied stress, and are easy to use and install, but require a separate power supply.
• Velocity pickups produce a voltage signal from a magnet moving in a coil, are easy to install, and require simple processing.
Safety and Availability
Safety is the most important design consideration in any gas turbine or installation; another high priority is availability—the loss of power from an engine, although not necessarily a safety hazard, can cause severe operational disruption. The duplication of the electrical elements of the system is evidence of this concern. Rigorous analyses and testing are necessary to ensure that faults in the system are correctly accommodated to allow for continued engine operation.
Just as it is safe to complete a flight during which a failure has occurred in the duplicated part of the system, it can also be shown by analysis that the aircraft can continue to operate for subsequent flights for a defined period before a fault is repaired. A “time limited dispatch” analysis is carried out to establish which faults can be treated in this way and for how long. This is of considerable benefit to the aircraft operator, who can continue to operate the aircraft normally and repair the fault at a convenient time, for example, when the aircraft next returns to the operator's main base.
Other safety features may also be required, implemented either in the software or in dedicated hardware to address the effects of adverse operating conditions, or of particular engine or control system failures, which could represent a threat to the aircraft if not accommodated.
Defense Applications
Much of the control system technology used in military applications of gas turbines is similar to civil aerospace engines. However, engine requirements can differ markedly between different military applications, depending on whether the aircraft is a single-engine trainer, a large, twin-engine fighter with full afterburner capability, or a propeller-driven military transport.
Afterburning, also known as wet thrust or reheat, requires additional fuel handling equipment such as pumps and metering valves. They employ similar technology to that described above. Afterburning also requires a variable area exhaust nozzle in order to control the LP system working line. In some applications, the final nozzle is not only variable in area, but the thrust can be vectored by limited angular displacement of the nozzle. This enables a significant increase in aircraft agility without the use of large control surfaces and their associated drag. A variable area nozzle is controlled with actuator rams, typically powered by HP fuel pressure, and an appropriate servo system signaled from the EEC.
The application of the aircraft may also involve vertical or short takeoff, hover, and vertical landing. There are a number of aircraft configurations used to deliver this functionality. Each requires different levels of power to be extracted from the engine to provide vertical thrust, and to stabilize and maneuver the aircraft until sufficient forward speed is attained that the conventional flight control surfaces become operational. The control system must ensure the engine remains stable during these maneuvers and can respond to the very rapid changes in power that are required.
A single-engine aircraft often warrants additional system provisions. This might take the form of a mechanical system which can be invoked by the pilot should all electronic means of control fail. However, as the functions required of such a controller increase, for example, in a complex STOVL application, a mechanical solution is not possible, and so the safety case must be justified based on the electronic system's reliability and built-in redundancy.
Helicopter Systems
In many respects, helicopter control systems function in much the same way as those of fixed-wing aircraft—sensors monitor engine parameters, which are communicated back to an engine controller. However, the nature of a helicopter and its engine configuration mean that there are different control system requirements.
The engine controller must closely control the engine in order to provide a stable power turbine shaft speed. This then allows a constant helicopter rotor speed, while the pitch of the rotor blades controls lift and horizontal helicopter speed.
Traditional control systems operated with a throttle, using the collective pitch lever as the main load demand, with a twist grip for the pilot to trim the demand and keep the rotor speed within defined limits. Modern engines do not have a conventional throttle; they operate on a governing system whereby the pilot demands a load and the control system and inherent control laws and schedules will control the engines to maintain the correct rotor speed. In such a system, the power turbine speed and torque are monitored and the fuel flow is modulated accordingly.
One of the key aspects of helicopter engine control is matching the torque provided by the engines on multi-engine aircraft. Torque mismatches can provide significant aircraft performance penalties. Engine parameter matching, through communication of data between the engines, can be used in order to enable isochronous control, and maintain an even loading of torque.
Although vibration absorbers can be used in some cases, helicopters experience significant levels of vibration; the engines are mechanically coupled through the drive train to the rotors and consequently there is very little vibration damping. It is therefore important to monitor vibration levels.
Typical Aircraft Engine C&I System Hardware3
The controls of the gas turbine engine are designed to remove, as far as possible, work load from the pilot while still allowing him ultimate control of the engine. To achieve this, the fuel flow is automatically controlled after the pilot has made the initial power selection.
All engine parameters require monitoring and instrumentation is provided to inform the pilot of the correct functioning of the various engine systems and to warn of any impending failure. Should any of the automatic governors fail, the engine can be manually controlled by the pilot selecting the desired thrust setting and monitoring the instruments to maintain the engine within the relevant operating limitations.
Main Control Functions
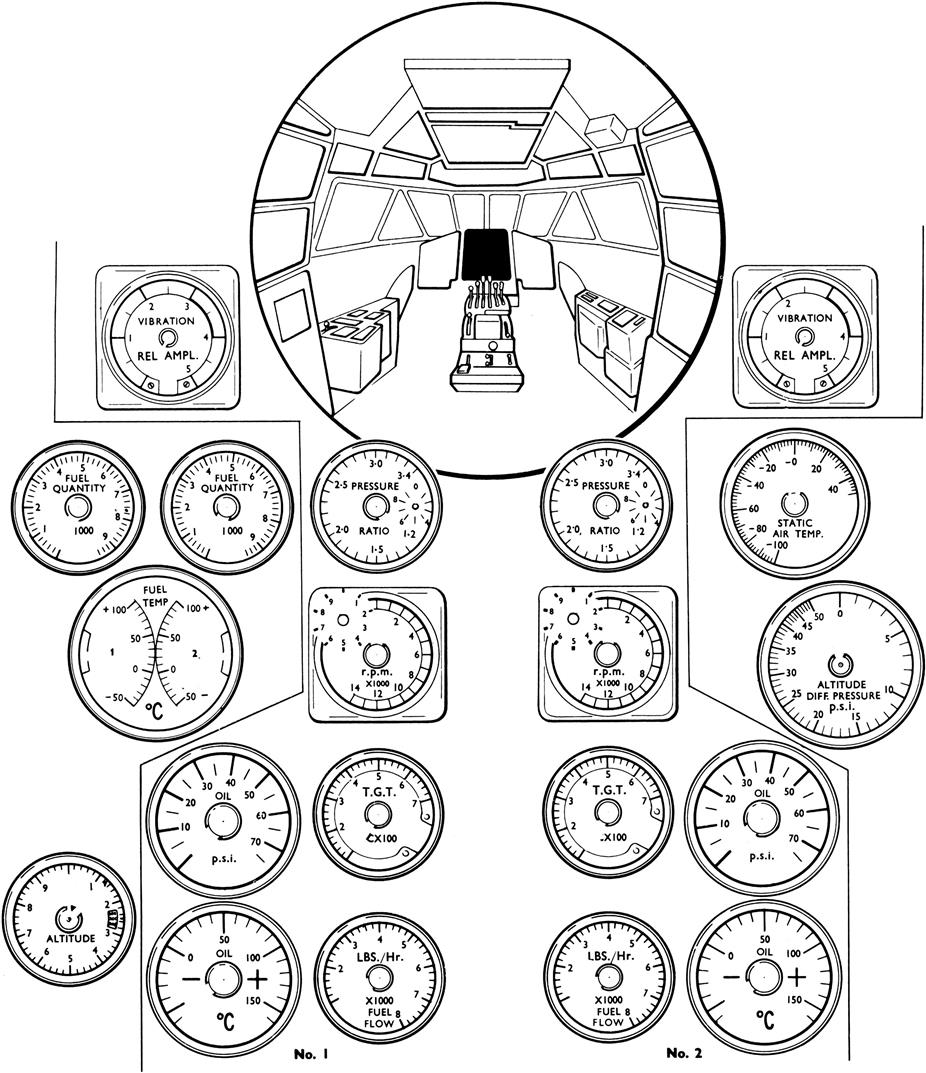
The control of a gas turbine engine generally requires the use of only one control lever and the monitoring of certain indicators located on the pilot’s instrument panel (Figure 9–11). Operation of the control (throttle/power) lever selects a thrust level, which is then maintained automatically by the fuel system.
On engines fitted with afterburning, single lever control is maintained, although a further fuel system is required to supply and control the fuel to the afterburner.
On a turbo-propeller engine, the throttle lever is interconnected with the propeller control unit (P.C.U.), thus maintaining single lever operation of the engine. Similarly, the throttle control lever of a helicopter is interconnected with the collective pitch lever, so ensuring that an increase in pitch is accompanied by an increase in engine power.
The fuel system incorporates a high-pressure fuel shut-off cock to provide a means of stopping the engine. This may be operated by a separate lever, interconnected with the throttle lever, or electrically actuated and controlled by a switch on the pilot’s instrument panel.
A turbo-jet engine fitted with a thrust reverser usually has an additional control lever that allows reverse thrust to be selected. On a turbo-propeller engine, a separate control lever is not required because the interconnected throttle and P.C.U. lever is operated to reverse the pitch of the propeller.
Basic Instrumentation Hardware
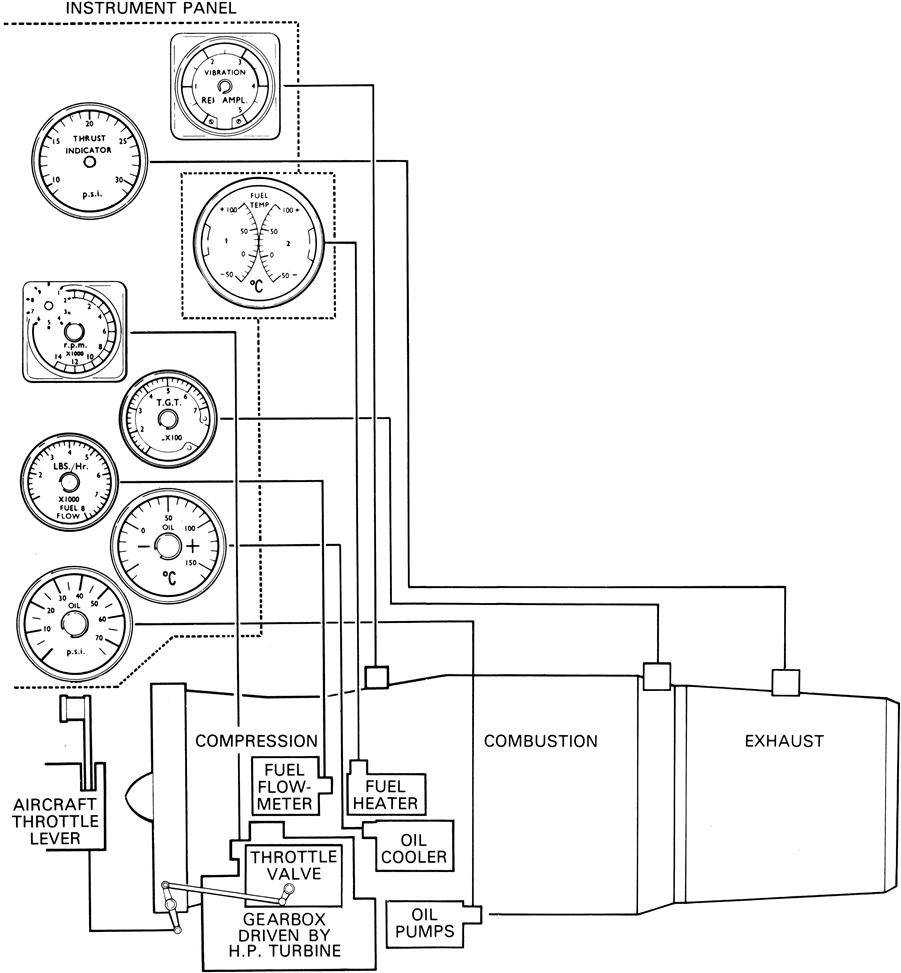
The performance of the engine and the operation of the engine systems are shown on gauges or by the operation of flag or dolls-eye type indicators. A diagrammatic arrangement of the control and instrumentation for a turbo-jet engine is shown in Figure 9–12.
Engine Thrust
The thrust of an engine is shown on a thrust-meter, which will be one of two basic types; the first measures turbine discharge or jet pipe pressure, and the second, known as an engine pressure ratio (E.P.R.) gauge, measures the ratio of two or three parameters. When E.P.R. is measured, the ratio is usually that of jet pipe pressure to compressor inlet pressure. However, on a fan engine the ratio may be that of integrated turbine discharge and fan outlet pressures to compressor inlet pressure.
In each instance, an indication of thrust output is given, although when only the turbine discharge pressure is measured, correction is necessary for variation of inlet pressure; however, both types may require correction for variation of ambient air temperature. To compensate for ambient atmospheric conditions, it is possible to set a correction figure to a sub-scale on the gauge; thus the minimum thrust output can be checked under all operating conditions.
Suitably positioned pitot tubes sense the pressure or pressures appropriate to the type of indication being taken from the engine. The pitot tubes are either directly connected to the indicator or to a pressure transmitter that is electrically connected to the indicator.
An indicator that shows only the turbine discharge pressure is basically a gauge, the dial of which may be marked in pounds per square inch (p.s.i.), inches of mercury (in. Hg.), or a percentage of the maximum thrust.
E.P.R. can be indicated by either electromechanical or electronic transmitters. In both cases the inputs to the transmitter are engine inlet pressure (P1) and an integrated pressure (PINT) comprised of fan outlet and turbine exhaust pressures. In some cases either fan outlet pressure or turbine exhaust pressure is used alone in place of PINT.
The electro-mechanical system indicates a change in pressure by using transducer capsules (Figure 9–13) to deflect the center shaft of the pressure transducer causing the yoke to pivot about the axis A.A. This movement is sensed by the linear variable differential transformer (L.V.D.T.) and converted to an A.C. electrical signal, which is amplified and applied to the control winding of the servo motor.
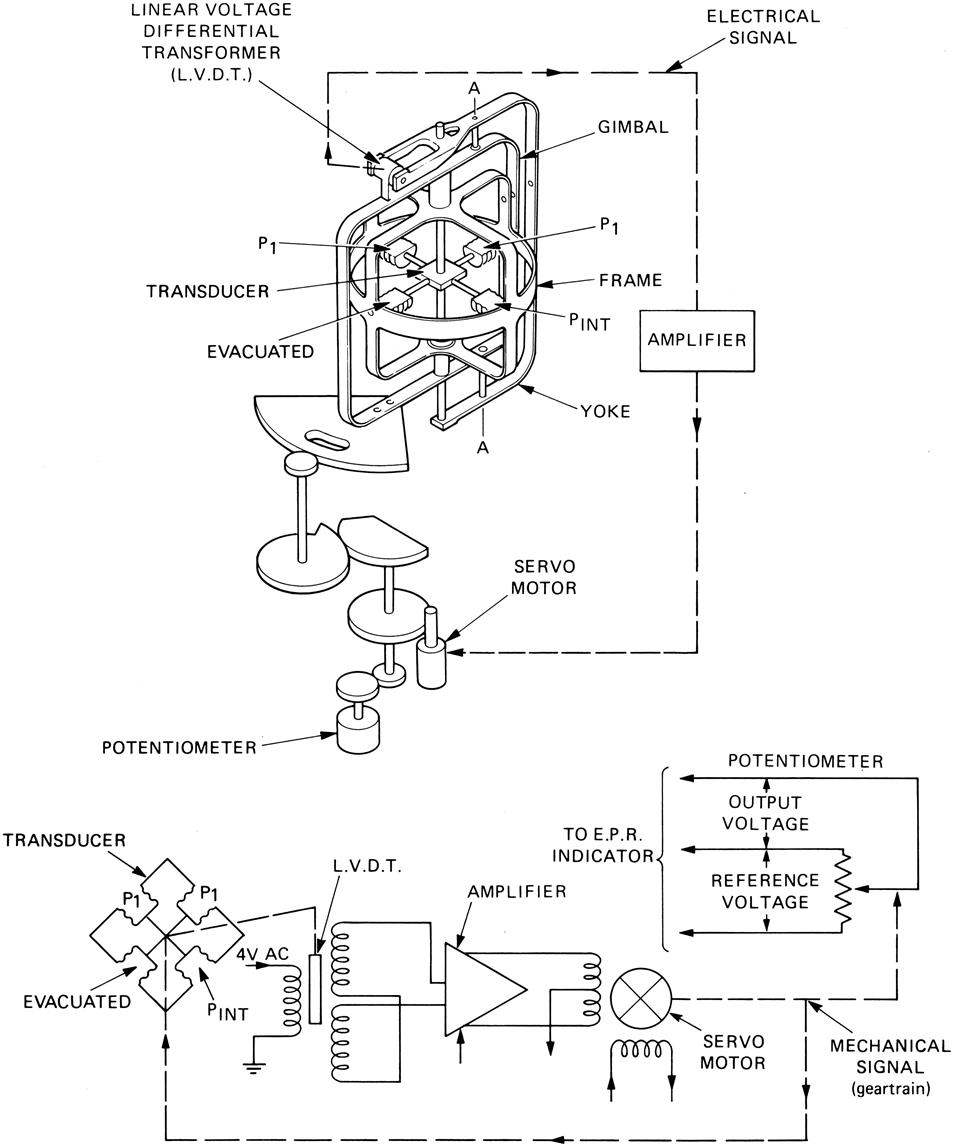
The servo motor, through the gears, alters the potentiometer output voltage signal to the E.P.R. indicator and simultaneously drives the gimbal in the same direction as the initial yoke movement until the L.V.D.T. signal to the motor is canceled and the system stabilizes at the new setting.
The electronic E.P.R. system utilizes two vibrating cylinder pressure transducers that sense the engine air pressures and vibrate at frequencies relative to these pressures. From these vibration frequencies electrical signals of E.P.R. are computed and are supplied to the E.P.R. gauge and electronic engine control system.
Engine Torque
Engine torque is used to indicate the power that is developed by a turbo-propeller engine, and the indicator is known as a torquemeter. The engine torque or turning moment is proportional to the horsepower and is transmitted through the propeller reduction gear.
A torquemeter system is shown in Figure 9–14. In this system, the axial thrust produced by the helical gears is opposed by oil pressure acting on a number of pistons; the pressure required to resist the axial thrust is transmitted to the indicator.
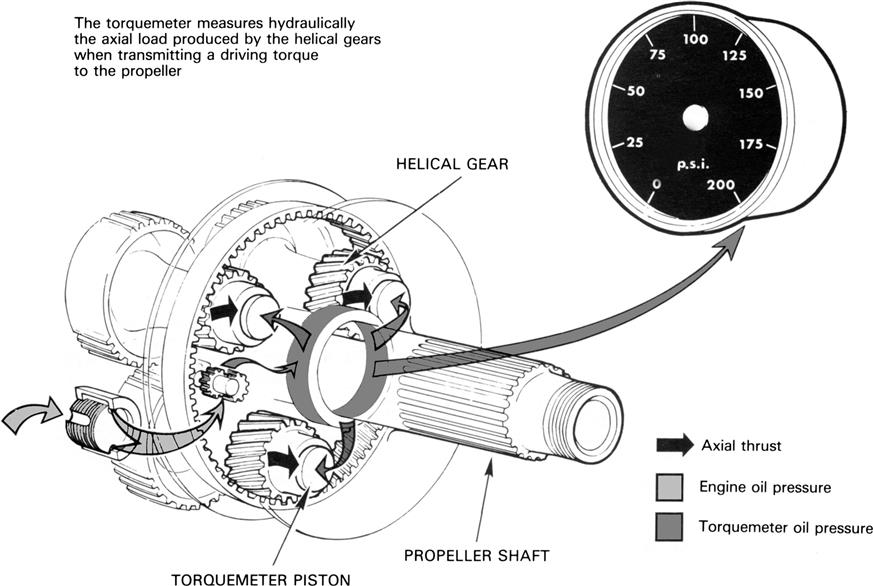
In addition to providing an indication of engine power, the torquemeter system may also be used to automatically operate the propeller feathering system if the torquemeter oil pressure falls due to a power failure. It is also used, on some installations, to assist in the automatic operation of the water injection system to restore or boost the takeoff power at high ambient temperatures or at high altitude airports.
Engine Speed
All engines have their rotational speed (rpm) indicated. On a twin or triple-spool engine, the high-pressure assembly speed is always indicated; in most instances, additional indicators show the speed of the low pressure and intermediate pressure assemblies.
Engine speed indication is electrically transmitted from a small generator, driven by the engine, to an indicator that shows the actual revolutions per minute (rpm), or a percentage of the maximum engine speed (Figure 9–15). The engine speed is often used to assess engine thrust, but it does not give an absolute indication of the thrust being produced because inlet temperature and pressure conditions affect the thrust at a given engine speed.
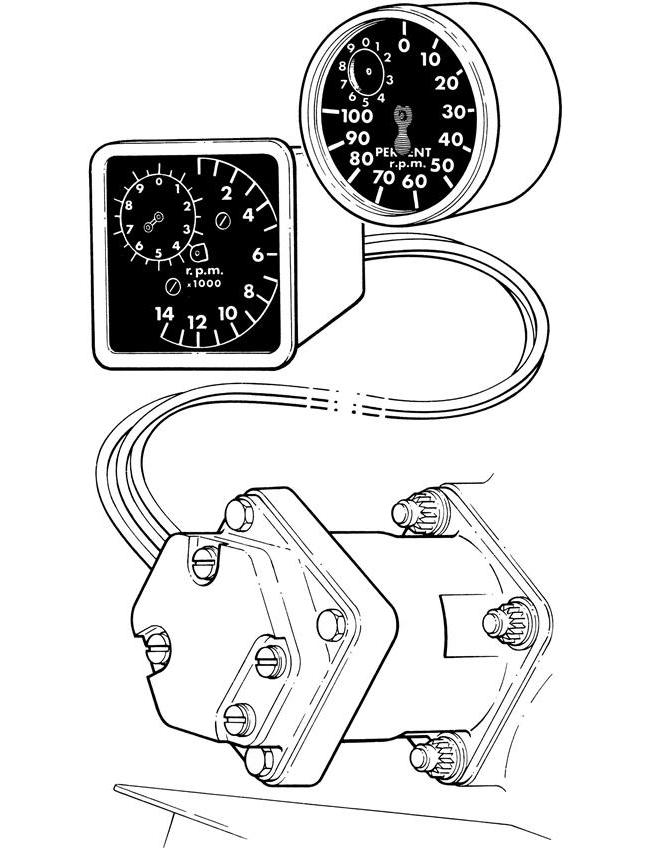
The engine speed generator supplies a three-phase alternating current, the frequency of which is dependent upon engine speed. The generator output frequency controls the speed of a synchronous motor in the indicator, and rotation of a magnet assembly housed in a drum or drag cup induces movement of the drum and consequent movement of the indicator pointer.
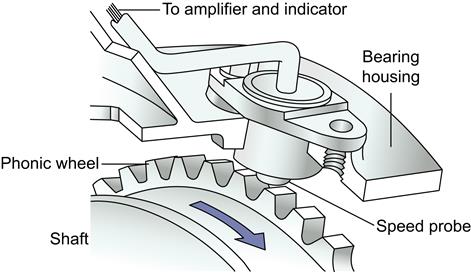
Where there is no provision for driving a generator, a variable-reluctance speed probe, in conjunction with a phonic wheel, may be used to induce an electric current that is amplified and then transmitted to an indicator (Figure 9–16).
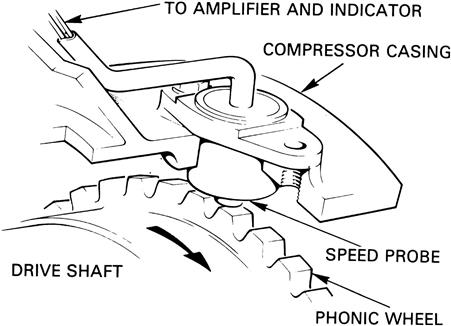
This method can be used to provide an indication of rpm without the need for a separately driven generator, with its associated drives, thus reducing the number of components and moving parts in the engine.
The speed probe is positioned on the compressor casing in line with the phonic wheel, which is a machined part of the compressor shaft. The teeth on the periphery of the wheel pass the probe once each revolution and induce an electric current by varying the magnetic flux across a coil in the probe. The magnitude of the current is governed by the rate of change of the magnetic flux and is thus directly related to engine speed.
In addition to providing an indication of rotor speed, the current induced at the speed probe can be used to illuminate a warning lamp on the instrument panel to indicate to the pilot that a rotor assembly is turning. This is particularly important at engine start, because it informs the pilot when to open the fuel cock to allow fuel to the engine. The lamp is connected into the starting circuit and is only illuminated during the starting cycle.
Turbine Gas Temperature
The temperature of the exhaust gases is always indicated to ensure that the temperature of the turbine assembly can be checked at any specific operating condition. In addition, an automatic gas temperature control system is usually provided, to ensure that the maximum gas temperature is not exceeded.
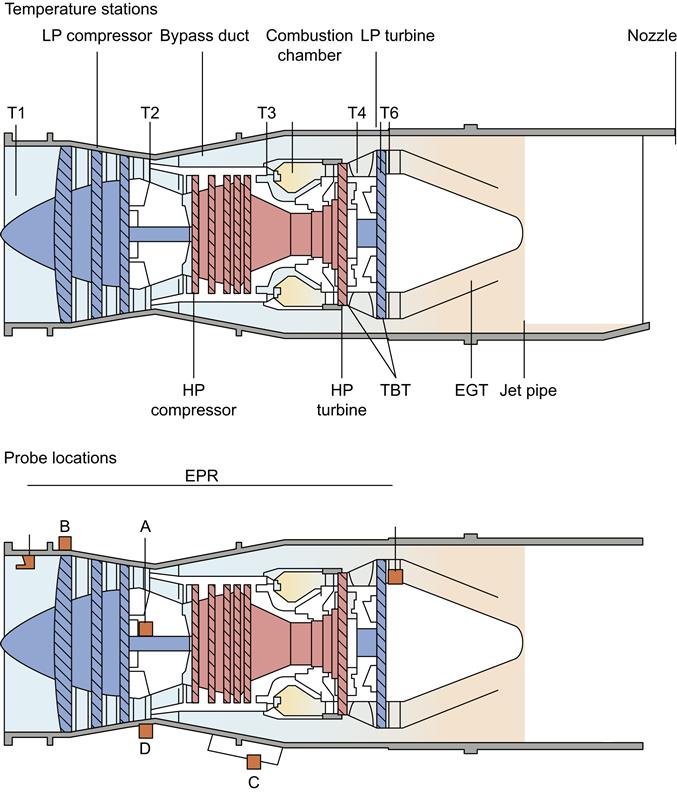
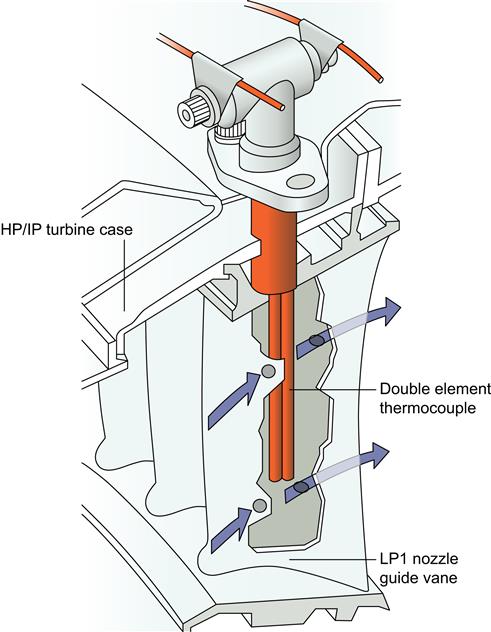
Turbine gas temperature (T.G.T.) sometimes referred to as exhaust gas temperature (E.G.T.) or jet pipe temperature (J.P.T.), is a critical variable of engine operation and it is essential to provide an indication of this temperature. Ideally, turbine entry temperature (T.E.T.) should be measured; however, because of the high temperatures involved this is not practical, but, as the temperature drop across the turbine varies in a known manner, the temperature at the outlet from the turbine is usually measured by suitably positioned thermocouples. The temperature may alternatively be measured at an intermediate stage of the turbine assembly, as shown in Figure 9–17.
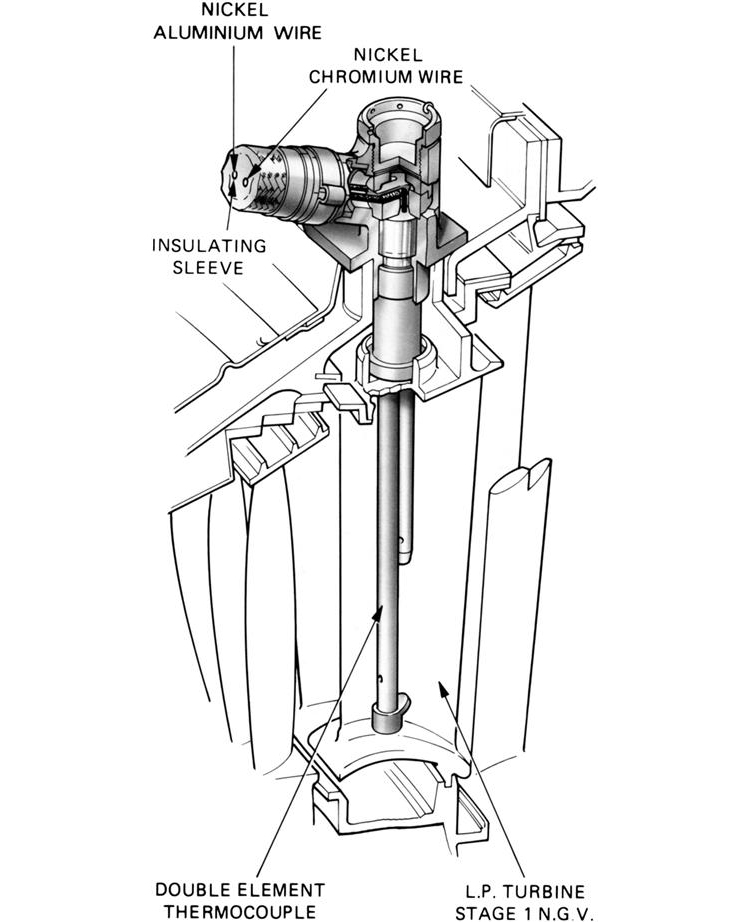
The thermocouple probes used to transmit the temperature signal to the indicator consist of two wires of dissimilar metals that are joined together inside a metal guard tube. Transfer holes in the tube allow the exhaust gas to flow across the junction. The materials from which the thermocouple's wires are made are usually nickel-chromium and nickel-aluminum alloys.
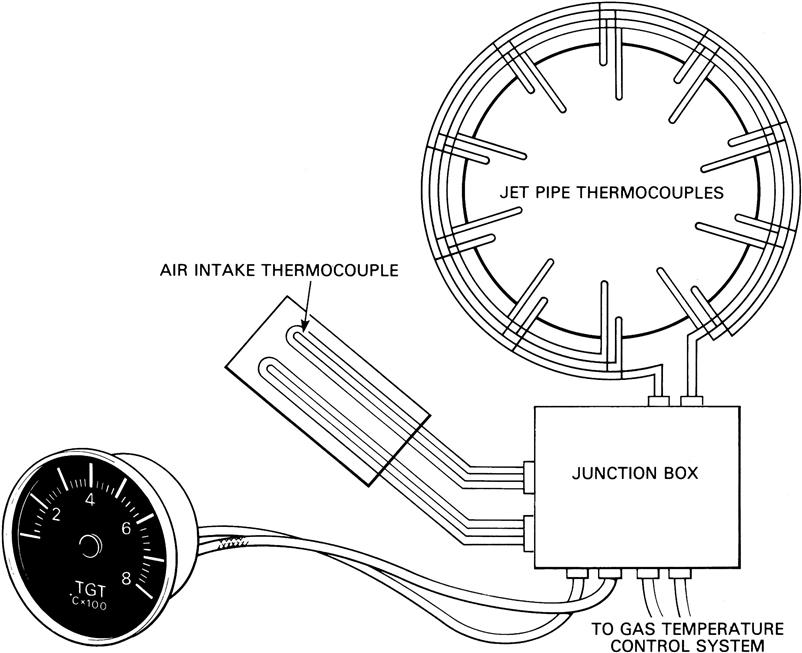
The probes are positioned in the gas stream so as to obtain a good average temperature reading and are normally connected to form a parallel circuit. An indicator, which is basically a millivoltmeter calibrated to read in degrees centigrade, is connected into the circuit (Figure 9–18).
The junction of the two wires at the thermocouple probe is known as the “hot” or “measuring” junction and that at the indicator as the “cold” or “reference” junction. If the cold junction is at a constant temperature and the hot junction is sensing the exhaust gas temperature, an electromotive force (E.M.F.), proportional to the temperature difference of the two junctions, is created in the circuit and this causes the indicator pointer to move. To prevent variations of cold junction temperature affecting the indicated temperature, an automatic temperature compensating device is incorporated in the indicator or in the circuit
The thermocouple probes may be of single, double, or triple element construction. Where multiple probes are used they are of differing lengths in order to obtain a temperature reading from different points in the gas stream to provide a better average reading than can be obtained from a single probe (Figure 9–17).
The output to the temperature control system can also be used to provide a signal, in the form of short pulses, which, when coupled to an indicator, will digitally record the life of the engine. During engine operation in the higher temperature ranges, the pulse frequency increases progressively causing the cyclic-type indicator to record at a higher rate, thus relating engine or unit life directly to operating temperatures.
Thermocouples may also be positioned to transmit a signal of air intake temperature into the exhaust gas temperature indicating and control systems, thus giving a reading of gas temperature that is compensated for variations of intake temperature. A typical double-element thermocouple system with air intake probes is shown in Figure 9–18.
Oil Temperature and Pressure
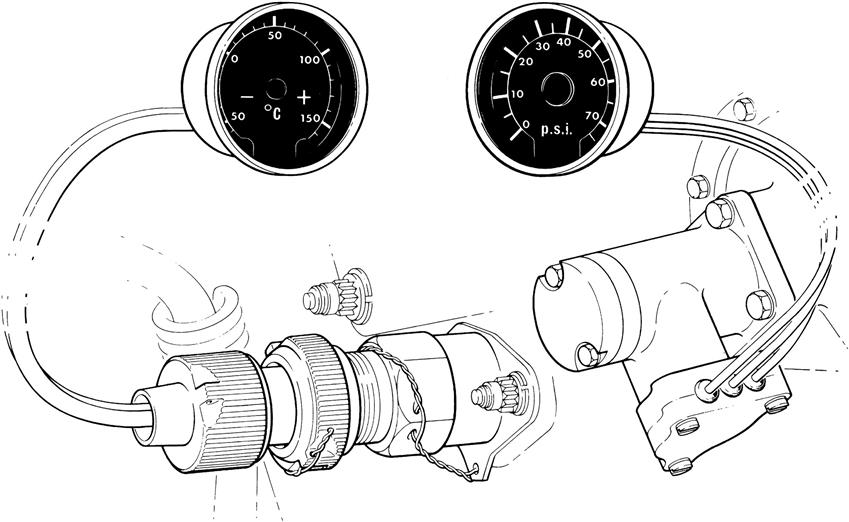
It is essential for correct and safe operation of the engine that accurate indication is obtained of both the temperature and pressure of the oil. Temperature and pressure transmitters and indicators are illustrated in Figure 9–19.
Oil temperature is sensed by a temperature-sensitive element fitted in the oil system. A change in temperature causes a change in the resistance value and, consequently, a corresponding change in the current flow at the indicator. The indicator pointer is deflected by an amount equivalent to the temperature change and this is recorded on the gauge in degrees centigrade.
Oil pressure is electrically transmitted to an indicator on the instrument panel. Some installations use a flag-type indicator, which indicates if the pressure is high, normal or low; others use a dial-type gauge calibrated in pounds per square inch (psi).
Electrical operation of each type is similar; oil pressure, acting on the transmitter, causes a change in the electric current supplied to the indicator. The amount of change is proportional to the pressure applied at the transmitter.
The transmitter may be of either the direct or the differential pressure type. The latter senses the pressure difference between engine feed and return oil pressures, the return oil being pressurized by cooling and sealing air from the bearings.
In addition to a pressure gauge operated by a transmitter, an oil low-pressure warning switch may be provided to indicate that a minimum pressure is available for continued safe running of the engine. The switch is connected to a warning lamp in the flight compartment and the lamp illuminates if the pressure falls below an acceptable minimum.
Fuel Temperature and Pressure
The temperature and pressure of the low pressure fuel supply are electrically transmitted to their respective indicators and these show if the low pressure system is providing an adequate supply of fuel without cavitation and at a temperature to suit the operating conditions. The fuel temperature and pressure indicators are similar to those for oil temperature and pressure indication.
On some engines, a fuel differential pressure switch, fitted to the low-pressure fuel filter, senses the pressure difference across the filter element. The switch is connected to a warning lamp that provides indication of partial filter blockage, with the possibility of fuel starvation.
Fuel Flow
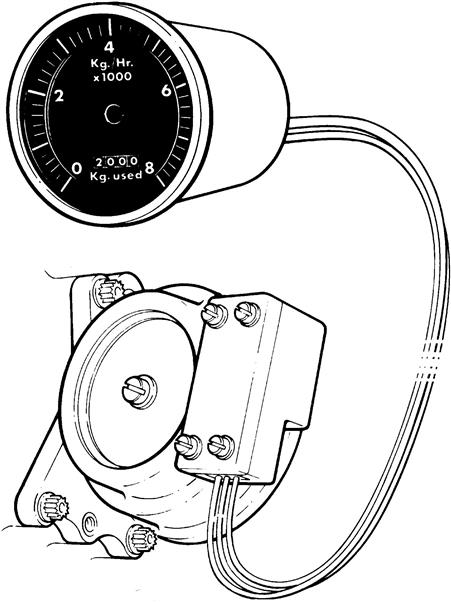
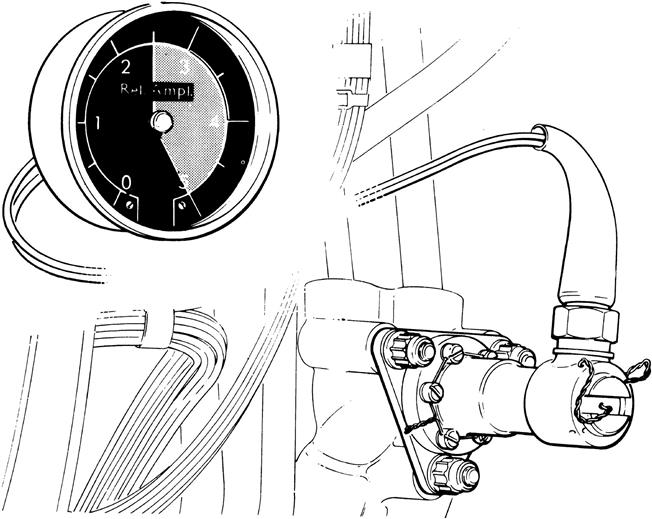
Although the amount of fuel consumed during a given flight may vary slightly between engines of the same type, fuel flow does provide a useful indication of the satisfactory operation of the engine and of the amount of fuel being consumed during the flight. A typical system consists of a fuel flow transmitter, which is fitted into the low-pressure fuel system, and an indicator, which shows the rate of fuel flow and the total fuel used in gallons, pounds or kilograms per hour (Figure 9–20). The transmitter measures the fuel flow electrically and an associated electronic unit gives a signal to the indicator proportional to the fuel flow.
Vibration
A turbo-jet engine has an extremely low vibration level and a change of vibration, due to an impending or partial failure, may pass without being noticed. Many engines are therefore fitted with vibration indicators that continually monitor the vibration level of the engine. The indicator is usually a milliammeter that receives signals through an amplifier from engine-mounted transmitters (Figure 9–21).
A vibration transmitter is mounted on the engine casing and electrically connected to the amplifier and indicator. The vibration-sensing element is usually an electro-magnetic transducer that converts the rate of vibration into electrical signals and these cause the indicator pointer to move proportional to the vibration level. A warning lamp on the instrument panel is incorporated in the system to warn the pilot if an unacceptable level of vibration is approached, enabling the engine to be shut down and so reduce the risk of damage.
The vibration level recorded on the gauge is the sum total of vibration felt at the pick-up. A more accurate method differentiates between the frequency ranges of each rotating assembly and so enables the source of vibration to be isolated. This is particularly important on multi-spool engines.
A crystal-type vibration transmitter, giving a more reliable indication of vibration, has been developed for use on multi-spool engines. A system of filters in the electrical circuit to the gauge makes it possible to compare the vibration obtained against a known frequency range and so locate the vibration source. A multiple-selector switch enables the pilot to select a specific area to obtain a reading of the level of vibration.
Warning Systems
Warning systems are provided to give an indication of a possible failure or the existence of a dangerous condition, so that action can be taken to safeguard the engine or aircraft. Although the various systems of an aircraft engine are designed wherever possible to “fail safe,” additional safety devices are sometimes fitted. Automatic propeller feathering should a power loss occur, and automatic closing of the high-pressure fuel shut-off cock should a turbine shaft failure occur, are but two examples. On some engine types, the fuel system is fitted with a control to enable the engine to be operated by manual throttling should a main fuel system failure occur.
In addition to a fire warning system, a number of other audible or visual warning systems can be fitted to a gas turbine engine. These may be for low oil or fuel pressure, excessive vibration or overheating. Indication of these may be by warning light, bell, or horn. A flashing light is used to attract the pilot’s attention to a central warning panel (C.W.P.) where the actual fault is indicated.
Other instruments and lights warn the pilot of the selected position of the thrust reverser, the fan reverser, or the afterburner variable nozzle, when applicable. Gauges also inform the pilot of such things as hydraulic pressure and flow and generator output, which are vital to the correct operation of the aircraft systems.
Aircraft Integrated Data System
The aircraft integrated data system (A.I.D.S.) is an extension of the “black box” aircraft accident data recorder. By monitoring and recording various engine parameters, either manually or automatically, it is possible to detect an incipient failure and thus prevent a hazardous situation arising.
Selected performance parameters may be recorded for trend analysis or fault detection. Existing instruments are used, wherever possible, to provide the signals to a magnetic tape. Further instrumentation, recording air pressure from points throughout the engine, oil contamination, tank contents and scavenge oil temperature, may be provided as required for flight recording.
After each flight the magnetic tape is processed by computer and the results are analyzed. Any deviation from the normal condition will enable a fault to be identified and the necessary remedial action to be taken.
Electronic Indicating Systems
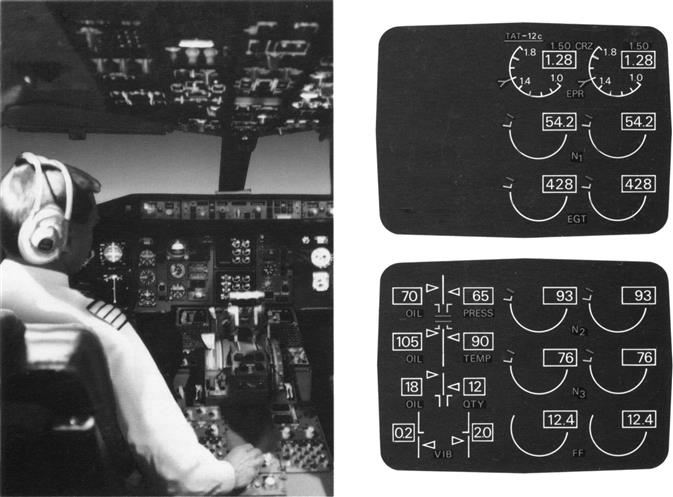
Electronic indicating systems consolidate engine indications, systems monitoring, and crew alerting functions onto one or more cathode ray tubes (C.R.T.s) mounted in the instrument panel. The information is displayed on the screen in the form of dials with digital readout and warnings, cautions and advisory messages shown as text.
Only those parameters required by the crew to set and monitor engine thrust are permanently displayed on the screen. The system monitors the remaining parameters and displays them only if one or more exceed safe limitations. The pilot can, however, override the system and elect to have all main parameters in view at any time (Figure 9–22).
Warnings, cautions, and advisory messages are displayed only when necessary and are color coded to communicate the urgency of the fault to the flight crew. Provision is made to record any event or out of tolerance parameter in a nonvolatile memory for later evaluation by ground maintenance crews.
Electronic indicating systems offer improved flight operations by reducing the pilot workload through automatic monitoring of engine operation and a centralized caution and warning system. Reduced flight deck clutter is another feature as the multitude of instruments traditionally present are replaced by the C.R.T.s.
Synchronizing and Synchrophasing
Synchronizing and synchrophasing systems are sometimes used on turbo-propeller engined aircraft to achieve a reduction of noise during flight.
On a multi-engined aircraft, a synchronizing system ensures the propeller speeds are all the same. This is achieved by an electrical system that compares speed signals from engine-mounted generators. Out-of-balance signals, using one engine as a master signal, are automatically corrected by electrically trimming the engine speeds until all signals are equal.
A synchrophasing system ensures that any given blade of an engine propeller is in the same relative position as the corresponding blade of the propeller on the master engine. This again is automatically achieved by very fine trimming of engine speeds resulting from phase signals from the synchrophasing generators.
On turbo-jet engines, synchronization can be achieved in a similar manner to that used for a turbo-propeller engine. On multi-spool engines, only one spool is synchronized. Manual trimming of engine or shaft speed can be done with the assistance of a synchroscope. This visually indicates, in comparison with a master engine, if the other engines are running at exactly the same speed; the normal engine speed indicator is, of course, not sufficiently sensitive to use for synchronizing.
We note that in the aircraft engine system just described, a switcher on the vibration monitors can choose which area of the engine the operator wishes to look at. With aircraft engines, the tendency is to use one or two probes set in the engine cowling near the location of atmospheric air intake. These probes generally are accelerometers with a large flat frequency response range that can detect vibration signals throughout the entire gas turbine (and transmission gearing if the aircraft engine in question is on a helicopter).
In land-based applications, it is intrinsically more practical to have a variety of probes (displacement, velocity, and acceleration) as space, weight, and footprint are not as big an issue as they are in aviation. What follows is a summary of control and instrumentation features on a gas turbine in power generation service. From this summary and the preceding aircraft engine C&I system description, we note that there may be a wide variation in the details of all C&I systems. Basically, however, all measure temperature, pressure, vibration, and physical position to varying extents and for different purposes.
Gas turbines in power generation service onboard ships and offshore platforms have very similar systems. Gas turbines in mechanical drive service do not differ greatly in this regard either.
Marine C&I Systems
The environment around a marine gas turbine is somewhat more benign than most aircraft applications; with fewer constraints on weight and space, there is more scope for installation options and therefore the use of less rugged equipment. Even so, it is common for these products to use existing aerospace components, particularly in the fuel system. These may be mounted on the engine or assembled onto a fuel “skid” mounted in the engine enclosure. Similarly, electronics can be engine-mounted within the enclosure or outside in conventional equipment racks, or may be split between a number of these locations, communicating by means of digital data busses.
The marine gas turbine may mechanically drive a propeller, water jet, or other propulsion system, or may drive an electric generator providing power to electric motors, which in turn provide the motive power. The engine controller is therefore required to interface with the control system of this additional equipment in order to optimize overall performance.
In addition, there is usually a separate system providing the human-machine interface the means by which the ship's crew provide inputs to the propulsion system and monitors its performance. The system may need to be operated from several different locations on the ship: the engine room, the captain's chair in the center of the bridge, or from bridge “wings” during close harbor maneuvering.
Typical C&I System, Land-Based (Power Generation)
Instrumentation4
Instrumentation on contemporary gas turbines, steam turbines, or GTCC can get quite involved. The basic instrumentation includes pressure and temperature readings. With the use of orifice plates, flow can also be measured.
The simplest of C&I systems may have analog indicators for these parameters. Modern plants have:
• Digital readouts of all parameters measured on a C&I system
• Automatic alarm and trip levels on several parameters
• Integration of the C&I with diagnostics
• “Artificial intelligence” (AI), in some of the more advanced engines (if my turbine’s CDP is higher by a certain amount than usual, and the CDT has also risen by a certain amount with x and y conditions, for instance, then the wash cycle on my turbine needs to be automatically initiated)
Artificial intelligence tends to be popular with researchers and designers, particularly those who have security clearances and can get funding from specific militaries. The USAF (US Air Force) has specific firms under contract to work on nothing but AI for gas turbine engines.
Operations engineers, however, tend to be thoroughly skeptical of “AI that initiates control functions.” Most of us know of many instances where the simplest parameter to read is “read wrong” at a critical moment. So AI that delivers options and leaves the decision making to human operators tends to be more popular. In any case, most alarm and trip levels have a manual override. Since human operators like to feel “in control,” digital readouts of all parameters that affect the engine’s health are provided within easy viewing distance of the on-duty operator’s chair.
Other critical parameters include the ones that measure the turbine’s vibration level, where measurement uses:
Accelerometers are better at detecting high-frequency response problems, such as blade tip rub and gear tooth wear.
Velocity probes detect “intermediate” frequency problems (such as shaft misalignment). They have more directional sensitivity than accelerometers.
Proximity probes measure shaft movement in their own local “vision” and no further. They detect low-frequency problems, such as unbalance and oil whirl (whip). They may detect shaft misalignment.
Other items that may be measured include monitoring nonintrusive wear and oil debris.
Nonintrusive Wear Monitoring
A few users have tried nonintrusive wear monitors (in applications where bearing or other component deterioration might be an issue). This technology uses neutron bombardment and has not grown in popularity over the past decade although it aroused considerable interest initially.
Oil Debris Monitoring
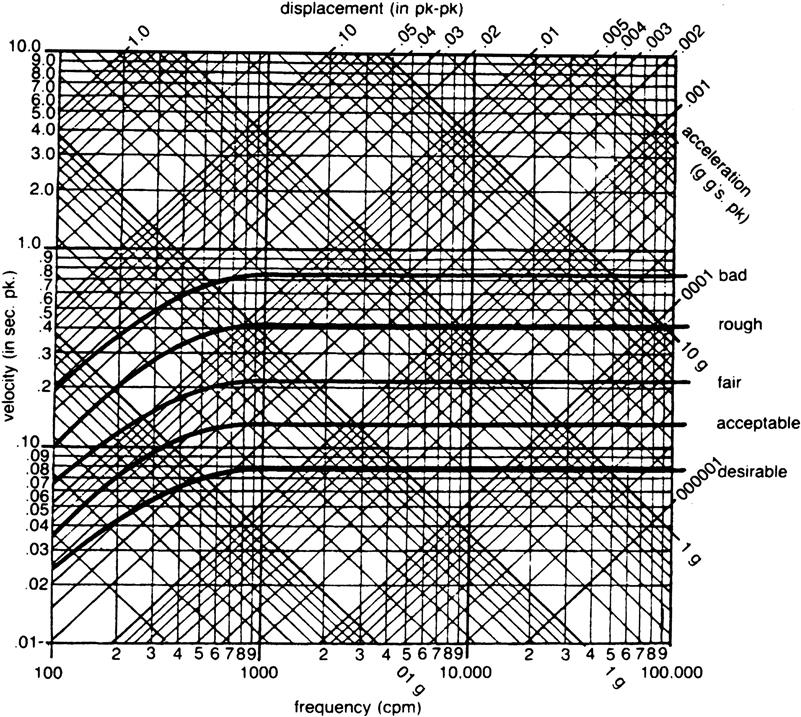
Oil debris monitoring is better suited to reciprocating machines, because of the lead time involved in analyzing the readings. The technique may be used online but is a long way from being done in real time. Reciprocating machines turn slower, so a sample may be taken and analyzed in time to indicate a trend. This is rarely the case with rotating machinery. Once metal particulates are detectable in an oil sample on a rotating machine, progression to failure is generally swifter than the analysis cycle (see Figure 9–23).
Transducers
Pressure measurement is conducted by monitoring the deflection of a diaphragm with strain gauges.
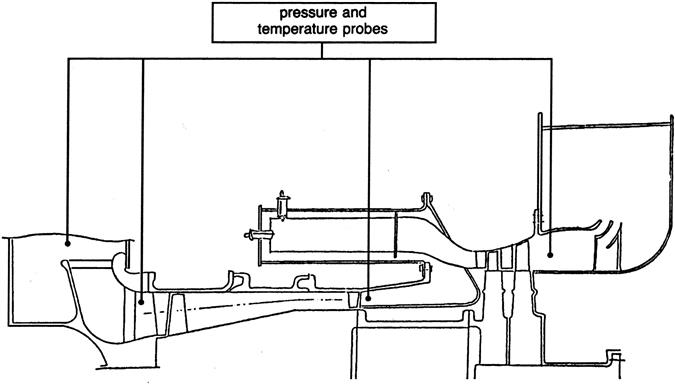
Pressure transducers have a given range where output signal versus pressure change is a linear function. They are temperature limited to about 177°C. So, with GTs, probes installed on the casing direct air to the transducer. See Figure 9–24, which refers to a “typical” GT. This may be typical for older models. Contemporary GTs generally monitor far more pressure (and corresponding temperature) readings.
Temperature measurement is conducted using thermocouples and RTDs (resistive thermal detectors, normally platinum).
The primary locations for installing temperature measurement are as follows:
1. Turbine blade exhaust temperature. These readings measure blade path temperature for the blade stage they are next to and frequently employ a redundant sensor for increased reliability.
2. GT exhaust. Generally thermocouples are used in this location.
3. Redundant RTDs measure babbitt face bearing (oil) temperature.
Typical (Nonaeroengine) Controls
The overall functions of a turbine system are to:
• Provide speed and temperature control
• Control the unit during operation, primarily normal operation
Typically, magnetic transducers measure speed of a shaft that holds a toothed wheel (which engages with the main shaft). This is speed of the shaft at any given instant, which is compared to the desired rotational speed, and the error in shaft speed is computed. This reading is taken into account by a PID (proportional integral derivative) algorithm, and the fuel supply is trimmed to eliminate the error in minimal response time.
Typically, the temperature readings at the exhaust of the gas turbine are averaged and compared to a desired set point (for the relevant running conditions). The difference is called the temperature error. This is then adjusted for, according to a PID function, by fuel valve adjustment.
The protective systems listed earlier in this section protect the turbine system during the following events:
• Overspeed. A transducer mounted on the accessory gear shaft trips the unit at about 110% operating speed.
• Overtemperature. The system relies on thermocouples similar to those used for temperature control.
• Vibration. Sensors are set at alarm and trip levels.
• Flame out. Two ultraviolet flame detectors monitor flame status. In a can-annular design, flame detectors are mounted in cans that do not also hold the igniters. Two detectors have to indicate flame out to trip the machine.
• Electrical open circuit, ground, or short circuit faults. The system warns the operator (signal light, sound, and/or reading, depending on system design).
Protective Systems
Generally, the GT I&C has the following protective measures:
• Low lube oil pressure. The turbine trips when oil pressure in the bearing header drops.
• High vibration. The turbine trips on high vibration. Sensor choice, technology, and placement vary considerably with different GT models and applications.
• Turbine overspeed. The turbine is protected against overspeed, generally by a triple-redundancy system: magnetic pickups inside the bearing cavities (near the thrust and journal bearings) monitor the speed. They trip the unit on overspeed. Overspeed bolts also may be used.
• High lube oil temperature. RTDs embedded in the babbitt monitor the temperature and, therefore viscosity, of the lube oil.
• Exhaust temperature. Thermocouples (numbers vary, 16 is a common number) measure exhaust temperature and trip the turbine if required.
• Blade path temperature. A “safe” (temperature limiting) location is chosen for turbine temperature readings. The turbine inlet temperature generally is too high for most thermocouples on the market. A number of thermocouples (16 is a typical number) measure temperature at a given turbine station. Allowing for combustor geometry, this then gives the state of individual combustors in a can-annular design or segments of the combustor in an annular design. Some designs average the readings, others take adjacent thermocouple readings. The latter also may set alarm levels, unload, and shutdown levels. A typical alarm level is 50°C, 67°C is a typical unload level, and 72°C is a typical shutdown level.
• High acceleration. Detectors trip the turbine on high acceleration, which may occur during startup, at incipient surge, or upon load rejection.
• High thrust bearing pad temperature. A thrust bearing, generally a tilting pad type, keeps the shaft from moving axially. Two of the pads generally support the thrust collar on either side. When they wear, the temperature inside the bearing cavity rises. RTDs are set to trip the turbine on high temperature. In some applications, proximity probes are set to serve the same function.
• Low or high GT inlet vacuum. A damaged or clogged filter can drop or raise, respectively, the GT inlet vacuum pressure. A pressure switch can be set to shut off the unit at predesignated values.
• High turbine exhaust pressure. A trip on high exhaust pressure can be set to shut off the unit in case of downstream (e.g., boiler) problems.
Permissives (Interlocks)
Permissives are conditions that must be met before a startup or operation can continue. Typically, they are as follows:
• Combustor outfire. The ultraviolets must confirm combustion within a specific time (generally a few seconds) or the turbine shuts down.
• Low compressor discharge pressure. This value must be high enough to sustain safe combustion. If not, the startup sequence stops.
• Low lube oil temperature. If this value is too low, startup stops.
• Low lube oil pressure. The turning gear stops if this value is too low.
• Too high or too low gas supply. Starting is prevented if these values occur.
• Low fuel pump suction pressure. The pump trips if this occurs.
• High or low differential pressure (pressure between the liquid fuel manifold and the compressor discharge) across the fuel manifold. The unit trips if either value is reached.
• Fuel transfer (switching from gas to liquid fuel) failure. The unit trips if this occurs.
Startup Sequence, GT
1. All auxiliaries in the starting position.
2. All gear and oil pumps operating.
• A turbine system may have as many as three spare lube oil pumps, two AC and one DC (battery backup if AC fails) in addition to the main engine pump, which is driven off the main GT shaft. The AC pumps keep the machine safe before the rotor has developed its speed on startup and on shutdown.
• When oil delivery pressure from the auxiliary lube pump reaches a certain value, the turbine turning gear is started. This must occur within a certain time, generally about 30 sec or the unit shuts down.
• Energize starting motor. Note: When the turbine gear is operating well, the starting motor is activated if the lube oil pressure is high enough. At about 15% speed, the turning gear can be de-energized.
• Accelerate rotor to ignition speed (generally about 1000 rpm). Note: At ignition speed, the turbine o/s trip solenoid and vent solenoid are reset. When oil pressure is high enough, the o/s trip bolts (which trip at about 12.5% o/s) reset.
• Energize ignitors. This occurs when the o/s trip bolts have reset. The energized ignition circuit in turn energizes the ignition transformers and ignition timer (allowed 30 sec to establish the flame on both detectors).
• The preceding step, in turn, opens the fuel valves and starts atomizing air.
5. Acceleration phase. Note: Following fuel injection and ignition confirmation, the no-load set point (or speed reference) is increased. The fuel valve now opens further to increase speed. Shaft acceleration rate is limited by blade design and turbine EGT (exhaust gas temperature).
• Start ramp controller accelerates the rotor to about 89% of operating speed over 20 min.
• Start motor stops at about 50–66% of the operating speed. This value is called self-sustaining speed.
• Speed controller accelerates rotor from 89–100% operating speed. Note: If desired acceleration is not maintained, the unit is tripped, as with high acceleration, compressor surge could occur and the rotor could heat faster than the stator, leading to tip rub.
6. Generator synchronization. Attempt only if
• The generator frequency is slightly higher (say by 0.05 Hz) than the grid frequency.
• The generator voltage matches grid voltage.
• Generator phase voltage matches grid phase voltage.
• Note: If commissioning, ensure that phase sequences in the generator and grid are matched.
• Synchronous accepter relay must confirm independently that synchronization conditions are met (after an automatic synchronizer changes generator speed and voltage to match the grid) before the CB can be closed.
Then the generator CB closes automatically or manually.
This system compares CDP with EGT and signals the fuel control valve to make changes as required. As CDP rises, the controller changes the set point of the EGT; it must drop. The controller signals the fuel control valve to close to the extent required. Power output stays at 100% while the change (less fuel flow) is made. This indicates the turbine runs more efficiently when ambient air temperature drops. However, this does not imply that the turbine is controlled by ambient air values. This is because CDP is also affected by:
Note: Other control mechanisms include:
• Inlet guide vanes (IGVs). These are partially closed when the unit is still developing power. When the GT develops more load, the IGVs open. For a combined cycle, when the GT is at part load, the IGVs close, which raises GT EGT and increases the heat recovery steam generator’s efficiency.
• Compressor bleed valves. These valves vent compressor air during startup to prevent compressor surge. They close when the GT reaches about 92% speed. Note that compressor bleed air is used in various accessory systems.
Transmitters for pressure and temperature have no control function. They provide a 4–20 mA signal over the range specified. Their function is to indicate parameter values only.
Shutdown Sequence, GT
1. A local or remote shutdown (SD) request is made.
2. Fuel is reduced to zero load.
3. The main CB to the grid and the field CB (auxiliary loads) are opened and fuel valves tripped.
4. Note: For emergency SD, the CB and fuel valves are tripped before load reduction.
5. GT speed and oil pressure from the main pump drop. The DC auxiliary pump starts.
6. At 15% speed, the turning gear motor starts. When at 5 rpm (turning gear speed), the turning gear clutch is engaged.
7. The unit is purged of fuel with air (about five times volume of GT casing).
8. The turning gear is run for up to 60 hr to prevent shaft bow.
Starting Systems
The two energy sources for starting a gas turbine are
• Active energy, such as grid power, supplied to the starting motor or generator that acts as a startup motor during startup or an ICE (internal combustion engine).
• Stored energy, which may mean batteries, compressed air, compressed gas, or hydraulic oil. The stored energy method has obvious GT size limitations.
Engine starting systems can also be used to
• Rotate the compressor for offline washing.
• Supply air to cool the GT after an emergency trip before restart is attempted.
If the latter use is not employed, note that the rotor must be turned at slow speed (about 6 rpm for 4 hours) after emergency trips to prevent shaft sag.
Significant Advances in Controls Instrumentation and Diagnostics Technology
Advances in CID are varied and several. Field operations provide a proving ground for everyone from software engineers to gas turbine performance engineers hungry to squeeze every decimal point worth of efficiency out of their machines. There is no way that a book of any kind can cover everything of relevance to CID with GTs in one chapter or, for that matter, one volume. However, a few subfields within this specialty point the way to future concentrations of effort by both OEMs and end users. The case studies and program descriptions that follow provide details of current and future technologies in these areas. They include but are not limited to:
• Digital telemetry (data transfer)
• Pulsation measurements for diagnostic purposes (described with a case study)
• Performance and C + I system verification with modeling (described with a case study)
Many other new technologies would be of interest to a gas turbine engineer. In the interests of available space, I include some Internet addresses in Chapter 20. Again, the reader is cautioned about the interrelated nature of gas turbine technology, as this may mean that a link to an interesting diagnostic technology may appear in, for instance, Chapter 10, Gas Turbine Performance, Performance Testing, and Optimization, or Chapter 12, Maintenance, Repair, and Overhaul.
Performance verification with modeling is not a new field. However, when an OEM chooses to reveal some significant aspects of its methodology in this endeavor, it is worth a careful look. So there is a case study on a specific OEM’s (Rolls Royce’s) strategy for performance verification with modeling.
Optical pyrometry is used for accurate measurement of higher temperatures. Some OEMs, by design philosophy, expect to raise peak turbo inlet temperatures (TITs) to raise overall GT efficiency. Although the empirical equations confirm this to be possible, there are limitations based on metallurgy, cooling air flow available, hot spots in the hot section caused by unforeseen circumstances, quality control manufacturing or overhaul errors and a variety of other factors. This notwithstanding, accurate measurement of TITs, or a temperature close to the IGVs that can be extrapolated to provide TIT values, is essential for proving thermal efficiency values. This is particularly critical with the increase in “power by the hour” contract trends granted to OEMs, as hot section (generally the most expensive) component lives are particularly dependent on peak operating temperatures and uniformity of those temperatures.
TIT is extrapolated back from EGT readings taken by a series of thermocouples placed in the exhaust duct. Frequently, in older engines, all the thermocouple readings were averaged and no trouble was taken to determine temperature differentials between adjacent thermocouples to get indications of possible hot spots in the hot section further upstream. Newer engines have this feature.
Optical Pyrometry
Today, optical pyrometry is being optimized to provide accurate temperature readings of the TIT zone, as are other nonintrusive temperature measurement techniques. This is a highly specialized field, and very few players invest in developing this technology. Currently, it is used mainly in development work.
The optical pyrometry players include Rotadata in the UK and Siemens (sometimes in concert with the Technical University of Berlin). To help illustrate this new field, the following information is included in the sections that follow:
• Two (trademarked) products developed by Rotadata and their function (contact the company for more details regarding accuracies and tolerances)
• A case study of Siemens’ work with the University of Berlin
The latter item is included for its interest value illustrating grassroots development in this new field. As always, once a technology is mature, much of the “hows and whys” are no longer evident in newer literature.
Turbine Blade Optical Pyrometry Mapping (Rotamap 1™)5
Application
Rotamap (trade name) is a traversing infrared pyrometer system that is designed and programmed to scan the surface of rotating turbine blades in order to measure their surface temperatures at full engine operating speed. This approach to IR (infrared) pyrometry is to perform a radiance measurement of the turbine using small spot sizes and high bandwidth performance coupled with very high digital data transmission to ensure data integrity. These measurements can then be turned into very high quality temperature maps using various correctional techniques applied either by customers (mostly OEMs) or the manufacturer of this technology or jointly.
Principle of Operation
An air-cooled probe is located in a sealed traverse actuator, mounted onto the engine. The probe is inserted into the turbine annulus in front of or behind the blade row and is traversed radially into the engine. By correct orientation, radiance from almost any part of the rotating blade surface—from root to tip and on suction or pressure surface—can be scanned.
The pyrometer optics are set to a specific focal length, dictated by the engine installation. A periscope mirror at the base of the probe reflects the radiance from a small (2–3 mm diameter) “spot” on the blade surface. This is captured by the detector in the head of the pyrometer and fed via high-speed digital link to a groundstation. Here these data are stored and processed, prior to presentation in whatever manner is required.
Clear signals and significant “oversampling” through the use of a digital high speed acquisition system permits the filtering and removal of radiation spikes caused by combustion flares, reflection or particles.
By linking the captured data to a “once per revolution” signal from the engine, and the knowledge of the radial position of the scan, a map of radiance for each blade may be generated. When this is corrected for emissivity factors (blade incidence angle, material, surface finish or blade coating, etc.), blade temperatures are revealed.
Turbine Blade Optical Pyrometry Mapping (Rotamap 2™)5
Application
Rotamap 2 is a self-contained infrared pyrometer system that is designed to operate in the hottest of gas turbines and is programmed to scan the surface of rotating turbine blades in order to measure their surface temperatures at full engine operating speed.
This approach to IR pyrometry is to perform a radiance measurement of the turbine using small spot sizes and high bandwidth performance coupled with very high digital data transmission to ensure data integrity. These measurements can then be turned into very high quality temperature maps using various correctional techniques applied either by customers or the manufacturer of this technology or jointly.
Principle of Operation
A special air-cooled probe and actuator mechanism is mounted on the engine casing. The probe is located just outside the hot gaspath. When blade temperature measurements are required, the actuator mechanism inserts the probe a short distance into the hot gas path (10–15 mm). Then a separate actuator system oscillates a special high temperature mirror at the base of the probe to reflect the radiance from a small (2–3 mm diameter) “spot” on the blade surface as it scans from the blade tips to their roots.
The pyrometer optics are set to an appropriate focal length to ensure the desired spot size at the targeted blades. The blade radiance is captured by the detector in the head of the pyrometer and fed via high-speed digital signal to a groundstation. Here these data are stored and processed, prior to presentation in whatever manner is required.
Clear signals and significant “oversampling” through the use of a digital high-speed acquisition system permit the filtering and removal of radiation spikes caused by combustion flares, reflection or particles.
By linking the captured data to a “once per revolution” signal from the engine, and the knowledge of the radial position of the scan, a map of radiance for each blade may be generated. When this is corrected for emissivity factors (blade incidence angle, material, surface finish or blade coating, etc.), blade temperatures may be mapped.
Use of Optical Pyrometry with the Siemens Vx4.3 Gas Turbines6
This section will discuss two pyrometer systems that have been built that meet the design requirements for use in heavy-duty gas turbines. They are of the “test bed” standard probe design that consists of a 2000 mm long cylindrical probe with an outer diameter of 27 mm that is reduced to 22 mm outer diameter for the part that goes into the hot gas path (Figure 9–25). These versatile probes are designed for use in turbine stages one, two, and three. Thus, the maximum insertion depth ranges from 80 mm in the first stage of the V64.3A gas turbine (70 MW) to 400 mm in the third stage of the V84.3A (180 MW).
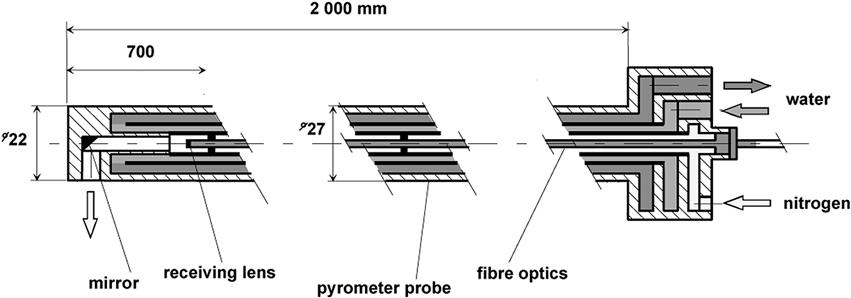
In the first stages the thermal stress is dominant with peak values of several hundred MPa, whereas in the second and third stage the bending stress becomes more and more important (up to 650 MPa). It is evident that only superior chrome nickel alloys and state-of-the-art manufacturing techniques such as electron beam welding have to be applied in order to achieve probes that are suitable for this wide field of application.
With regard to the high temperatures, the probe is water cooled by a stainless steel 24 stage high-pressure impeller pump. Furthermore, the optical parts are purged and cooled by high-pressure nitrogen, a portion of which is discharged through tiny slots in the mirror, in order to cool the very tip of the probe. A closed loop control allows a predetermined nitrogen overpressure to be kept constant at all operating conditions, e.g., Δp = 1 to 5 bar. Even though the actual pyrometer is miniaturized a 22 mm outer diameter of the hot gas part is required, due to space for the sturdy sight tube, the cooling water and the nitrogen channels.
Application to Heavy-Duty Gas Turbines
The main purpose of temperature measurements on turbine blading is the experimental evaluation of numerical calculations that have been applied during the design process. Figure 9–26 shows a schematic of traverse units for linear and angular movements of the probes mounted on a gas turbine. Usually at least two pyrometer systems are applied at the same time, such that the leading edge (pressure side) and the trailing edge (suction side) of one blade stage can be investigated simultaneously. In addition, new vanes and blades can be investigated, using the test bed gas turbine as component carrier. As a side effect, quality assurance of all rotating blades may be performed by optical pyrometry. Even though thermocouples and thermal paint are largely applied for temperature measurements, optical pyrometry is widely used by several gas turbine manufacturers for turbine blade and vane testing. The systems applied are based on commercially available sensors, e.g., by LAND.
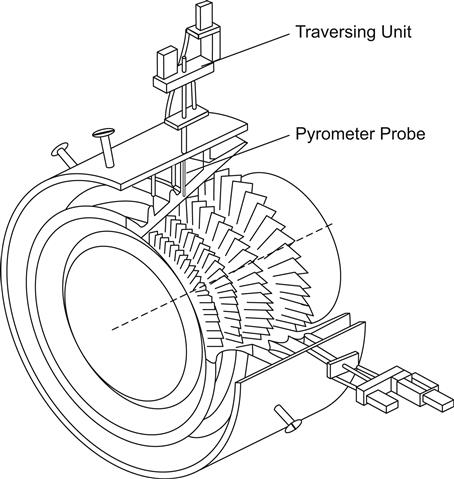
Since the required technique for the test bed was not readily available at the time, a high-resolution pyrometer has been developed in a joint effort between Siemens Power Generation and the Technical University of Berlin, where the basic research work was carried out at the Institute of Internal Combustion Engines.
A visual impression of the high-resolution prototype pyrometer probe and the data acquisition unit is given in Figure 9–27. The optical access at the tip of the probe and the flexible light guide, which may be as long as 15 m, are clearly visible. During operation, the sturdy data acquisition unit, containing both the electronic receiver and a robust industrial PC, is mounted adjacent to the gas turbine.
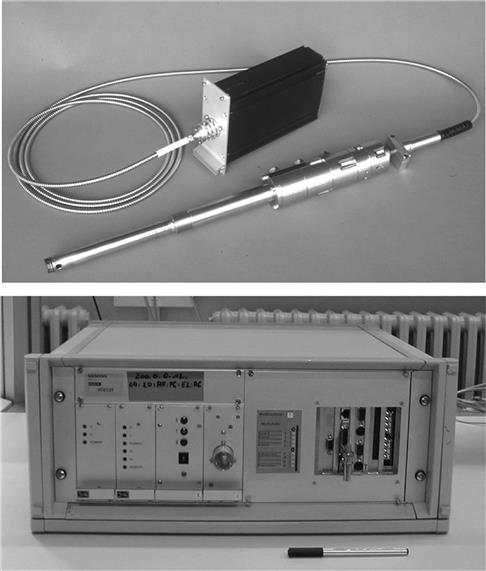
Hence, measurement data is transferred via a local area network to the host PC in the remotely located control room. The pyrometer system is characterized by a temporal resolution of 1 μs, a minimum field of view of 1 mm, and a measurement range from 600 to about 1500°C. The cylindrical probe is of the traverse type with a modular design. Thus, the minimum field of view can be adjusted over a wide range and all components can be exchanged easily, e.g., in order to use up- or down-looking mirrors or to use optical components that are suitable for long or short infrared wavelength measurements.
Figure 9–28 displays the probes and traverse units mounted on a model V84.3A 180 MW gas turbine ready for testing. At the rear, the connections and flexible hoses for cooling water and nitrogen can be seen. Different traverse units with extension distances ranging from 500 to 3000 mm for probe diameters from 6 to 30 mm with maximum speeds of 1200 m/s are available for a large variety of investigations in the test bed.
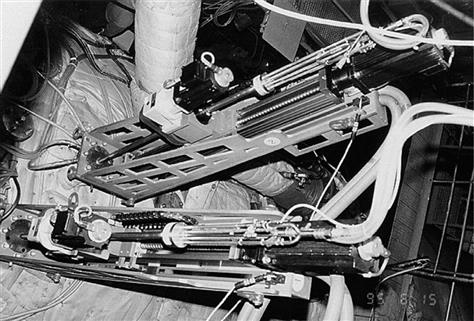
Since the pyrometers are traversed into the hot gas path, it has to be demonstrated that the probes have no influence on the temperature distribution to be measured. This has been thoroughly investigated, making use of different traverse velocities and especially of different probe positions as shown in Figure 9–29(a).
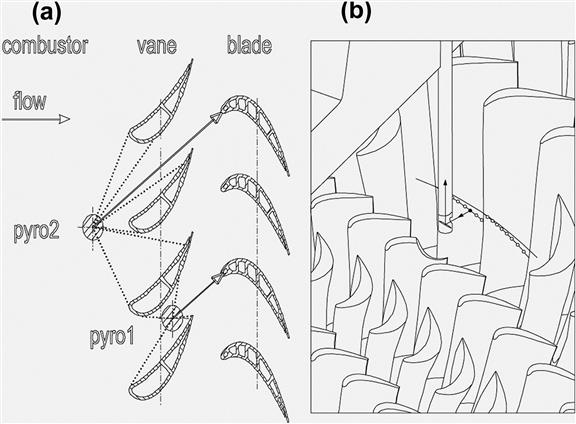
The first stage blades can be measured directly from pyrometer 1 positioned at the first stage vane outlet or from the combustor outlet (pyrometer 2). The result of the measurement is independent of the probe position for identical test conditions. Slight deviations are due only to decreased spatial resolution when the pyrometer is in position 2. Thus, unlike for flow probes, the 22 mm outer diameter size of the pyrometers has no influence on the results of measurement.
Figure 9–29(b) shows a schematic of the cylindrical pyrometer probe partly inserted into the hot gas path at the row 2 vane outlet in order to investigate the leading edge and pressure side of the row 2 blades. The blades are rotating past and the pyrometer receives temperature data from a certain radius. Additionally, a key phasor gives a once per revolution signal in order to determine the beginning of a new measurement.
During evaluation the 3D geometry software determines the intersection of the pyrometer beam and the rotating blade. Hence, each individual measurement point can be correlated to its origin on any blade.
The temperature vs. time plots of both systems for 10 blades are shown in Figure 9–30. The temperature values have been normalized by their mean value respectively. Both first stage blade measurements were accomplished during liquid fuel operation and are qualitatively in close agreement with one another.
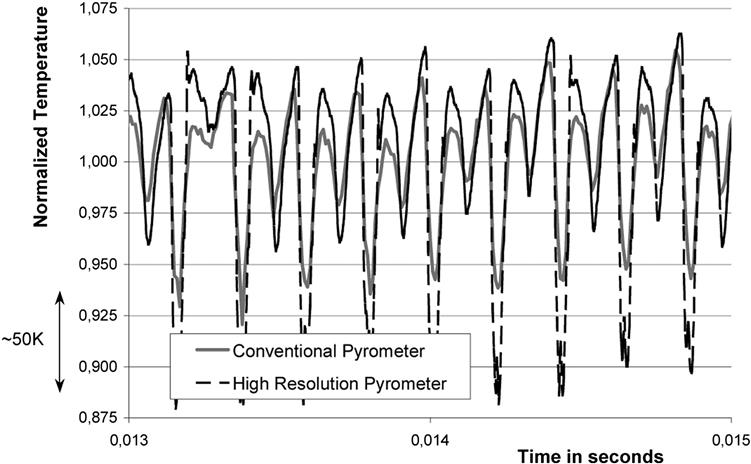
However, maximum and minimum values are, as expected, considerably higher resp. lower for the high-resolution pyrometer. Thus, the state-of-the-art pyrometer provides a more realistic thermal image than the conventional system.
In order to evaluate the measurement results for the first stage, additional measurements are necessary, in particular for the stationary vanes. The radial hot gas temperature profile is determined by thermocouple probes that are traversed slowly into the flow channel, alternately to the pyrometer probes. Therefore, one can account for inhomogeneous temperature distributions at the outlet of the ring combustor. Furthermore, the brightness temperature of the combustor outlet is measured by the pyrometer itself for natural gas operation at base load in premix mode. The results of these measurements are normalized by the maximum hot gas temperature and plotted against the normalized radius (Figure 9–31).
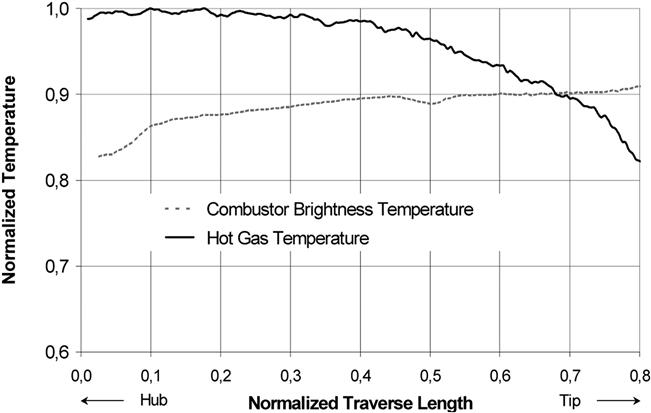
The hot gas temperature reaches its maximum relatively close to the hub, whereas the brightness temperature of the combustor shows maximum values close to the tip. The latter can be used for analytical corrections of the influence of combustor radiation. Please note that the brightness temperature of the combustor for liquid fuel operation is about 200 K higher at the same load conditions due to the bright yellow oil flames.
Thus, the error of the vane measurements can easily be in the magnitude of 100 K. Hence, the electronic receiver has been equipped with optical high pass filters that limit the effective wavelength from 0.75–1.10 μm, i.e., the visible portion is excluded. However, for vane measurements under natural gas premix operation (light blue flames, no soot) the combustor influence can be estimated as follows: a “true” vane temperature of 1000°C, a measured vane emissivity of 0.9 (±0.05) and a measured combustor brightness temperature of 1200°C yields a maximum error of about +40 K at the vane’s leading edge; further downstream it is considerably lower.
In order to get temperature information from most of the blading surface, the pyrometer probes are operated in a scanning mode. For vane measurements, a certain viewing angle is chosen and the pyrometer traversed quickly (1200 mm/s) from the tip to the hub and subsequently withdrawn. Only the data acquired during the inward motion is evaluated, in order to process only undisturbed temperature values. After a waiting period of four thermal time constants of the vane a steady thermodynamic state was established again.
Pyrometer System7
Radiation from a body is governed by Planck’s equation as described below.
(1)
where
C1: the first Planck’s constant
C2: the second Planck’s constant
q: radiance
T: target temperature in K
λ: wavelength
ε: emissivity
A pyrometer is an optical device that utilizes this correlation. It collects radiance emitted from an object and calculates the temperature.
A high-speed pyrometer system developed and supplied by Rotadata Ltd was used for L30A. Figure 9–32 shows the installation of the pyrometer. The probe head is fixed to the engine casing and the probe is inserted through the outer endwall of a vane. The vane is provided with a seal assembly that can reduce the loss of vane cooling air and absorb the relative displacement between the probe and the vane during engine operation. The probe usually stays outside the gas passage. During the measurement the probe is inserted into the gas passage and collects radiance. The measurement takes only about 20 seconds. After measurement, the probe is extracted from the gas passage again.
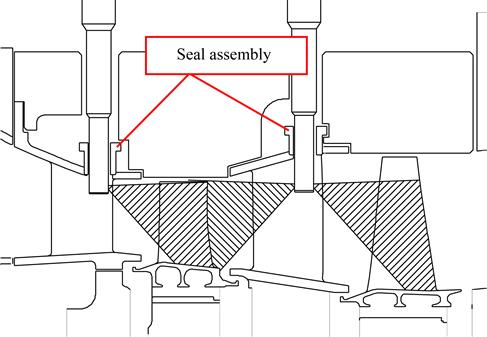
A small mirror is put inside the tip of the probe. The radiance emitted from a blade is reflected at the mirror and collected by the detector in the probe head. The data are transmitted via cable to the control computer. The mirror can continuously change angles to the probe axis. As the mirror oscillates, the radiance emitted from different radial positions can be collected. By synchronizing the data with once per rev signal of the rotor, each blade can be identified. The processing is automatically carried out in the system.
In the production engine, the vane with the seal assembly is assembled and plugged with special parts. When it becomes necessary to measure the blade temperature, the parts can be easily replaced with the pyrometer. And also, the seal assembly can be used as bore scope inspection ports and inspection inside the gas passage can be done through the ports at any time.
KHI have used Rotadata’s pyrometer system for M7A and L20A gas turbines before and made most of the system. The probe head for them contains a Silicon PIN diode, which can measure temperature down to 700°C. And therefore, 1st and/or 2nd stage turbine blades are the main target of the measurement. But the new detector module for L30A is upgraded to the InGaAs detector. The new detector can give an output signal with less electrical noise on it and nominal operating temperature can be lowered to 600°C. KHI further made a calibration test and concluded that the new pyrometer can measure temperature down to 550°C with acceptable noise level. So the pyrometer system can be used for all stages of blades in L30A (see Table 9–1).
TABLE 9–1
Major Specifications of Pyrometer System [9-1]
| Measurement Range | 600–1200 (nominal) |
| Resolution | +/− 1°C |
| Accuracy spot size | +/− 0.5% RD 2 mm diameter at 75 mm focal length |
| Detector | InGaAs |
| Sampling rate | 1MHz |
Pyrometer Calibration
The pyrometer was calibrated using a black body furnace before and after each engine testing. The calibration data were fitted to the following equation:
(2)
T is the target temperature and R is the radiance measured and normalized by the pyrometer. ε is the emissivity of the target and is the value of 1 for a black body furnace. λ and K are the effective wavelength and the efficiency of the pyrometer respectively and these are determined using a minimum least squares error method.
Figure 9–33 shows a calibration curve obtained before and after a certain engine testing. Slight degradation of sensitivity was found after engine testing. During the engine testing, high-pressure air supplied from a commercial compressor was used as purge air. Although a micro mist filter was installed between the compressor and the pyrometer, the optical system in the pyrometer was probably contaminated by the pollutant in the compressed air. Before next engine testing, the pyrometer was disassembled and the optical system was cleaned.
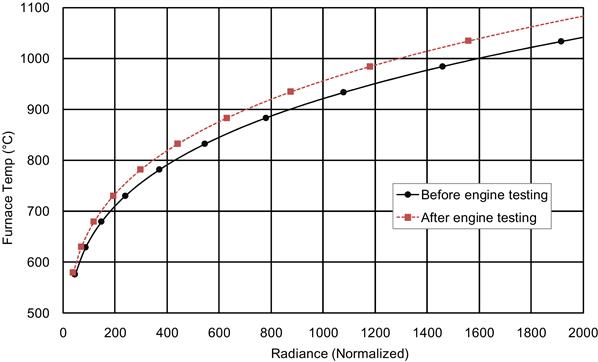
Repeatability of the pyrometer was also examined. Calibration was repeated six times and a calibration curve was obtained for each case. Figure 9–34 shows the temperature calculated with each calibration curve at a fixed and normalized radiance of 800. The deviation is within +/− 2°C, indicating that the pyrometer has sufficient repeatability.
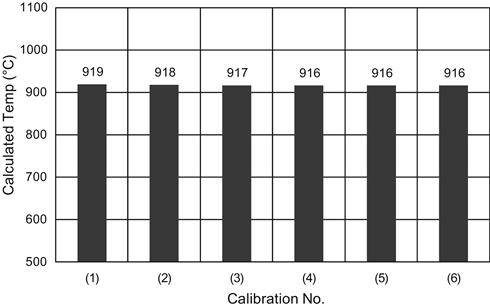
In the calibration, the effective wavelength of the pyrometer is determined to be approximately 1.6 μm. Although gaseous medium like water vapor and CO2 in the main gas stream also absorbs and emits radiation, these absorptions and emissions do not occur in the range between 1.5–1.75 μm.8
So in the engine testing, radiance measured by the pyrometer is not influenced by gas absorption and emission.
The short wavelength pyrometer which utilizes wavelength near 1 μm is not suitable for blades coated with TBC.9
Although TBC is applied to the production type of GGT-1B, several blades without TBC were assembled together.
Engine Installation
The pyrometer setup is shown in Figures 9–35 to 9–37. The pyrometer can be attached to several locations on the engine casing depending on the measurement target. At each position, it can be fixed at different circumferential angles. Thus, the detector can collect radiance emitted from a broad area on the blade surface.
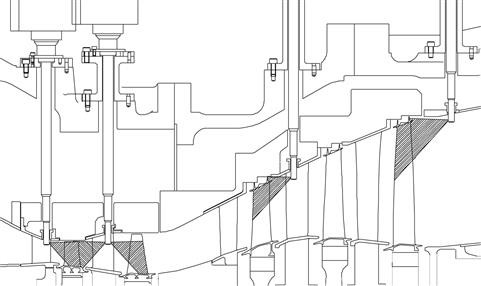
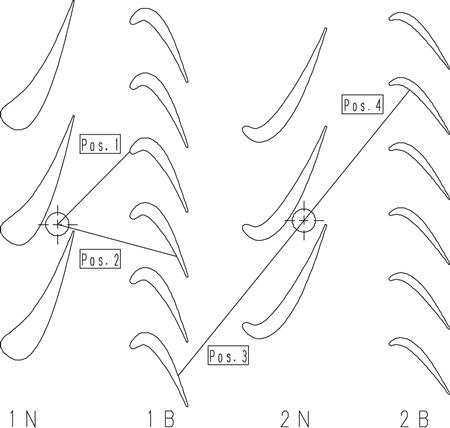
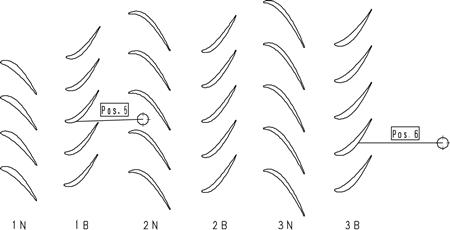
As the probe is exposed to high-pressure and high-temperature main stream gas, it needs to be air-cooled during the engine testing. High-pressure air from a commercial compressor continued to be supplied to the probe at a maximum flow rate of 0.1 kg/s, which is far less than the main gas flow rate of 86.5 kg/s. In the engine testing of M7A, we confirmed that the cooling air of the pyrometer had little influence on the blade temperature. For L30A, the influence is even smaller since the ratio of cooling airflow rate to main gas flow rate is much smaller than that of M7A.
Digital Telemetry
Digital telemetry offers many “space age” possibilities. It is what enables a diagnosis team on the ground, a test pilot, or the diagnostic interface of an engine in flight to read and transmit data that, when interpreted by human or automated means, can save millions of revenue dollars. For instance, the data sent by telemetry (air to ground) could mean, for instance, that a module on a specific engine needs to be removed when the plane lands and a spare rotor used to replace it, before the engine can take off again.
Similarly, telemetry has great uses in offshore platform or remote plant and field operation. It offers the same potential to marine end users, too; however, ship and ferry engineers tend to be a rather self-sufficient crowd by necessity and culture. Their engine data can certainly be transmitted to on-shore offices; however, the engineer on board often has taken action before getting a call from a “land” office.
The two hardware units described next reflect the current state of digital telemetry instrumentation. The reader may contact the source for further operating data, as well as internet search for manufacturers of similar products.
Rotatel™ Telemetry Unit
Application
This compact, robust, digital telemetry unit is designed to provide clear signals of data transfer for up to 178 points of pressure, temperature and strain gauge measurements from rotating assemblies. Rotatel is an air-cooled unit, intended as a replacement for brush contact high-speed slip-rings, which have a short life and require CFC loaded freon as a coolant.
Principle of Operation
Rotatel consists of a series of rotating transmitter modules (and overhead modules), built into cassettes and mounted in a rotating assembly. These are hard wired to engine or rig mounted sensors in a self-contained unit complete with air-cooled bearings and power coils.
For simplicity of installation, this part is configured in two sections.
An independent bearing assembly (IBA) is mounted onto the rig or engine by a flange connection to ensure shaft concentricity, with a positive drive provided by a flexible hexagonal insert, through which the instrumentation cables enter the telemetry slip-ring unit. These wires are positively soldered to an integral circular PCP, which is set into the IBA.
A separate electronics assembly module (EAM) houses all the telemetry modules. The EAM is connected via a spigoted flange connection to the IBA. Instrumentation wiring to the modules is arranged via a separate, matching circular PCP to that in the IBA. Precision pins align the two PCBs and ensure a positive drive between the units, while a multi-pin connector provides a positive electrical bridge between the two.
A high-frequency supply is fed to the slip-ring telemetry unit from the telemetry groundstation. This powers the coils of the telemetry system, so that even when the unit is stationary output readings from the instrumentation may be recorded. An optical data link relays clean, noise-free signals of dynamic strain, pressure, and temperature, at rotational speeds up to 25,000 rpm.
The five equi-spaced rotating cassettes containing the telemetry modules are housed in a rotor, which is mounted on sealed, grease lubricated high-speed bearings. The air-tooled assembly is totally self-contained and includes the integral power transfer coils and an optical data link.
The module architecture can be varied to suit the variety of parameters being measured. Of the five cassettes, one is used for the power supply and to digitize the output signals. The remaining four can transmit either dynamic strain, temperature or pressure, in a configuration to suit the application.
This unit is supplied fully tested, fully balanced, spin tested and set up for immediate coupling to the test vehicle. It operates at speeds up to 25,000 rpm in a compact, air-cooled unit.
Minitel™ Telemetry Unit
Application
This compact digital telemetry unit is designed to provide clear signals of data transfer for up to 50 points of pressure, temperature, and strain gauge measurements from rotating assemblies. Minitel is an air-cooled unit, intended as a replacement for brush contact high speed slip-rings, which have a short life and require environmentally damaging coolant.
Principle of Operation
Minitel consists of a series of transmitter and overhead modules mounted in a rotating assembly. These are hard wired to engine mounted sensors in a self-contained unit complete with air-cooled bearings and power coils.
An optical data link transmits clean, noise-free signals of dynamic strain and temperature in a variety of combinations at speeds up to 35,000 rpm.
Specialized Diagnostic Systems
Today, different diagnostic techniques are used individually or in complementary application, as the following case studies illustrate.
Case Study 1: A Survey of New Technologies Used by Siemens Energy for the Monitoring and Diagnosis of a Global Fleet of Power Generation Systems10
This case outlines one OEM’s preferred methods in GT system fault diagnosis with their10 Power Plant Automated Diagnostics Systems, Blade Vibration Monitor (BVM), Fiber Optic Vibration Monitor (FOVM), and the Radio Frequency Monitor (RFM).
WIN_TS is a passive, PC-based system that interfaces with the I&C system to acquire data. It is not designed to interface with any I&C plant operation functions or plant operating setpoints.
Data can be monitored in real time if certain events are detected that could be a potential issue to generating system operation. A watchdog function is programmed to automatically alert technicians in the Power Diagnostics® center when a defined plant operating anomaly is reported.
The analysis goals of acquired data can be broadly segregated into three categories: Monitoring, Diagnosis, and Prognosis. The goal of monitoring acquired data is the assessment of the quality of the data (i.e., sensor health, active data acquisition) and the assessment of the operational state of the monitored site (i.e., starting, stopped, producing power, operating within limits).
On a monitored site the Power Diagnostics® Services Automated Expert System registered a shift in engine parameters weeks before a maintenance outage was to be performed. A Siemens turbine specialist assessed the severity of the trend. Possible causes and effects were reported to the Siemens program manager. The most probable cause was identified as debris in the fuel nozzles (Figure 9–38) and the customer was made aware of the issue. Turbine hardware and operational impacts, such as potential complications during load changes, shutdown or startup were assessed. The customer and Siemens worked together to monitor the parameters. The plant remained in operation until maintenance could be scheduled at a time convenient to the customer’s needs. Because Power Diagnostics® Services were able to pinpoint the location of the issue, when the outage was performed the clogged nozzle was clearly identified, the debris removed and the outage duration minimized.
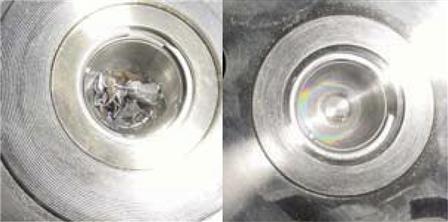
Fiber Optic Vibration Monitor
The Fiber Optic Vibration Monitor, or FOVM Model 2a, is used to monitor stator end winding vibration levels at high electric potential during generator operation. The system is designed to provide for the identification of changes within the generator and the opportunity to take early corrective action before extensive stator winding damages occur. In most cases, the monitor permits the utility to hold stator winding vibration below destructive levels by load, power factor, and cooling gas temperature adjustment.
The monitoring of stator winding vibration levels during operation has been made possible by the development of fiber optic vibration sensors. Fiber optic vibration sensors permit the transmission of stator vibration data from sensors mounted directly on the stator end windings to a multi-channel monitor external to the generator. The analysis of online vibration data provides a tool to assist in the determination of the present condition of components of the stator winding and to predict maintenance intervals based on vibration changes.
The accuracy of forced-vibration sensors, like those used in the FOVM Model 2a, is sensitive to changes in the sensor natural resonance frequency. The natural resonance frequency of a sensor can change due to changes in operating temperature and, to a lesser degree, sensor aging. To greatly reduce the effect of these changes on the monitor's vibration measurement accuracy, the FOVM Model 2a uses a patented algorithm that measures all sensors’ natural frequencies automatically and online, and adjusts the reported vibration measurement for any detected natural frequency drift. In addition, the algorithm removes inherent variations in sensors introduced during manufacture. These capabilities are collectively referred to as autocalibration. Autocalibration provides a significant enhancement to vibration measurement accuracy, resolution, and the detection of failed sensors.
FOVM Sensor
The fiber optic sensor consists of a reed constrained on one end, with the other end free to vibrate. On the vibrating end of the reed is a grid, placed in between two optical fiber ends (see Figure 9–39).
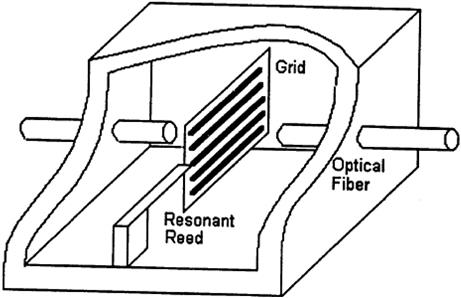
A beam of light is sent to the sensor grid by the transmission fibers. The light is then chopped by the grid, and the return fiber brings the modulated light signal back to the detector. The grid, containing a series of closely spaced slits on its surface, is placed directly in the light path. As the reed vibrates, the grid alternately blocks and passes the light, creating a pattern of light pulses, characteristic of the vibration amplitude of the grid. The light pulses containing the vibration information leave the sensor through the optical fiber, pass through the pressure seal, and continue through to the detector. The frequency of light pulses generated in this manner is proportional to the reed amplitude. The signal waveform produced by the sensor is shown in Figure 9–40.
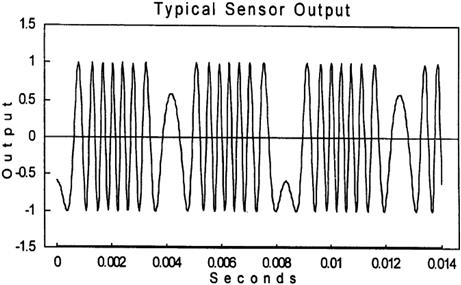
Blade Vibration Monitoring System
The Siemens BVM4 (Blade Monitoring System) is unique in many respects, the most notable being the sensing requirements. Most blade vibration systems require the installation of multiple sensors for each monitored row of blades, but the BVM4 system requires only a single sensor. Additional sensors can be installed to provide redundancy, but are not required for full system functionality. With only one sensor, the BVM4 offers greater accuracy than many competing monitoring systems.
The BVM4 has been installed successfully in many units in many locations. The primary use has been for steam turbines but the system can be installed in gas turbines as well. The BVM4 has a sophisticated analysis software package, which includes a user-friendly interface. The goal of the BVM4 is to allow the user to constantly monitor the behavior of installed blades. The monitor’s software allows for a precise and sophisticated analysis of all of the blades in a monitored row.
The BVM4 system configuration consists of two electronics packages, the Fiber Optic Communication Module (FOCM) and BVM4 Main Chassis, and a probe set for each turbine row. The BVM4 system is provided as a four or eight row non-synchronous turbine blade vibration monitor.
Radio Frequency Monitor
Stator winding failures associated with deterioration of interstrand and groundwall insulation, and the mechanical failure of copper strands within the coil, can lead to an unscheduled unit outage. The cost of parts, labor, and replacement power associated with such events may represent a major loss to the utility. The Radio Frequency Monitor (RFM) has been designed to provide a warning of electrical malfunctions in and around the generator that may be associated with an arcing condition. The RFM is designed to detect the RF level that exists at the neutral lead of the generator at a point just above the neutral transformer. This activity represents a single variable, and by itself, may not contain sufficient information to diagnose the root cause of an RFM alarm. Trending, correlation with other generator variables and additional tests may be required to isolate the source of the RF energy.
The RF level and associated alarms are based solely on the average RF pulse height and duration of activity detected at the neutral lead. The sources of this RF signal may be divided into three groups:
1. Group 1. Signals from within the generator such as the stator windings and winding connections.
2. Group 2. The signal derived from generator subsystems such as the exciter, shaft and rotor winding ground detection brushes, rubbing seals, and buses.
3. Group 3. All sources external to the generator and generator subsystem such as motors, switches, welders, lightning, and communication signals.
The RFM detects that portion of the pulse having frequency components within the detection window. The amplitude of the detected RF is a symptom of an electrical malfunction in the system, but not a measure of its severity. Nor is it an indication of the progression of degradation. The amplitude of the detected RF is determined by such factors as the physical nature (type) of the RF source; the site of the malfunction within the generator; the attenuation of the RF signal as it travels to the detection site and the impedance at the detection site. A rapid fall in RF below alarm level may be indicative of progressive physical system degradation causing the arc to extinguish, instead of indicating that conditions have improved. Further high RF level can be expected as physical conditions at the fault change, and again favor an arcing condition.
Case Study 2: Pulsation Analysis: New Techniques and Their Limitations11
This section describes the use of spectrum analysis on combustor pulsation measurements to diagnose hot section faults. The gas turbines are Alstom GT 11Ns (power generation application).
The emissions requirements imposed by the EPA, the trend towards higher gas turbine efficiency, lower cost per installed kW, etc., has caused gas turbines to operate much closer to flame stability limits and other design limits as was previously the case. This in combination with the need to maintain high availability and reliability requires OEMs to address the issues of monitoring systems and predictive maintenance in a new way.
The incident occurred at a power plant that was built and commissioned in the late 1980s by ABB may serve as an example to illustrate this need. The plant consists of 12 ABB type GT11N gas turbines that had been operation for approximately seven years. During the fall of 1996 some unusual and fluctuating bearing vibrations had been noted on one unit. The owner notified ABB, but by the time an investigation was initiated, one hot gas casing (transition piece between combustor liner and turbine inlet) had already failed causing a catastrophic failure. Within a short period of time it was found that combustor pulsations (pressure fluctuations of the combustor discharge pressure) were causing the problem. Not only were they high, but the dominant frequency was very close to the natural frequency of the hot gas casing. All units were inspected and another four damaged hot gas casings were found. Unfortunately, the available operating data trends were neither sufficient to indicate when the problem had begun nor what has caused it.
Prevention of Catastrophic Failures
From an OEM point of view, the early detection of component failures that could cause a catastrophic turbine failure clearly has a high priority. The analysis of the incident described in the previous sections makes it clear that the monitoring and trending of a few operating parameters would have given a clear indication of the deteriorating performance. In addition it shows that monitoring of the combustor pulsations is very important and cannot be replaced by monitoring of other parameters.
Increased Reliability, Availability, and Equipment Performance—User Requirements
From a user’s point of view, the early detection of component failures is important as it impacts the reliability of the plant, but in addition the user has some additional requirements such as:
• Optimize equipment performance
• Provide the basis for or assistance in predictive and preventive maintenance programs
• If a component failure has been recognized, the system should allow, if possible, the safe operation at reduced power output until an outage can be scheduled with the objective to minimize the loss of revenue.
In today’s competitive world, the above goals must be achievable in a timely manner without requiring especially skilled personnel.
Development of the Monitoring System
Selection of Relevant Operating Parameters
Taking the requirements of the previous sections into account (time, skill of personnel) and the fact that most operating parameters vary with varying ambient conditions, it becomes obvious that monitoring and displaying only directly measured parameters is not sufficient.
In order to allow an easy interpretation and financial evaluation in a timely manner, the following parameters must be provided by the system:
• Gas turbine power output corrected to ISO and/or guarantee conditions
• Gas turbine efficiency corrected to ISO and/or guarantee conditions
• Turbine efficiency corrected to ISO and/or guarantee conditions
• Compressor efficiency corrected to ISO and/or guarantee conditions
• Turbine firing temperature (based on a heat balance calculation; this temperature may differ from the temperature indicated by the control system)
And last but not least, the combustor pulsation must be monitored. This parameter requires a little more attention than the previously mentioned parameters. The evaluation of the failures that were caused by elevated pulsation shows the importance of the frequency spectrum of the pulsation. Figure 9–41 shows a typical pulsation spectrum obtained from an ABB GT11N-EV gas turbine. Obviously a well-defined peak at a given frequency is more damaging to the equipment than is a “white noise” type of pulsation, even though the overall RMS level of the two signals may be the same.
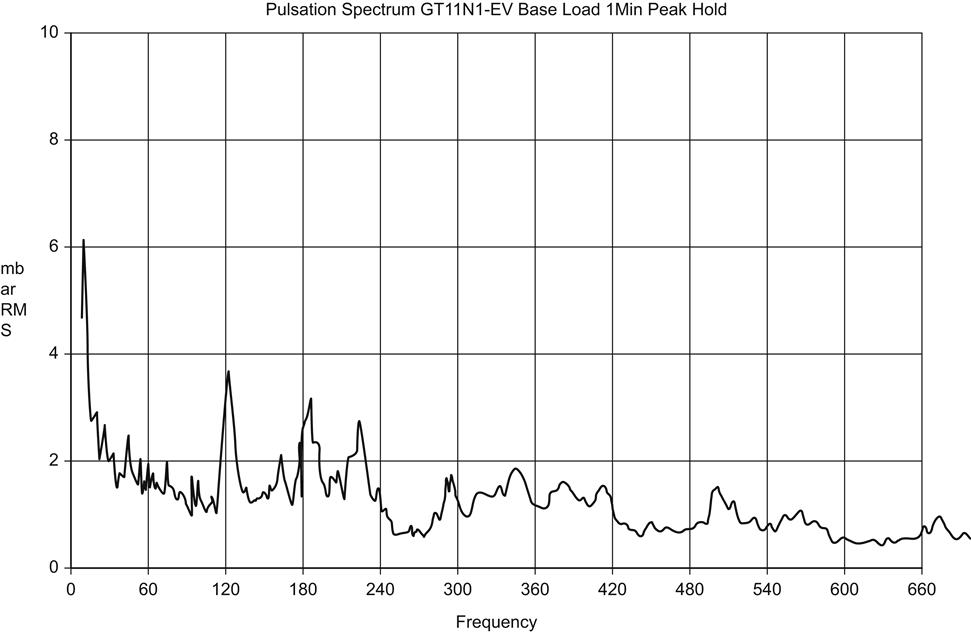
Thus the system must provide the following values:
In addition, the system must be capable of monitoring user-defined operating parameters.
Data Archiving
The system must provide a data archive that allows the following tasks:
Modular Program Structure
The monitoring system is a PC-based tool that reads process data from up to three different sources simultaneously (see Figure 9–42).
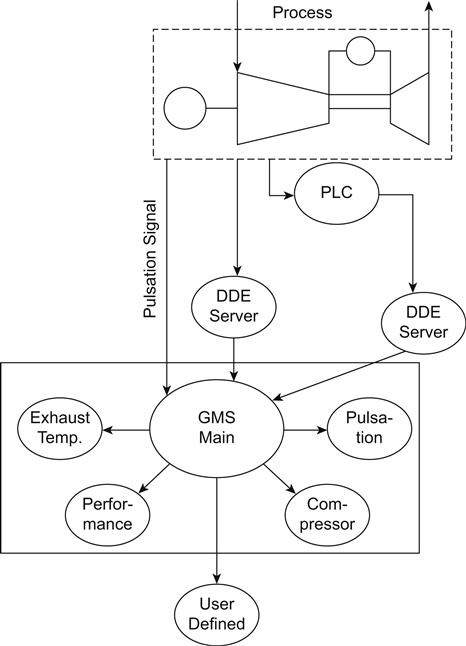
The modular structure was chosen, among other reasons, so that:
Instrumentation
For the measurement of the combustor pulsations a heat resistant piezoelectric pressure transducer is used. The transducers have been used in several gas turbines for several years without failing. The transducer must be installed as close to the burner as possible. By placing the transducer close to the source for the pulsations, the likelihood of measuring in the vicinity of the pressure node is relatively small.
Installation of the Initial Systems
The monitoring software was first installed on two ABB type GT11N1-EV gas turbines in the summer of 1997. The main features of this gas turbines model are:
On this type of gas turbine the pulsation probe is located in the transition piece between the silo combustor and the turbine inlet.
The system was monitoring combustor pulsations including the complete frequency spectrum and approximately 100 operating parameters. In the fall of 1998 the system was expanded to include exhaust gas (TAT) multi-point thermocouples and additional software to perform an on-line heat balance (including calculation of the true turbine inlet temperature) and compressor surge monitoring.
The past three years have shown that the following signals are the most valuable when trying to judge the condition of the hot gas path components:
The following sections describe the conclusions that can be made based on these signals.
Pulsations
The combustor/burner specific spectrum is best seen when using a one-minute peak hold spectrum. A typical example for this turbine is shown in Figure 9–42.
This type of burner arrangement exhibits two characteristic frequencies.
The amplitude of the one in the 124 Hz range can be influenced by the overall fuel/air ratio and by the flow pattern downstream of the burners. Increased air leakage between the combustor inner liner and the burners will impact the amplitude of this frequency.
Large amplitudes in the range of 10–12 Hz indicate that some burners are starved of fuel. If the fuel and air distribution is correct, this frequency should not be dominant.
A crack in the general vicinity of the transmitter or a shift in the position of the casing, in which the transmitter is supposed, can falsify the signal significantly. An example is shown in Figure 9–43.
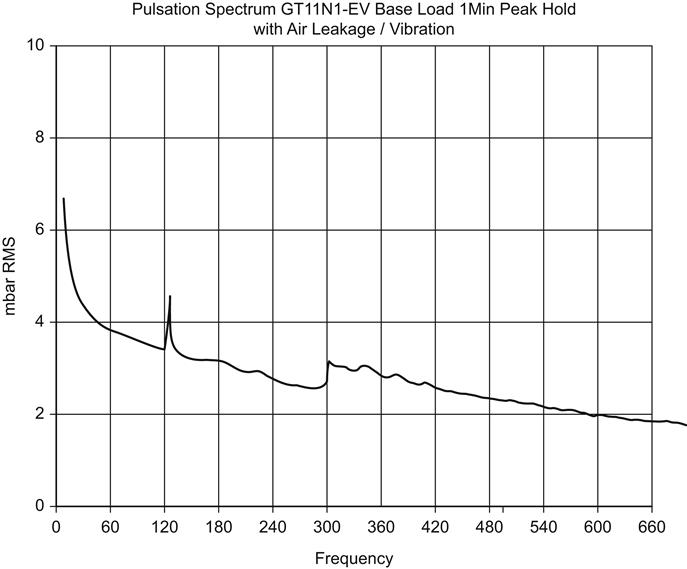
This is a particular good example of why the frequency spectrum is important. Would the above signal only be measured and displayed as an RMS value, one would only observe a huge increase in the signal level. If this were the only information available, the above signal would require the unit to be shut down and inspected. The spectrum, however, permits us to make the following observations:
• The increase in the RMS value is caused by an increase in the amplitudes across the entire spectrum
• The amplitudes of the characteristic frequencies are within the expected and permitted magnitudes
If this phenomenon is observed and the spectrum is available, the unit can be kept operational until an inspection can be scheduled. Naturally the unit needs to be monitored closely to watch for other indications of component deterioration.
Summarizing the above, the following statements can be made:
• The one-minute peak hold spectrum shows the characteristics of the combustion pulsation spectrum more clearly than a real-time spectrum
• The amplitude in the 124 Hz range is a function of the overall fuel/air ratio and the flow pattern downstream for the burners
• The amplitude in the 10 Hz range is an indication of burners being starved of fuel
Typical magnitudes of the characteristic frequencies but otherwise increased amplitudes across the spectrum indicate possible shifting casing positions and/or leakage airflow around the transmitter.
NOX Emissions
On a GT11N1-EV the NOx emissions are mainly a function of the fuel/air ratio. The NOx emissions are very sensitive to the local fuel/air ratio. Thus if changing emissions are observed for a given operating condition, they can be caused by any of the following conditions:
1. Cracks in the combustor liner or hot gas casing or increasing clearances allowing air to bypass the burners
3. Incorrect fuel distribution caused by manifold piping or valve positions
Item 2 through 4 can usually be ruled out fairly easy by checking the condition of the gas filter, gas valve positions and the gas quality.
Thus if a change in the NOx emissions is detected and items 2–4 can be eliminated as a root cause, one has a strong indication that one or more hot gas path components are deteriorating.
Turbine Exhaust Temperature Profile
Unlike the NOx emissions that for a given operating point are pretty constant the temperature profile after the turbine is affected by ambient conditions and the period of time that the gas turbine has been operating at the given load. The latter is only significant during the first 4 hours after a start. On a unit that starts daily and only operates for 10–14 hours per day, this effect can make the detection of changes in the profile difficult as the ambient conditions typically change during operating period as well.
An inspection of the unit revealed that the combustor inner liner indeed had a crack that most likely was created during operation on fuel oil with high pulsations on January 8, 1999. Thus, the TAT spread is a good indicator for cracks in the hot section of the turbine, but on daily cycling units the change in the profile may be difficult to detect.
Case Study 3: Performance and C&I System Verification with Modeling12
This section describes an OEM’s (Rolls Royce) modeling strategy. The gas turbine in question is an intercooled, recuperated WR-21 (naval application). Due to the complexities of the operating cycle, getting the engine to a point that it can compete in three different markets requires careful analysis. The full paper is considerably more comprehensive than the illustrative extracts included here.
WR-21 Engine Cycle
Figure 9–44 presents the intercooled and recuperated WR-21 engine cycle.
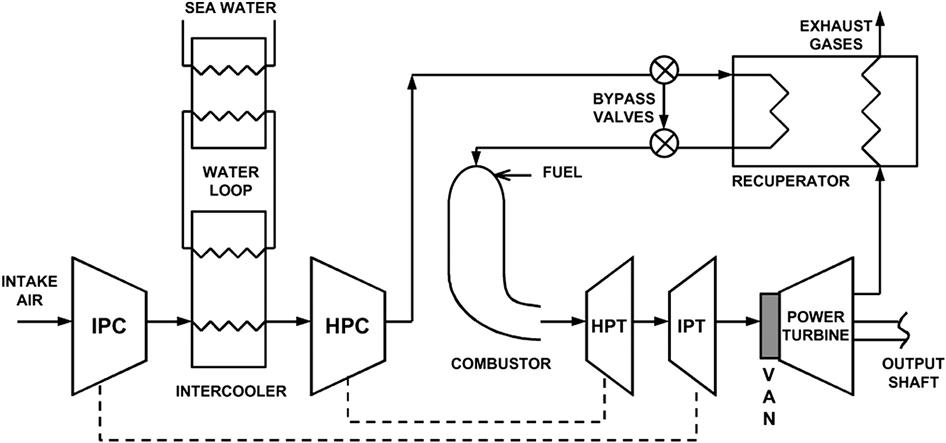
Air is admitted through the intake ducting system and the radial air intake into the engine. The air is first compressed by the six-stage intermediate pressure compressor (IPC), before being fed to the on-engine intercooler. This heat exchanger uses a closed loop flow of freshwater and glycol, which is itself cooled by a seawater off-engine intercooler.
The aim of the intercooler is to reduce the following six-stage high-pressure compressor (HPC) air entry temperature, hence lowering the specific work required to achieve a given HPC pressure ratio. This enables more specific power to be extracted from the engine, and provides a lower recuperator air-side inlet temperature permitting maximum heat recovery in the recuperator. Intercooling alone is a fundamentally inefficient process, as heat is actually removed from the overall cycle, but its association with recuperation allows for the recovery of engine thermal efficiency, while preserving the power boost due to the intercooler.
The air coming out of the HPC is directed to the recuperator that is used to recover heat from the exhaust gases in order to preheat the compressor delivery air before its entry into the combustor. By returning this heat to the cycle, less temperature rise (and therefore fuel) is required in the combustors to achieve a given turbine entry temperature. After passing through the HP and IP turbines (HPT and IPT), driving their associated compressors, the combustion products enter the power turbine through first-stage variable area nozzles (VAN). The VAN are used to optimize the recuperator performance by controlling the power turbine capacity, which in turn maintains a high recuperator gas side inlet temperature. This enables optimized control over the air-side heat transfer, and hence high recuperator effectiveness across the power range.
The cycle gives significant specific fuel consumption (SFC) savings compared to a simple cycle gas turbine across the power range as presented in Figure 9–45.
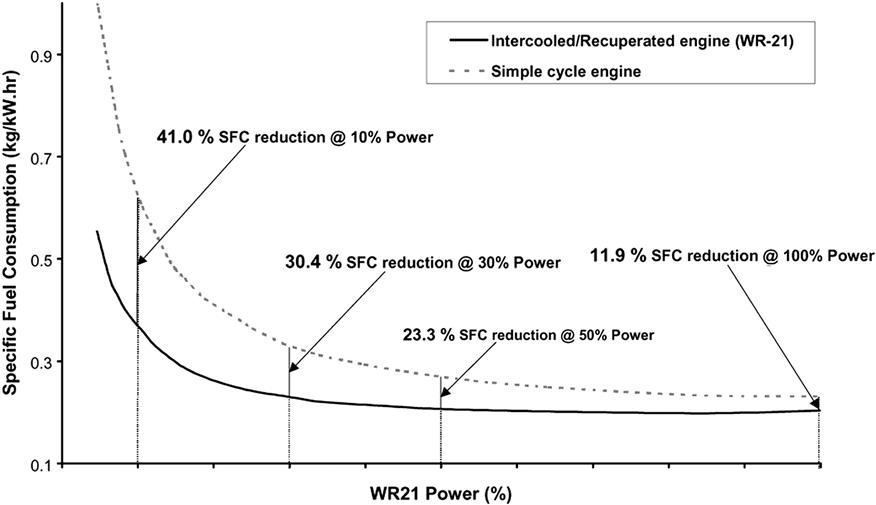
Rolls Royce’s Corporate Analysis Method
Representative simulation methods are required to accurately model gas turbine engines as complex as the WR-21. A predictive model is required, and this model needs to be aligned to actual engine test data to produce a fully representative model. The Rolls Royce corporate method for aligning predictive models to test data is called ANSYN.
ANSYN is a shortcut for ANalysis-SYNthesis. An analysis program calculates the individual performance of each of the engine components (isentropic efficiency, pressure drops, effectiveness, etc.) from numerous measurements at different stations in the engine (air mass flow, fuel flow, shaft speeds, total pressures, and temperatures).
A synthesis program works in the opposite direction. It uses predictions (or assumptions) of component performance (compressor/turbine characteristics, pressure drops, air mass flows, etc.) to synthesize the value of thermodynamic parameters like air mass flow, shaft speeds, station temperatures, and pressures at each engine station. It is merely a predictive simulation program.
Both the synthesis and analysis models use numerical methods to simulate steady-state gas turbine performance. Model matching takes the usual form of a damped quasi-Newton method to solve the thermodynamics of the model through matching iterations. The program starts with guesses of the compressor working points, heat exchanger air-side exit conditions, combustion fuel/air ratio, power turbine nozzle area, intake mass flow, and output power. Using flow continuity and equality of powers and speeds, the turbine capacities, recuperator exit conditions, compressor inlet flows, and engine exit/inlet pressure are calculated. These are compared with the required values to derive a set of errors.
An iterative procedure is used to refine the guessed values until the errors are smaller than a specified tolerance.
The calculations that the paper describes with respect to gas and heat transfer dynamics, as well as dynamic controls simulation, will not be repeated here; however, the OEM may be contacted for the full paper and more recent work in this vein. A few figures of “operational events” and their description are included below, however.
Figure 9–46 shows a series of load rejections modeled with the WR-21 transient model in an electric drive configuration.
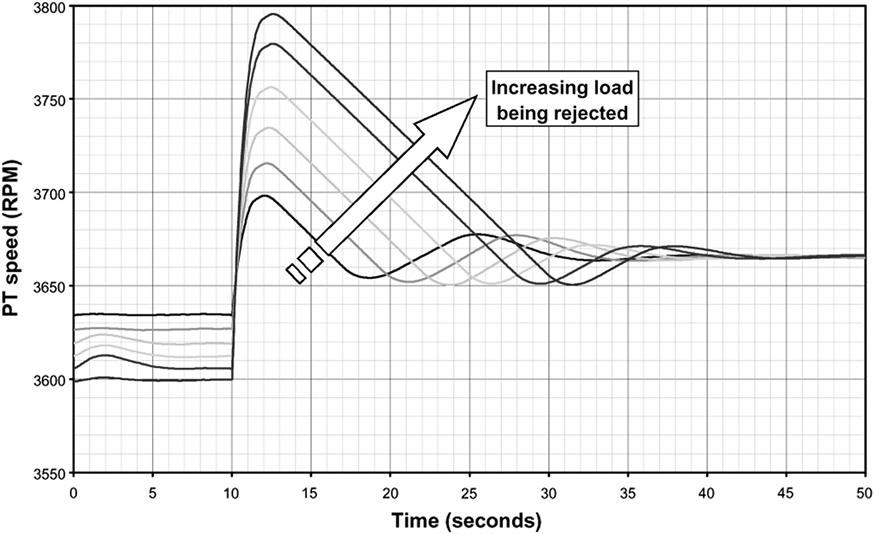
The load rejection is triggered instantaneously by simulating generator breakers opening. The engine detects that the generator load has been rejected by seeing a sudden power turbine acceleration. The load rejection control logic is activated that minimizes the power turbine overspeed, whilst ensuring constant engine stability, to bring the engine back to idle in the shortest time possible.
The amount of dynamic detail required in a model depends upon its application. Shaft dynamics may be sufficient for general engine operability and preliminary control assessment studies, but in the case of the WR-21 engine, where the model is also used for hardware validation and safety analyses, more comprehensive dynamic modeling is required. (See original Rolls Royce work for all details.)
Model data is featured in Figure 9–47. An emergency stop is the fastest deceleration that a gas turbine can experience in a mechanical drive configuration. The sequenced opening of the IP compressor blow-off valves (BOV) to maintain an appropriate stability margin all along the transient maneuver explains the bigger “steps” seen on the running line.
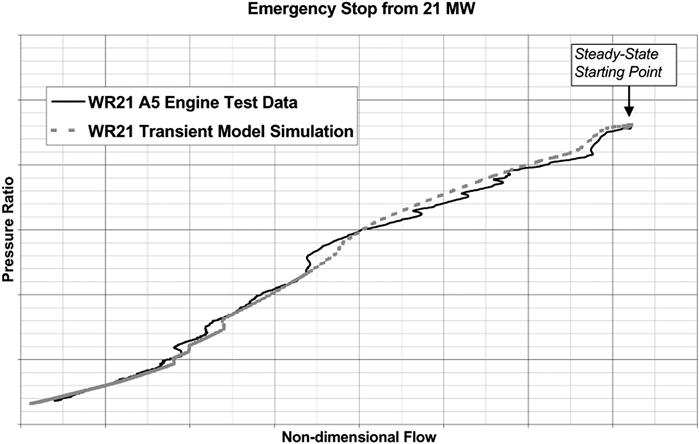
The drivers for an elaborate control logic are the presence of the heat exchangers, the large volume of the recuperator and the presence of the VAN. The WR-21 has to be optimized for three modes of operations based on the heat exchangers' state.
The recuperator active and intercooler operative mode is the normal operation mode. It is also the mode where the specific fuel consumption benefits gained from the innovative thermodynamic cycle have to be optimized.
The engine must also be able to achieve the same power in the recuperator bypassed and intercooler operative mode as in the previous mode of operation.
Finally the recuperator bypassed and intercooler inoperative mode is considered a “failure mode” since the engine is supposed to experience it only when the intercooler is at fault, or during maintenance.
Not only do the control laws have to withstand the three modes of operation, but they also must ensure that transitions between those modes can be performed at any power while the engine is running.
To compete in all markets the WR-21 engine must operate in a mechanical drive version (as developed originally) as well as in an electric drive version. The entire electric drive development has been performed with the transient model so far.
Since 1998, the growing interest from the Navies for an electric drive version of the WR-21 gas turbine engine encouraged the team to develop a specific logic to cope with the specific demands of this operation mode, especially during load sheds as shown in Figure 9–46. Using the transient model, the load shed detection, fuel flow drop, and bleed switching logics have been designed in order to limit the top speed and recover quickly to idle.
Figure 9–48 shows the difference in top speed achieved for different bleed configurations. This highlights the necessity of having an HP6 bleed (downstream of the HP compressor), and the benefits it brings in limiting the top speed. Extracting air from HP6 removes a significant amount of the air flow from the gas path. This in turn allows a larger drop in fuel flow without the risk of flameout since the fuel-to-air ratio remains high enough at any time. The presence of HP6 brings further benefits in permitting to open the remaining BOV earlier in the load rejection sequence.
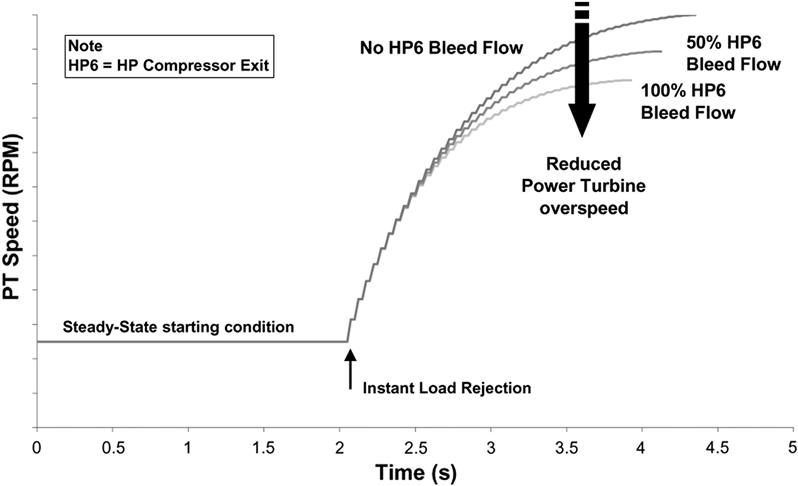
In summary, since the beginning of the WR-21 program in December 1991, the Performance and Controls team has had to overcome significant technical challenges to successfully design and develop this intercooled/recuperated gas turbine engine.