
Aircraft Cost Analysis
Abstract
An introduction to the state of the GA industry is provided, using industry data dating back to 1945. Reasons for its current state, including liability costs, are discussed to shed light on the volatility of the GA market. Then methods to calculate project development and operational costs are presented. The development cost is estimated using the so-called Eastlake model, which is based on the so-called DAPCA-IV aircraft procurement cost analysis method that has been especially tailored for GA aircraft. This is presented for conventional GA aircraft and business aircraft. Then, methods to help estimate the operational cost of operating GA and business aircraft is presented. Such methods are essential when trying to demonstrate whether the new aircraft will be more or less expensive to operate than competitor aircraft.
Keywords
DAPCA-IV; strict liability; tort reform; GAMA; learning curve; experience effectiveness; quantity discount; Eastlake model; development cost; operational cost; manhours; engineering; tooling; manufacturing labor; quality control; materials; certification; project cost; break-even; maintenance; storage; fuel; insurance; overhaul
Outline
2.1.1 The Content of this Chapter
2.1.2 A Review of the State of the GA Industry
2.2 Estimating Project Development Costs
2.2.1 Quantity Discount Factor
2.2.2 Development Cost of a GA Aircraft – the Eastlake Model
Number of Engineering Man-hours
Number of Manufacturing Labor Man-hours
Total Cost of Development Support
Total Cost of Flight Test Operations
Cost of Retractable Landing Gear per Airplane
Cost of Power Plant (engines, propellers)
2.2.3 Development Cost of a Business Aircraft – the Eastlake Model
Number of Engineering Man-hours
Number of Manufacturing Labor Man-hours
Total Cost of Development Support
Total Cost of Flight Test Operations
Cost of Retractable Landing Gear per Airplane
Cost of Power Plant (engines, propellers)
2.3 Estimating Aircraft Operational Costs
2.3.1 Operational Cost of a GA Aircraft
Maintenance to Flight Hour Ratio
Annual insurance cost ($ per year)
Annual Inspection Cost ($ per year)
Engine Overhaul Fund ($ per year)
Annual Loan Payment ($ per year)
2.3.2 Operational Cost of a Business Aircraft
Maintenance to Flight Hour Ratio
Annual Insurance Cost ($ per year)
Annual Insurance Cost ($ per year)
Engine Overhaul Fund ($ per year)
2.1 Introduction
The estimation of the cost of developing an aircraft is an essential part of the design process. We may have conceived of the world’s most interesting airplane, but is it worth the effort and cost to manufacture? If we are convinced it is, how many airplanes do we intend to manufacture? What will be the cost of each to the customer? How many will we need to manufacture before we break-even? How many engineers or technicians are needed to develop the aircraft? All of these are very important questions and this chapter is intended to answer some of them.
The development and procurement costs of aircraft (DAPCA) is a method used to estimate the development cost of new military aircraft. It is developed by the RAND Corporation, and is described in a report [1] available on its website [2]. The method, which is commonly referred to as DAPCA-IV,1 establishes special cost estimating relationships (CERs), which are a set of statistical equations that predict aircraft acquisition costs using only basic information like empty weight and maximum airspeed. The DAPCA-IV can be used to estimate cost for research, development, testing, and evaluation (RDT&E) and even allows workforce estimation to take place. In short, the CERs estimate the cost of (1) engineering, tooling, manufacturing labor, and quality control; (2) manufacturing material, development support, and flight testing; and (3) total program cost.
The CERs are presented as a set of exponential equations that were developed by applying multi-variable least-squares regression analysis to practically all US military aircraft in service and production at the time of its inception. Consequently, the model is highly biased toward the price structure adapted by the Pentagon, which does not apply to the GA aircraft industry. This can be seen in the grossly overestimated development costs for GA aircraft predicted using the unmodified DAPCA-IV method. Professor Emeritus Charles Eastlake of Embry-Riddle Aeronautical University has adapted the original DAPCA-IV formulation to GA aircraft to better reflect the development and operational cost of such airplanes. The method presented in Ref. [3] explains and makes justification for the modifications made to the original DAPCA-IV model. This method has been extended to include executive-class aircraft as well.
2.1.1 The Content of this Chapter
• Section 2.2 presents methods to estimate the costs involved in developing new GA aircraft. The method, which is based on the DAPCA-IV aircraft procurement cost analysis method, has been especially tailored for GA aircraft.
• Section 2.3 presents methods to help estimate the cost of operating GA aircraft. Such methods are essential when trying to demonstrate whether the new aircraft will be more or less expensive to operate than competitor aircraft.
2.1.2 A Review of the State of the GA Industry
A word of caution; the reader should apply realism to any cost analysis. The numbers returned by such methods are not exact, but rather in the ballpark at best and inaccurate at worst. It is easy to estimate how much an airplane will cost if 100, 1000, or 10,000 units are produced. However, this has no bearing on how many will actually sell. It is impossible to provide a mathematical expression to estimate that part of the equation. It is best to consult manufacturer’s data, such as Ref. [4], an annual compilation by the General Aviation Manufacturers Association (GAMA), available for download from the organization’s website [5]. The reference lists deliveries of all GA aircraft over a number of years and gives an important glimpse into the state of the industry, some of which is reflected in Figure 2-1. It further breaks down deliveries by airplane make and model. The likelihood of grabbing substantial market share from established players, who have worldwide networks of support structure such as spares and service stations, should not be overestimated.
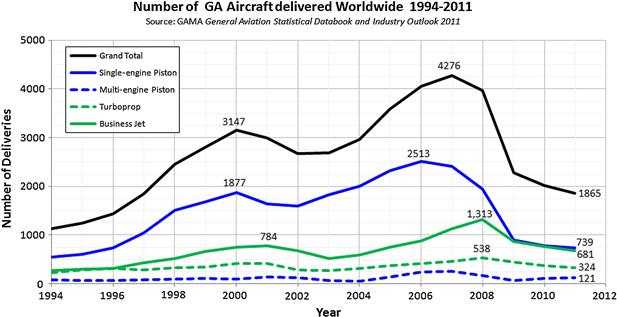
FIGURE 2-1 Sales prospects for GA aircraft from 1994 to 2011 (based on General Aviation Statistical Databook and Industry Outlook 2011).
General Aviation: Status of the Industry, Related Infrastructure, and Safety Issues (Anonymous 2001) provides a healthy dose of realism on the nature of the industry since people began tracking this information in 1946. Figure 2-2 shows that since 1946, overall, there has been an enormous drop in aircraft deliveries, albeit with periods of growth. The first drop takes place immediately after WWII, when aircraft production plummeted from about 35,000 in 1946, over a 5 year period, to 2302 in 1951. The thought at the time was that owning a private airplane would become the norm after the war, not unlike what happened to the ownership of the automobile after WWI. This view did not materialize and a large surplus of aircraft was generated that took more than 5 years to dispose of. This was followed by a period of steady growth that peaked in 1966, when 15,768 units were delivered. In 1963, the California Supreme Court made a decision that adopted the rule of “strict liability” with respect to negligence [6]. This meant that companies could (and can) be held liable for harm caused by their products even if there is no evidence of negligence.
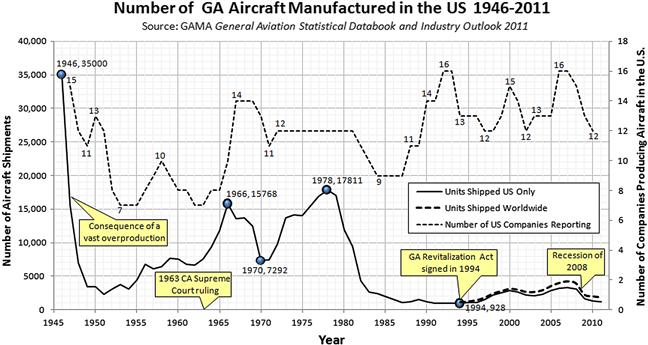
FIGURE 2-2 Number of aircraft produced in the USA has been dropping since 1946, with intermittent periods of growth (based on General Aviation Statistical Databook and Industry Outlook 2011).
Other states soon followed suit, shifting the liability burden from the customer onto the industry. This caused a sharp rise in liability suits against industry. The response of the aviation industry was to purchase protection in the form of liability insurance and add this to the price tag of new aircraft. This, in turn, increased the price of new aircraft, causing demand to fall. To cut a long story short, this explains the drop in aircraft deliveries between 1978, when production reached a high since 1946, with 17,811 deliveries; and the low of 928 units in 1994, which is the year that then-President Bill Clinton signed into law the General Aviation Revitalization Act (sometimes called the tort reform), whose purpose was to limit the extent of liabilities. This has led to a modest growth in the industry, with a subsequent drop when the economic recession of 2008 began.
The point of this discussion is to emphasize that even though financial models, like the DAPCA-IV, make reasonable predictions, the reader must be mindful that it is the economy that is unpredictable. What may seem like a viable business model today may not be so tomorrow – and vice versa.
2.2 Estimating Project Development Costs
The method presented below uses a highly modified version of the DAPCA-IV model to estimate the development cost of light GA aircraft based on expected weight of the bare airframe (without engines, tires, controls, and so on) and maximum level airspeed. Special correction factors2 are used to account for aircraft that require more complicated manufacturing technologies such as the fabrication of tapered wings, complex flap systems,3 and pressurization.
The first step in the application of the method is to estimate man-hours for three important areas of the project: engineering, tooling, and manufacturing. The next step uses these to estimate the actual cost in dollars, but also introduces additional cost-related issues that must be accounted for. Once this is completed, it is possible to estimate the price per unit, number of units to break-even, and other factors of interest.
2.2.1 Quantity Discount Factor
Since the DAPCA-IV method neither accounts for propulsive devices nor avionics, these are added (or purchased) later. The cost is adjusted using a special quantity discount factor (QDF) whose value depends on the quantity purchased and the application of a “learning curve” or, more appropriately, experience effectiveness adjustment factor.4 In short, increased experience improves the productivity of the technician. This way, 80% experience effectiveness means that if it takes a technician 100 hrs to put together, say, a batch of 10 assemblies, the next batch will only take 80% of that time, or 80 hrs, and the next batch will take 64 hrs, and so on. Effectively this means that each time the total number of units produced is doubled, the price per unit drops to 80% of the previous price. This spurs the creation of the QDF as a tool to adjust the cost of doing business. Figure 2-3 shows the QDF for four values of experience effectiveness – 80%, 85%, 90%, and 95%. The application of the QDF to the engine, propeller, and avionics is justified assuming that buying in bulk from vendors will allow prices to be negotiated. The QDF is calculated using the following expression:
![]() (2-1)
(2-1)
where
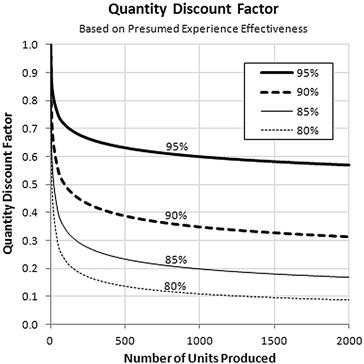
It is common to assume an FEXP of 80%, but some people with direct experience of a production environment contend this is too optimistic. Manufacturing companies often suffer from a large labor turnover rate, which adds costs through the recruitment of new replacements,5 something that inevitably is detrimental to the overall experience effectiveness. Just consider the curve for the 80% effectiveness in Figure 2-3. It implies that an engine manufacturer who sells a single engine for $300,000 will lower the price to $30,000 per engine if 1000 units are purchased – something we can safely generalize is unlikely to happen. Here, the Eastlake model uses a more realistic FEXP of 95% and this yields results that better match actual aircraft production. Also, various associated costs, hourly employee rates, fuel costs, and others, must be used and these vary from location to location.
2.2.2 Development Cost of a GA Aircraft – the Eastlake Model
This model was originally developed in 1986. However, as presented here, the costs are calculated assuming the cost of living in the year 2012. All appropriate constants (excluding exponentials) have been updated to reflect this. This means that for later (or earlier) years, the costs must be adjusted to reflect current values. This is usually done through the application of the consumer price index (CPI), known informally as the cost of living index. This means that if the reader is applying this method, say, in 2022, the CPI (denoted by the term CPI2012 in the following formulation) must be updated relative to the year 2012. This information can be obtained from the website of the Bureau of Labor Statistics.6
Product Liability Costs
An important calculation modification is the estimation of the manufacturer’s product liability costs. While it could be incorporated in some of the statistical formulas, this cost is added directly in order to, as Eastlake and Blackwell (2000) put it, “force students to think about this reality of being in business in the US.” According to information from the insurance industry, the product liability cost for any particular manufacturer depends on the number of aircraft sold and their accident rate. It is next to impossible to predict how a particular product will fare once in production. Therefore, account for this assuming 12–17% above total cost to produce (for instance see Table 2-1).
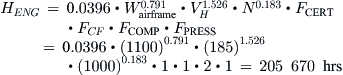
Number of Engineering Man-hours
The number of engineering man-hours required to design the aircraft and perform the necessary RDT&E can be estimated from the following expression:
![]() (2-2)
(2-2)
where
Wairframe = weight of the structural skeleton
VH = maximum level airspeed in KTAS
N = number of planned aircraft to be produced over a 5-year period
FCERT = 0.67 if certified as LSA, = 1 if certified as a 14 CFR Part 23 aircraft
FCF = 1.03 for a complex flap system, = 1 if a simple flap system
FCOMP = 1 + fcomp, a factor to account for the use of composites in the airframe
fcomp = fraction of airframe made from composites (= 1 for a complete composite aircraft)
FPRESS = 1.03 for a pressurized aircraft, = 1 if unpressurized.
Note that the structural skeleton weighs far less than the empty weight of the aircraft. This weight can be approximated by considering the empty weight less engines, avionics, seats, furnishing, control system, and other components. In the absence of such information, assume it is about 65% of empty weight.
Number of Tooling Man-hours
This is the number of man-hours required to design and build tools, fixtures, jigs, molds, and so on. Note that some recurring variables (e.g. FPRESS) have new values.
![]() (2-3)
(2-3)
where
Qm = estimated production rate in number of aircraft per month (= N/60 for 60 months/5 years)
FTAPER = 0.95 for a constant-chord wing, = 1 for a tapered wing
FCF = 1.02 for a complex flap system, = 1 if a simple flap system
FCOMP = 1 + fcomp, a factor to account for the use of composites in the airframe
FPRESS = 1.01 for a pressurized aircraft, = 1 if unpressurized
Number of Manufacturing Labor Man-hours
The number of man-hours required to build the aircraft.
![]() (2-4)
(2-4)
where FCERT = 0.75 if certified as LSA, = 1 if certified as a 14 CFR Part 23 aircraft
FCF = 1.01 for a complex flap system, = 1 if a simple flap system
FCOMP = 1 + 0.25.fcomp a factor to account for the use of composites in the airframe
EXAMPLE 2-1
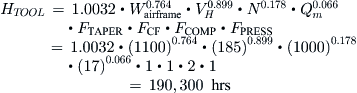
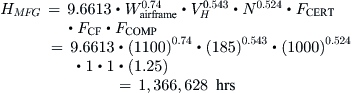
(a) Estimate the man-hours required to produce a single-engine, piston-powered composite aircraft if its airframe is expected to weigh 1100 lbf (Wairframe) and it is designed for a maximum level airspeed of 185 KTAS (VH). It is expected that 1000 aircraft (N) will be produced in the first 5 years (Qm = 1000 units/60 months ≈ 17 units per month). The un-pressurized aircraft will be certified under 14 CFR Part 23 and will feature a tapered wing with a simple flap system.
(b) If it is assumed that the engineering staff will work 40 hrs a week for 48 weeks a year, how many engineers are required to accomplish the development over a period of 3 years?
(c) What is the average time it will take to manufacture a single unit?
(d) Determine and compare the corresponding values if the airplane is made from aluminum (i.e. only change the factor FCOMP).
Solution
Refer to the descriptions of equations for variables.
(a) Number of engineering man-hours required:
Number of man-hours for constructing tooling:
Number of man-hours required to produce airplane:
(b) Number of engineers needed to develop the aircraft over a period of 3 years:
![]()
(c) Average time to manufacture a single unit:
![]()
(d) Performing the same calculations for the production of aluminum aircraft and comparing to the composite aircraft yielded the following results:

The results from parts (b) and (c) in Example 2-1 above need further explanation. The number of engineers indicates the average over the development period. Most projects have few engineers at first and then, as the project moves into the preliminary design phase, additional engineers are hired. There might be six engineers working on the project at first and 60 toward the end.
The average number of hours to build each unit appears reasonable considering a fully optimized manufacturing process for a small airplane, but it takes a long time to polish the process to get it to that level. The reader should be careful in trusting such numbers as they may mislead. It may take 5000–6000 hrs/aircraft to assemble the first few aircraft. Some businesses do not possess the financial capacity to pass through that hurdle.
Cost Analysis
Once the number of hours has been determined, the next step is to estimate costs by multiplying these with rates in currency per hour. This is precisely what is done below, although some of the other equations determine costs based on the weight and speed, as done above. In 2012, a typical rate for engineering was $92 per hour, tooling labor was $61 per hour, and manufacturing labor was $53 per hour. It should be stated that these figures include overheads – according to www.engineersalary.com, an engineer with a B.Sc. and M.Sc. and 10 years of experience on the West Coast of the United States should be making about $100,000 a year. This amounts to about $48 an hour. A technician in a typical aircraft plant could make anywhere from $12 to $20 an hour.
Total Cost of Engineering
Total cost of engineering the aircraft:
![]() (2-5)
(2-5)
where
By definition, CPI2012 for the year 2012 relative to the same year is 1. The constant 2.0969 is the CPI for the years 1986 to 2012, which is when the CER models were developed. The following equations have been corrected as well.
Total Cost of Development Support
The cost of overheads, administration, logistics, human resources, facilities maintenance personnel and similar entities required to support the development effort; calculate and pay salaries; and other necessary tasks.
![]() (2-6)
(2-6)
where
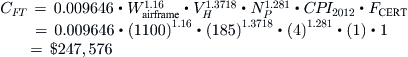
Total Cost of Flight Test Operations
Total cost of completing the development and certification flight-test program:
![]() (2-7)
(2-7)
where
Total Cost of Tooling
This entails the cost of designing, fabricating, and maintaining jigs, fixtures, molds, and other tools required to build the airplane. The tooling requires industrial and manufacturing engineers for the design work and technicians to fabricate and maintain.
![]() (2-8)
(2-8)
where
Total Cost of Manufacturing
This entails the cost of manufacturing labor required to produce the aircraft.
![]() (2-9)
(2-9)
where
Total Cost of Quality Control
This entails the cost of technicians and the equipment required to demonstrate that the product being manufactured is indeed the airplane shown in the drawing package.
![]() (2-10)
(2-10)
where
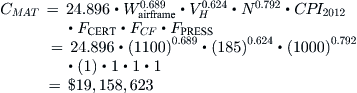
Total Cost of Materials
This is the cost of raw material (aluminum sheets, pre-impregnated composites, landing gear, avionics, etc.) required to fabricate the airplane.
![]() (2-11)
(2-11)
where
Total Cost to Certify
The total cost to certify is the cost of engineering, development support, flight test, and tooling (assuming production tooling is used to produce at least some of the prototypes).
![]() (2-12)
(2-12)
EXAMPLE 2-2
Estimate the total cost to certify the airplane of Example 2-1, assuming engineering, tooling, and manufacturing rates are $90, $60, and $50 per hour, respectively. The planned number of prototypes is four. In the year 2012, the CPI2012 = 1.
Solution
Total cost of engineering:
![]()
Total cost of development support:
![]()
Total cost of flight test operations:
Total cost of tooling:
![]()
Total cost of manufacturing:
![]()
Total cost of quality control:
![]()
Total cost of materials:
The total cost to certify:
![]()
With the total costs determined, additional costs of various components and items can be estimated as follows:
Cost of Retractable Landing Gear per Airplane
The cost of retractable landing gear is already assumed in the DAPCA-IV formulation, so an adjustment is only made if the airplane has fixed landing gear. If so, subtract $7500 per airplane.
Cost of Avionics
In the absence of more accurate information, in 2012 US dollars add $15,000 per airplane if it is certified to 14 CFR Part 23. Add $4500 per airplane if it is certified as an LSA.
Cost of Power Plant (engines, propellers)
The cost of the engine depends on the number of (NPP) and type of engine (piston, turboprop, turbojet, or turbofan). For piston and turboprop engines the cost depends on the rated brake-horsepower (PBHP) or shaft-horsepower (PSHP). For turbojets and turbofans it is based on the rated thrust (T).
Since piston and turboprop engines also require propellers, this cost must be determined as well. The two most common types are the fixed-pitch and the constant-speed propellers. The typical fixed-pitch propeller cost around $3145 in 2012. However, constant-speed propellers are more expensive and an expression that takes into account the diameter of the propeller (DP, in feet) and PSHP has been derived.
EXAMPLE 2-3
(a) Estimate the cost of the engine and propeller for the airplane of Example 2-1, if its single piston engine is 310 BHP, swings a 6.5 ft constant-speed propeller, and the average cost per avionics suite is $15,000. CPI2012 = 1.
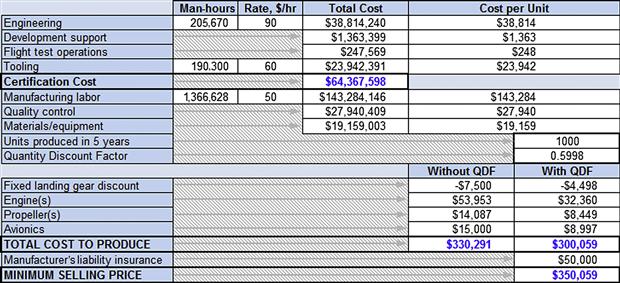
(b) Using the information from this and Example 2-1 and Example 2-2, tabulate the cost to produce 1000 units of the airplane over a 5-year period, and estimate the necessary manufacturer’s selling price. Assume no profits and include a manufacturer’s liability insurance of $50,000 per airplane. This value represents the minimum selling price.
(c) Plot how the number of units produced affects the minimum selling price.
(d) Perform the preceding analysis for an aluminum aircraft and compare to the composite airplane, by only changing the factor FCOMP.
Solution
![]()
![]()
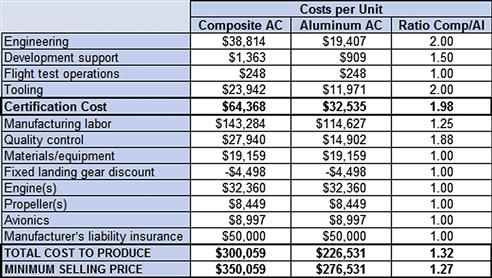
(b) The entire cost estimation is tabulated in Table 2-1, indicating a minimum selling price of $350,059. Note that there may be slight numerical discrepancies between the table and the above calculations, but this can be attributed to their implementation in a spreadsheet, which retains 16 significant digits.
In short, in order to pay the development and manufacturing costs at this price, 1000 airplanes must be sold (remember this was the premise – 1000 units over 5 years). The price shown does not generate any profits and, it probably does not have to be said, would hardly keep the company in business for long. Next, we will assume profit margins and evaluate how this affects the bottom line.
This evaluation is based on airplanes like the Cirrus SR22 and Cessna 350 Corvalis. According to information from www.cirrusaircraft.com, in 2012 the base price for a brand new Cirrus SR22, featuring its famed Cirrus Airframe Parachute System, seatbelts with airbags, three-bladed propeller, and air conditioning is $449,900. The Cessna 350 is no longer produced, so its price is not known. However, for comparison reasons, its more powerful brother, the Cessna 400 TTX, costs about $733,950 [7], while a comparable Cirrus SR22T costs about $633,600 [8]. Both airplanes have turbo-normalized engines and other features that increase the price.
(c) The graph shown in Figure 2-4 was created by evaluating the minimum selling price considering a number of production scenarios with differing numbers of units produced. It shows how the price drops rapidly with the number of units produced and then becomes more horizontal with higher production rates.
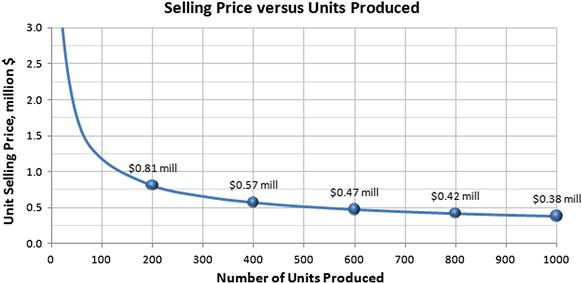
FIGURE 2-4 The selling price in millions of $ as a function of units produced shows a rapid drop in price at first.
(d) A comparison of the cost of development and manufacturing between a composite and aluminum aircraft is shown in Table 2-2. It reveals that the DAPCA-IV type statistical analyses predict composite aircraft to be of the order of 25–30% more expensive to manufacture than a comparable aluminum aircraft.
Break-even Analysis
Break-even analysis is used to determine how many units must be produced before revenue equals the cost incurred. Using the standard cost-volume-profit-analysis the following expression is used to determine this:
In this context the certification cost can be considered the total fixed cost, while the sum of manufacturing labor, quality control, materials/equipment, landing gear, engines, propellers, avionics, and manufacturer’s liability insurance, divided by the number of units produced, constitutes unit variable cost. Example 2-4 shows the application of this approach.
Derivation of Equation (2-19)
The total cost of developing N units is given by:
![]()
The total revenue from selling N units is:
![]()
When the two are equal, we have broken even, i.e.,
![]()
If we designate the number of units to break-even by the variable NBE, we can write:
![]()
QED
EXAMPLE 2-4
Estimate how many airplanes must be produced before the manufacturer can expect to break-even, if the price is set at $400,000. Plot the production cost and revenue versus number of units produced, assuming a retail price of $350,000, $400,000, and $450,000 (see Figure 2-5). Plot total production cost and revenue versus number of units produced. Indicate break-even points on the plot.

Solution
Total fixed costs:
![]()
Unit variable cost is obtained by adding the cost for one unit for:
![]()
Break-even point:
![]()
2.2.3 Development Cost of a Business Aircraft – the Eastlake Model
As stated before, the Eastlake model has also been adapted to the development of a business or an executive aircraft. This model is much closer to the DAPCA-IV model. Only applicable equations will be presented – the calculations are effectively identical to those for GA aircraft. Since such business aircraft would always be certified under either 14 CFR Part 23 or Part 25, provisions are made to account for this. Certification under the latter category will be more expensive due to the difference in the regulations. The factors denoted by the common variable FCERT are best guesses for the cost difference – the reader can modify those values as suitable by corresponding experience.
Number of Engineering Man-hours
The number of man-hours of engineering time required to design the aircraft and perform the necessary RDT&E can be estimated from the following expression:
![]() (2-20)
(2-20)
where
Wairframe = weight of the structural skeleton
VH = maximum level airspeed in KTAS
N = number of planned aircraft to be produced over a 5 year period
FCERT = 1 if certified as a 14 CFR Part 23, = 1.15 if certified as a 14 CFR Part 25
FCF = 1.03 for a complex flap system, = 1 if a simple flap system
FCOMP = 1 + fcomp, a factor to account for the use of composites in the airframe
fcomp = fraction of airframe made from composites (= 1 for a complete composite aircraft)
FPRESS = 1.03 for a pressurized aircraft, = 1 if unpressurized
Number of Tooling Man-hours
The number of man-hours required to design and build tools, fixtures, jigs, molds, and so on.
![]() (2-21)
(2-21)
where
Qm = estimated production rate in number of aircraft per month (= N/60 for 60 weeks/5 years)
FCERT = 1 if certified as a 14 CFR Part 23, = 1.05 if certified as a 14 CFR Part 25
FTAPER = 0.95 for a constant-chord wing, = 1 for a tapered wing
FCF = 1.02 for a complex flap system, = 1 if a simple flap system
FCOMP = 1 + fcomp, a factor to account for the use of composites in the airframe
FPRESS = 1.01 for a pressurized aircraft, = 1 if unpressurized
Number of Manufacturing Labor Man-hours
The number of man-hours required to build the aircraft.
![]() (2-22)
(2-22)
where
Total Cost of Engineering
Use Equation (2-5).
Total Cost of Flight Test Operations
Total cost of completing the development and certification flight-test program:
![]() (2-24)
(2-24)
where
Total Cost of Tooling
Use Equation (2-8).
Total Cost of Manufacturing
Use Equation (2-9).
Total Cost to Certify
Use Equation (2-12).
Cost of Retractable Landing Gear per Airplane
The cost of retractable landing gear is already assumed in the DAPCA-IV formulation, so an adjustment is only made if the airplane has fixed landing gear. If so, subtract $7500 per airplane.
Cost of Avionics
In the absence of more accurate information, in 2012 US dollars add $60,000 per airplane if it is certified to 14 CFR Part 23. Add $100,000 per airplane if it is certified to 14 CFR Part 25. This is in part to account for the installation of passenger entertainment systems.
2.3 Estimating Aircraft Operational Costs
A part of manufacturing and selling airplanes is to persuade potential customers to purchase your airplane rather than someone else’s. In order to bring forth a convincing argument the manufacturer runs a sales department whose purpose is to provide a true comparison of the cost of ownership between comparable aircraft. One of the most important figures of merit used for this is the cost of ownership; the amount of money required to own and operate the aircraft per hour flown. This section focuses on the operation of a GA aircraft, estimating operational cost per flight hour for a privately owned and flown GA aircraft.
The following model was generated from scratch and is based on actual experience of aircraft ownership. It comprises basic book-keeping and tracking of several years of costs associated with privately owned aircraft. The primary inputs are flight hours per year, cost of fuel, amount of money borrowed to purchase the aircraft (to include loan payments in the model), and the amount of insurance coverage. The model assumes 0.3 maintenance man-hours required per flight hour (denoted by the term FMF) for a single-engine, fixed-gear, fixed-pitch prop aircraft. This number is adjusted for characteristics that affect the maintenance effort. It is increased to account for factors such as difficult engine access, retractable landing gear, wet wings, complex avionics equipment, and complex high-lift devices. Negative increments are given for the cost savings achievable from maintenance performed by the owner to the extent of what is allowed by FAA regulations and for the simpler craft intended to be certified as LSA.
2.3.1 Operational Cost of a GA Aircraft
As stated above, it is assumed that the owner is the pilot and, thus, does not incur any costs for a flight crew. Storage cost, annual inspections, and contributing to an engine overhaul bank are also included in the model. The cost is ultimately presented in dollars per flight hour, allowing convenient comparison with rental cost for a similar aircraft. The number of flight hours per year (QFLGT) for normal GA aircraft varies greatly, from around 100 hours a year for an underutilized aircraft, to 1000 hours7 or more for a student trainer aircraft. Personal aircraft are flown in the ballpark of 100–500 hours per year, with 300 hours being a reasonable average.
Maintenance to Flight Hour Ratio
![]() (2-28)
(2-28)
where
F1 = −0.15 if maintenance is performed by owner and 0 if performed by an A&P mechanic
F2 = 0 for an easy engine access, = 0.02 for a difficult access
F3 = 0 for a fixed landing gear, = 0.02 for a retractable landing gear
F4 = 0 if no VFR radios are installed, = 0.02 if VFR radios are installed
F5 = 0 if no IFR radios are installed, = 0.04 if IFR radios are installed
F6 = 0 if no integral fuel tanks are installed, = 0.01 if such tanks are installed
F7 = 0 for a simple flap system, = 0.02 for a complex flap system
F8 = 0 for 14 CFR Part 23 certification, = −0.10 for LSA certification
Airplane owners usually have to pay for storage at a main base. Assume the rate per month is $250.
Annual Fuel Cost ($ per year)
![]() (2-30)
(2-30)
where
BHPCRUISE = Typical horsepower during cruise
SFCCRUISE = typical specific fuel consumption during cruise
The insurance cost is a nebulous value that is disclosed by insurance companies on an individual basis. It takes into account factors such as pilot experience; use of aircraft; price and type of aircraft; and so on. Low-time pilots generally have to pay a higher premium than their high-time contemporaries. Agricultural aircraft engage in high-risk operations and this increases the premium as well. For instance, in the year 2012, the premium for a Cessna 172 might have been around $1000–1500 a year. Included in the policy is a hull value of $50,000 with standard liability of $100,000 per passenger and maximum liability of $1,000,000. On the other hand, a modern Cirrus SR22 aircraft, valued closer to $600,000, owned and operated by a low-time pilot, might cost $20,000 a year to insure. At the same time, a high-time pilot owning a less expensive Cirrus might only have to pay $3000 annually. The operational cost model being presented does not account for these variations and it is up to the reader to obtain the appropriate figure. Here, a simple model is employed that gives a reasonable estimate for many instances, but may not be applicable to others.
Annual insurance cost ($ per year)
![]() (2-31)
(2-31)
where
If estimating the operational cost of a new design, the CAC amounts to the purchase price of the aircraft.
Annual Inspection Cost ($ per year)
The airplane’s engine(s) will require regular overhaul, as stipulated by the engine’s required time between overhaul (TBO). It is prudent to assume this maintenance requirement is amortized over the total flight hours of the airplane. One way of doing this is to obtain an estimate for the cost of this major maintenance event and divide by the TBO of the engine. For instance, Lycoming and Continental engines usually have a TBO of around 2000 hrs. If the cost of the overhaul is expected to be $10,000, it follows that it is reasonable to charge $5 per flight hour. This is reflected in the expression below:
Engine Overhaul Fund ($ per year)
![]() (2-33)
(2-33)
where
If the airplane was fully or partially funded through financial institutions, the annual cost of paying back those loans should be included as well. This is accounted for as shown below, using the standard mortgage formula:
Cost per Flight Hour
EXAMPLE 2-5
Estimate the operational for the airplane in Example 2-1, assuming the following scenario:
(1) The airplane is certified to 14 CFR Part 23.
(2) It is maintained by an A&P mechanic who charges $60 per hour.
(3) It has easy engine access, fixed landing gear, IFR radios only, integral fuel tanks, and a simple flap system.
(4) It is flown 300 hours per year. Its 310 BHP engine consumes 16 gal/hr of fuel on average at $5/gallon.
(5) Storage cost is $250 per year.
(6) Use the given insurance model and the price of the airplane in Example 2-3, or $350,059.
(7) The airplane is fully paid for with a 15-year loan that has an APR of 9%.
Solution
Start by estimating the maintenance to flight hour ratio:
![]()
![]()
![]()
![]()
![]()
![]()
![]()
![]()
The monthly payment is $3855. Therefore, the total annual cost of owning and operating the airplane amounts to the sum of these, or:
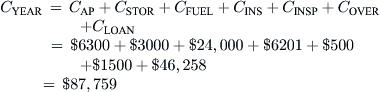
If operated 300 hours a year, the cost per flight hour is:
![]()
In comparison, a cost of $235.60 per flight hour for the $734,000 Cessna 400 TTX Corvalis is cited (http://se.cessna.com/single-engine/cessna-400/cessna-400-pricing.html#). It does not appear to include the cost of financing.
2.3.2 Operational Cost of a Business Aircraft
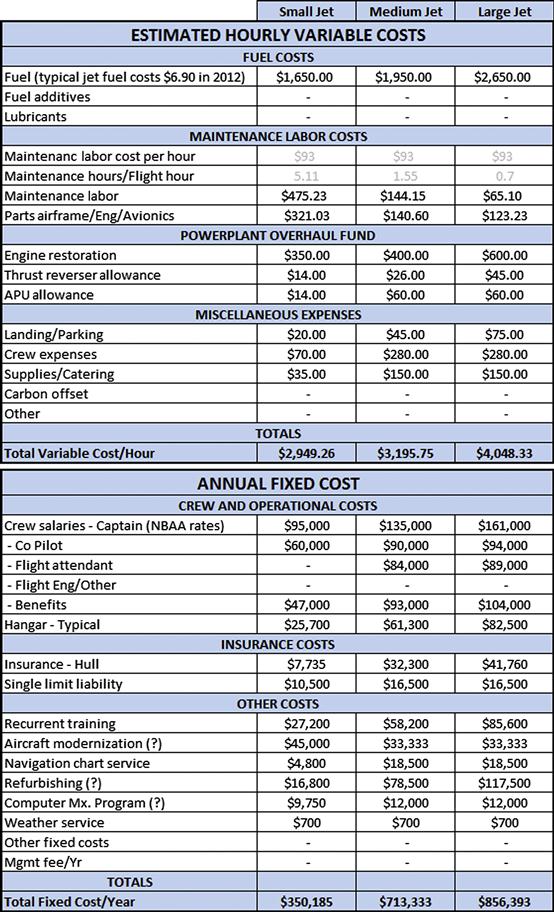
This estimation assumes a professionally flown aircraft with high quality maintenance and the other costs that have already been detailed in Section 2.3.1, Operational cost of a GA aircraft. This presentation is intended to give an idea of the costs associated with GA business aircraft. For business jets, certified to 14 CFR Part 25, the reader can seek more precise information from companies such as Conklin and de Decker [9], which collects it in great detail for all aircraft currently in service. A listing of cost-related items for such aircraft is provided in Table 2-3 and is based on the Conklin and de Decker approach.
The number of flight hours per year (QFLGT) for normal business aircraft varies greatly, from around 100 hours a year for an underutilized aircraft, to 1000 hours or more for a student trainer aircraft.
Maintenance to Flight Hour Ratio
![]() (2-39)
(2-39)
where
F1 = 0 for an easy engine access, = 0.2 for difficult access
F2 = 0 for fixed landing gear, = 0.2 for retractable landing gear
F3 = 0 if simple avionics are installed, = 0.2 if complex avionics are installed
F4 = 0 if no integral fuel tanks are installed, = 0.1 if such tanks are installed
F5 = 0 for a simple flap system, = 0.2 for a complex flap system
F6 = 0 for 14 CFR Part 23 certification, = 0.5 for 14 CFR Part 25 certification
Storage Cost ($ per year)
Use Equation (2-29), but assume RSTOR = storage rate ≈ $250–$1500 per month, depending on size of hangar space needed.
Annual Fuel Cost ($ per year)
Use Equation (2-30).
Annual Insurance Cost ($ per year)
Use Equation (2-31) in the absence of better information.
Annual Insurance Cost ($ per year)
The airplane’s engine(s) will require regular overhaul, as stipulated by the engine’s required time between overhaul (TBO). It is prudent to assume this maintenance requirement is amortized over the total flight hours of the airplane. One way of doing this is to obtain an estimate for the cost of this major maintenance event and divide by the TBO of the engine. For instance, Williams International FJ44 engines usually have TBO around 4000 hrs, Pratt & Whitney PW306 are around 6000 hrs. If the cost of the overhaul is expected to be $30,000–40,000, it follows that it is reasonable to charge $6.7 to $7.5 per flight hour per engine. The higher value is reflected in the expression below:
Crew Cost
Some business aircraft are operated by flight hours only. The associated crew cost is then based on the number of hours flown annually. In the absence of better information the following expression can be used to estimate this cost:
Hourly Crew
![]() (2-42)
(2-42)
where
The term RCREW ultimately depends on the business involved and can range from $50 to $150 per hour. Other business aircraft have full-time pilots and even a flight attendant, with the associated annual salary and benefit costs (see Table 2-3). Yet other businesses may keep only one full-time pilot on board, and hire a co-pilot and a flight attendant on a need-to basis. In this case Equation (2-42) may be used to account for the additional crew and its value added to that of the full-time pilot.
Total Yearly Cost
Follow the same procedures as presented in Section 2.3.1, Operational cost of a GA aircraft.
Exercises
(1) An LSA aircraft is being designed by a startup business and you have been hired to evaluate the business case. It is planned that the lifting surfaces of the new aircraft will be composite, but the fuselage will be made from aluminum. This way, it is estimated that 50% of the aircraft will be composite and 50% aluminum. The estimated airframe weight is 530 lbf and the maximum level airspeed is 120 KTAS (VH). It is estimated that 250 airplanes will be manufactured over a 5-year period. The airplane features a tapered wing with a simple flap system and, as required for LSA aircraft, the fuselage is unpressurized and it has a 69 inch diameter fixed-pitch propeller driven by a piston engine. With this in mind, estimate the following:
(a) Number of man-hours of engineering time.
(b) Number of man-hours for construction tooling.
(c) Number of man-hours to produce 250 airplanes.
(d) Estimate manpower required for each of the above, assuming 40 hrs a week for 48 weeks a year and production run over 5 years (as stated above). In other words, how many engineers, tooling, and technicians will be required over the period of time?
(e) Estimate the average number of hours required to produce each airframe.
(2) Using the airplane from Exercise (1), estimate the total cost to certify and manufacture 250 units over the 5-year period assuming 95% experience effectiveness, engineering, tooling, and manufacturing rates are $95, $65, and $55 per hour, respectively. Assume 15% product liability cost. The planned number of prototypes is two. Use the consumer price index for the year 2012 (i.e. CPI2012 = 1). Solve the problem using spreadsheet software and prepare an estimate similar to that in Table 2-1 and validate using standard hand calculations. Determine:
(b) Total cost per unit to produce.
(c) Break-even analysis for retail prices at $15,000, $30,000, and $45,000 above total cost per unit, assuming the sales agent is paid $7000 for each airplane sold (i.e. add $7000 to the three retail prices).
(d) Determine the price of three LSA aircraft by researching manufacturers, websites (for instance go to: http://www.lightsportaircrafthq.com/ for a listing of manufacturers).
(3) Estimate the hourly operational cost for the airplane in Exercise (1) for the three retail price options from Exercise (2), assuming it is maintained by an A&P mechanic who charges $50 per hour. It has easy engine access, fixed landing gear, IFR radios only, integral fuel tanks, and a simple flap system. It is flown 150 hours per year. Its 100 BHP engine consumes 6 gal/hr of fuel on average, at $5/gallon. Storage cost is $50 per month. The engine time between overhaul (TBO) is 1500 hours and the cost to overhaul is $4500. Include the acquisition cost for the airplane by assuming it is purchased using a 20% down-payment with the remainder borrowed at 9% APR for 15 years. Note that CAC is the sum of the total cost per unit, the markup, and the sales commission, i.e. the total paid by the customer as a fly-away price.
(a) The total cost of developing a brand new airplane can be expressed as the sum of the fixed cost (constant), denoted by FC, and the variable cost, which can be expressed as U.N, where U is the unit variable cost and N is the number of units produced. Consider a scenario in which the retail price of the product is variable rather than constant in order to help initially market the airplane. As an example of such a variable retail price structure, consider a situation where the unit sales price (call it P1) is low at first to help market the airplane, but is then raised to P2 after a specific number of units, N1, have been produced. Derive an expression for the break-even point, i.e. the total number of units, N, required to break-even.
(b) Calculate the number of units that must be produced to break-even for a scenario in which FC = $50 million, U = $0.285 million/unit, P1 = $0.350 million, P2 = $0.450 million, and N1 = 300. How many units does it take if the price is not increased and it is offered a P1?
Variables
| Symbol | Description | Units (UK and SI) |
| AR | Wing aspect ratio | |
| BHP/W | Brake horse power-to-weight ratio | BHP/lbf or BHP/N |
| CAC | Insured valued of aircraft | $ |
| CAP | Yearly maintenance cost | $/yr |
| CCERT | Total cost for certification | $ |
| CCREW | Crew cost | $/hr |
| CCSTPROP | Cost of constant-speed propellers | $ |
| CDEV | Total development support cost | $ |
| CDmin | Coefficient of minimum drag | |
| CENG | Total cost of engineer | $ |
| CFIXPROP | Cost of fixed-pitch propellers | $ |
| CFT | Total cost for flight test operations | $ |
| CFUEL | Annual fuel cost | $/yr |
| CG | Center of gravity | ft, m, or %MAC |
| CHR | Cost per flight hour | $/hr |
| CINS | Annual cost for insurance | $/yr |
| CINSP | Annual inspection cost | $/yr |
| CLmax | Maximum lift coefficient | |
| CLOAN | Monthly loan payment | $/yr |
| CLα | Aircraft lift curve slope | deg or radians |
| CMAT | Total material cost | $ |
| CMFG | Total manufacturing cost | $ |
| COVER | Engine overhaul fund | $/yr |
| CPI2012 | Consumer price index relative to the year 2012 | |
| CPP | Cost of engine | $ |
| CQC | Total cost of quality control | $ |
| CSTOR | Cost for storage | $ |
| CTOOL | Total tooling cost | $ |
| CYEAR | Yearly operational cost | $/yr |
| DP | Propeller diameter | ft or m |
| FCERT | Certification factor | |
| FCF | Complex flap system factor | |
| FCOMP | A factor to account for the use of composites in the airframe | |
| fcomp | Fraction of airframe made from composites | |
| FEXP | Experience effectiveness adjustment factor | |
| FFCRUISE | Total fuel flow | gal/hr |
| FMF | Required maintenance man-hours for every flight hour | |
| FPRESS | Pressurization factor | |
| FTAPER | Chord taper factor | |
| HENG | Number of engineering man-hours | hrs |
| HMFG | Number of manufacturing labor hours | hrs |
| HTOOL | Number of tooling man-hours | hrs |
| k | Coefficient for lift-induced drag | |
| KCAS | Knots calibrated airspeed | ft/s or m/s |
| KIAS | Knots indicated airspeed | ft/s or m/s |
| LE Sweep | Wing leading edge sweep | deg or radians |
| MAC | Mean aerodynamic chord | ft or m |
| n | Load factor | |
| N | Number of units produced (context-dependent) | |
| N | Number of planned aircraft to be produced (context-dependent) | |
| NBE | Number of sold units to break-even | |
| NCREW | Number of crew members to operate aircraft | |
| NENG | Number of engineers | |
| NP | Number of prototypes | |
| NPP | Number of engines | |
| PBHP | Rated brake horsepower | ft·lbf/s or N·m/s |
| PSHP | Rated shaft power | ft·lbf/s or N·m/s |
| QDF | Quality discount factor | |
| QFLGT | Flight hours per year | hrs/yr |
| Qm | Aircraft production rate | number of aircraft/month |
| RAP | Rate for certified Airframe and Power plant mechanic | $/hr |
| RCREW | Rate for crew | $/hr |
| Re | Reynolds number | |
| RENG | Rate of engineering labor | $/hr |
| RFUEL | Cost of fuel | $/gal |
| RMFG | Rate of manufacturing labor | $/hr |
| RSTOR | Rate for storage | $/yr |
| RTOOL | Rate of tooling labor | $/hr |
| SFCCRUISE | Specific fuel consumption at cruise condition | lbf/hr/BHP |
| T | Rated thrust | lbf |
| t/c | Thickness-to-chord ratio | |
| T/W | Thrust-to-weight ratio | |
| tAC | Average to to manufacture a single unit | hrs |
| TR | Wing taper ratio | |
| VH | Maximum level airspeed in KTAS | ft/s |
| VHT | Horizontal tail volume coefficient | |
| VvT | Vertical tail volume coefficient | |
| W | Weight | lbf or N |
| W/S | Wing loading | lbf/ft2 or N/m2 |
| Wairframe | Weight of structural skeleton | lbf |
References
1. Hess RW, Romanoff HP. Aircraft Airframe Cost Estimating Relationships. R-3255-AF, RAND Corporation December 1987.
2. In: http://www.rand.org.
3. Eastlake CN, Blackwell HW. Cost Estimating Software for General Aviation Aircraft Design. St. Louis, MO: Proceedings of the ASEE National Conference; 2000.
4. Anonymous. General Aviation Statistical Databook and Industry Outlook 2011. General Aviation Manufacturers Association 2012.
5. In: http://www.gama.aero.
6. Anonymous. General Aviation: Status of the Industry, Related Infrastructure, and Safety Issues. Report to Congressional Requesters, GAO-01-916, U.S. General Accounting Office August 2001; p. 18.
7. In: http://se.cessna.com/single-engine/cessna-400/cessna-400-pricing.html#; June 2012; June 2012.
8. In: http://cirrusaircraft.com/media/pricesheets/sr22t.pdf; June 2012; June 2012.
9. In: http://www.conklindd.com.
1The DAPCA-IV is preceded by the now obsolete DAPCA-III (R-1854-PR from 1976) and so on.
2Ok, fudge factors.
3A complex flap system is somewhat subject to engineering judgment. In this context fixed hinge flaps are considered simple, whereas translating hinges are complex. An exception to this distinction would be the flap system on the typical Cessna aircraft, which is considered simple (albeit clever).
4Comment: it is recognized that many people simply call it learning curve and the author takes no issue with that, other than considering the term “experience effectiveness” more appropriate because once a person has “learned” to insert and tighten a fastener, there really is not much else to be “learned.” It is the experience, on the other hand, that allows the person to perform the task faster and faster.
5Recruiting requires interviewing time, associated administrative work, training, supervisory time, and overtime that is paid to employees who temporarily have to take on additional tasks until a new replacement is found.
6http://www.bls.gov. In particular, see http://www.bls.gov/data/inflation_calculator.htm, which is a calculator that returns the index using simple user inputs. Also, explanations on how the CPI is calculated can be seen at http://www.bls.gov/cpi/cpifaq.htm#Question_11.
7A primary trainer airplane flown on average 4 hours, five days a week, flies 4 × 5 × 52 = 1040 hrs per year.