
Selecting the Power Plant
Abstract
A thorough review of number of common and practical powerplant options for modern GA aircraft is presented in the chapter. Starting with a review of the fundamental theories of power plant and power generation, the chapter provides thorough design information about piston engines, turboprops, turbojets, turbofans, and electric motors. Methods to estimate power and thrust as a function of atmospheric conditions and airspeed are provided for all the options. The chapter presents the Gagg-Ferrar model for altitude dependency of piston engines and the method of Mattingly for the operation of turbo machinery. The fundamentals of fuel-cells are provided for electric motors. Then, the chapter discusses topics that affect the installation of engines. Topics ranging from piston engine cooling topics to fire-proofing to inlet sizing are presented. Finally, the chapter presents specialized topics related engines. The topics range from how to account for gearboxes to the extraction of power information from typical engine performance charts and the use of the so-called Petty Equation for the prediction of the same.
Keywords
Piston; turboprop; turbofan; turbojet; electric; fuel-cell; work; power; torque; thermodynamics; BHP; SHP; thrust; fuel; SFC; Gagg-Ferrar; Mattingly; turbocharger; turbo-normalizing; fire-proofing; installation; cooling; inlet; exit; performance chart; Petty-equation
Outline
7.1.1 The Content of this Chapter
7.1.2 Power Plant Options for Aviation
7.1.3 The Basics of Energy, Work, and Power
7.1.4 Thermodynamics of the Power Plant
7.1.5 General Theory of Thrust Generation
Engine Torque and Turboprop Engines
Engine Power and Thrust Ratings
Density of Aviation Gasoline (Avgas)
Energy Content of Fuel for Piston Engines
Fuel Octane Rating and Fuel Grades for Piston Engines
Specific Fuel Consumption (SFC)
7.2 The Properties of Selected Engine Types
Two-stroke versus Four-stroke Engines
Operation of the Four-stroke Engine
Compression and Pressure Ratios
Typical Specific Fuel Consumption for Piston Engines
Effect of Airspeed on Engine Power
Effect of Altitude on Engine Power
Effect of Temperature on Engine Power
Effect of Manifold Pressure and RPM on Engine Power
Step-by-step: Effect of Altitude and Airspeed on Turboprop Engine Thrust
Step-by-step: Effect of Altitude and Airspeed on Turbojet Engine Thrust
Step-by-step: Effect of Altitude and Airspeed on Turbofan Engine Thrust
7.2.6 Computer code: Thrust as a Function of Altitude and Mach Number
7.3 Aircraft Power Plant Installation
Danger Zones Around Propeller Aircraft
7.3.1 Piston Engine Installation
7.3.2 Piston Engine Inlet and Exit Sizing
Method 1: Inlet-exit-dependent Heat Transfer
Method 2: Inlet-radiator-exit Method
7.3.3 Installation of Gas Turbines
Installation of Turboprop Engines
Turbo Machinery and Rotor-burst
Step 1: Required Mass Flow Rate
Step 2: Determine Airspeed Limitations at the Inlet Lip and Compressor
Step 3: Establish Known and Unknown Flow Conditions
Step 4: Determine Conditions at Station ![]()
Step 5: Determine Conditions at Station ![]()
7.4.2 Step-by-step: Extracting Piston Power from Engine Performance Charts
7.4.3 Extracting Piston Power Using the Petty Equation
Determination of the Polynomials Describing PBHP max and PFHP
7.1 Introduction
Clearly, the power plant is what makes powered flight possible through the generation of a force used to produce forward velocity, which then is used to create wing lift. As such, the engine selection is fundamental to the success of the design. Sometimes airplanes are designed around a particular engine, although often the engine is selected once performance requirements are realized. There is a range of power plant options available for the modern aircraft: piston engines, gas turbines, jet engines (turbojets and turbofans), to name a few.
Piston engines, gas turbines, and jet engines are the most commonly used in aircraft, while the pulsejet and rocket motors are rarely used. The most famous use of a pulsejet is in the German V1 drone used during the Second World War. While rocket engines offer high thrust in small packages, they have seen very limited use in just a few experimental aircraft, but are mostly used to improve T-O performance in military transport by supplementing the normal source of thrust. An example of this is the use of the RATO1 packs for military transport aircraft such as the Lockheed C-130 Hercules.
Both the pulsejet and rocket types suffer from abysmal thermal efficiency, in particular the latter. Electric motors, on the other hand, represent the most efficient source of power currently available. At this time, there is an ongoing surge in their use in light experimental aircraft. Unfortunately, an efficient source of power does not translate into a “lot of” power, only that the conversion of electric to mechanical energy is very efficient (∼95%). Currently, the greatest drawback of electric power is a lack of power due to a low “energy-per-mass” ratio. Nevertheless, battery technology is rapidly developing, making such engines more and more attractive.
At the present, batteries for electric engines have a low endurance, perhaps some 40–60 minutes, although strides toward improvements are rapidly being made. Fuel cell technology is advancing at a swift pace and this offers a potential for vastly greater endurance for such aircraft. In 2011, in a competition organized by NASA and the CAFE Foundation (Comparative Aircraft Flight Efficiency), the Pipistrel G4, a four-seat, twin-fuselage electric sailplane, made history by flying nearly 196 miles non-stop, in 1 hour 49 minutes [1]. This translates to an airspeed a tad over 107 mph (93 KTAS). Some of the technology demonstrators that participated ran on electric power for almost two hours!
The aircraft designer must keep a number of properties in mind when selecting a power plant: for instance, power output; type; cost, and availability of fuel; fuel efficiency; weight; mechanical complexity; price; maintainability; cooling requirements; inlet and exhaust requirements; and many others. For instance, jet engines require high fuel flow at low altitude, and, therefore, are very inefficient and costly to operate near sea level. However, as the altitude is increased, the maintenance of a constant fuel-to-air ratio guarantees a drop in fuel consumption (albeit at the cost of thrust). For this reason, jet engines become very attractive for high airspeeds at high altitudes. Consequently, if these aircraft transport people, which most of them do, the cabin must be pressurized, but this has a major impact on the structure and systems required. In short, engine selection has a major impact on the overall design of the aircraft.
In this section, we will present a formulation applicable to these engines that helps the designer select rather than design engines. Engine design is a field of specialization and will not be discussed in great detail here. On the other hand, a formulation will be presented that helps select an engine and to make fundamental sizing of the installation and to extract thrust to support performance and stability and control analyses.
7.1.1 The Content of this Chapter
• Section 7.2 reviews the most common types of power plants available for or used in modern aircraft. Design information regarding piston engines, turboprops, turbojets, turbofans, and electric motors is presented. In addition, methods to estimate power and thrust as a function of atmospheric conditions and airspeed are provided.
• Section 7.3 discusses topics that affect the installation of engines. Topics ranging from fireproofing to inlet sizing are presented.
• Section 7.4 presents specialized topics related to engines, ranging from how to account for gearboxes, to the extraction of power information from typical engine performance charts, and the use of the ‘petty equation’ for the prediction of the same.
7.1.2 Power Plant Options for Aviation
Modern airplanes are typically propelled by any of the following classes of power plant:
(1) Piston engines (piston propellers)
(3) Jet engines (turbojets and turbofans)
(5) Rockets (very rare, sometimes supplements other engines for T-O)
Piston engines and turboprops are by far the most common means of generating thrust in GA aircraft (FAR Part 23 aircraft), followed by turbofan engines. Turboprops and turbofans are the most common choices for commercial aircraft (FAR Part 25). Turbojets and low-bypass-ratio turbofans are most common for military applications. Small microturbo turbojets have been used for aircraft such as the homebuilt Bede BD-5J (the world’s smallest jet) and the Caproni C22J (a candidate for a military trainer that has GA written all over it).
7.1.3 The Basics of Energy, Work, and Power
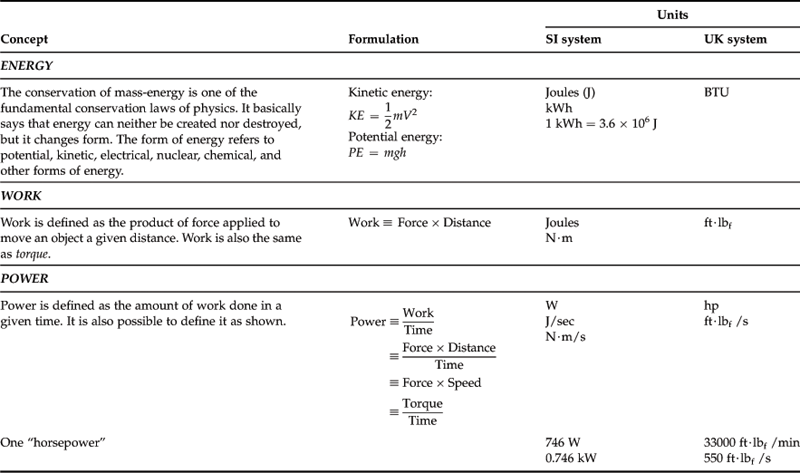
A review of the fundamentals of energy, power, and torque is presented here as a familiarity with various energy and power concepts is essential for the discussion that follows. The basics are shown in Table 7-1.
7.1.4 Thermodynamics of the Power Plant
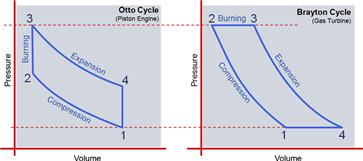
The mechanism by which chemical energy is converted into mechanical energy often requires some medium, such as air. Such processes will change the pressure and volume of the gas, allowing the change in the thermodynamic state of the medium to be used to move a mechanical device, such as a piston or a turbine blade. Consequently, the thermodynamic operation of such devices is often described using thermodynamic cycles, which are represented as a graph on which the pressure and volume of the gas is plotted. Such graphs are plotted in Figure 7-1.
Piston Engines
Piston engines typically operate in accordance with a thermodynamic theory known as the four-stroke Otto cycle. In this cycle, the first step entails a compression of a mixture of air and fuel inside the combustion chamber. This process is shown in Figure 7-1 as a reduction in volume (horizontal axis) and an associated increase in pressure (side 1-2). This is accomplished by moving the piston inside the cylinder so the volume is decreased. The next step is the combustion, in which chemical energy obtained by the rapid burn of the fuel-air mixture increases the pressure without additional change in volume. This is depicted as the vertical increase in pressure (side 2-3). This pressure forces the piston in the opposite direction, increasing the volume as shown by side 3-4. Finally, once the piston reaches the position of maximum volume, a valve is opened, allowing the gases to escape (exhaust). This will drop the pressure inside the cylinder without additional change in volume (side 4-1). This operation is then repeated in the engine.
Gas Turbines
A similar thermodynamic cycle for gas turbines is called the Brayton cycle (see Figure 7-1). In this cycle, air enters the intake to the engine at a specific pressure. It is then compressed using a multi-bladed compressor and forced through ducting that reduces the volume of the air (side 1-2). The air is then directed into a combustion chamber, at which point it mixes with fuel, and the mixture is ignited. The geometry of the chamber forces volumetric expansion without change in pressure (side 2-3). The fuel-air mixture rushes through an opening in the combustion chamber, and impinges on a turbine wheel(s) with the associated conversion to mechanical energy. As this happens, the pressure of the mixture drops and its volume increases (side 3-4). Side 4-1 represents the completion of this cycle as fresh air again enters the inlet to the engine.
7.1.5 General Theory of Thrust Generation
All methods that convert mechanical energy to thrust effectively use the energy to accelerate a mass of air (or water in the case of ships), utilizing Newton’s third law of motion, which states that action requires an equal and opposite reaction. Consider the stream tube displayed in Figure 7-2. The parameters A, P and ρ are the cross-sectional area, pressure, and density, where the inlet is denoted by the subscript ‘i’ and the exit by ‘e’. The mass flow rate through the inlet is thus:
![]() (7-1)
(7-1)
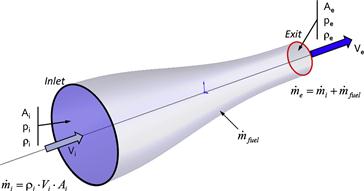
Then consider the introduction of fuel to the system, somewhere between the inlet and exit, denoted by ![]() . This will increase the mass flow rate, so at the exit it will amount to:
. This will increase the mass flow rate, so at the exit it will amount to:
![]() (7-2)
(7-2)
Therefore, the net force acting on the stream tube will be the difference between the pressure at the inlet, pi, and exit, pe, times the area over which it acts, plus the rate of change of momentum of the mixture, i.e.:
![]() (7-3)
(7-3)
Equation (7-3) is modified based on the type of thrust device it is applied to, as shown in the discussion that follows.
Propeller and Gas Turbines
The magnitude of ![]() is generally so small that it can be ignored. Therefore, we rewrite Equation (7-3) as follows:
is generally so small that it can be ignored. Therefore, we rewrite Equation (7-3) as follows:
![]() (7-4)
(7-4)
The only issue here is the determination of the inlet and exit airspeed and pressures. It is possible to extend Equation (7-4) to include propellers by assuming that ![]() ; and that the distance between Ae and Ai approaches zero, so Ae = Ai. This is the result of what is called the actuator-disc or Rankine-Froude momentum theory, presented in Chapter 14, The anatomy of the propeller.
; and that the distance between Ae and Ai approaches zero, so Ae = Ai. This is the result of what is called the actuator-disc or Rankine-Froude momentum theory, presented in Chapter 14, The anatomy of the propeller.
Rockets
For rockets, the values of ![]() and Vi are zero, since no air is introduced (it is effectively replaced by the oxidizing chemical), so
and Vi are zero, since no air is introduced (it is effectively replaced by the oxidizing chemical), so ![]() takes on a governing role and is more appropriately referred to as
takes on a governing role and is more appropriately referred to as ![]() where
where ![]() . Additionally, Ae and Ai both refer to the area at the nozzle exit plane and pi is the ambient pressure. Therefore, we rewrite Equation (7-3) as follows:
. Additionally, Ae and Ai both refer to the area at the nozzle exit plane and pi is the ambient pressure. Therefore, we rewrite Equation (7-3) as follows:
![]() (7-5)
(7-5)
Thrust-to-weight Ratio
The thrust-to-weight ratio, denoted by T/W, is a very important figure of merit for aircraft. It ranges from a value of 0 for un-powered aircraft, to values in the ballpark of 1.1 for many fighter aircraft (see Table 7-2). Of course, thrust changes with airspeed, and weight with time aloft, so the true value of T/W changes in flight. Therefore, the stated T/W usually refers to a specific weight, such as maximum gross weight or some other specific weight, while the thrust refers to the maximum static thrust.
TABLE 7-2
Typical T/W for Selected Classes of Aircraft
| Type of aircraft | T/W range |
| Unpowered (sailplanes, hang gliders, etc.) | 0 |
| General aviation | 0.30–0.45 |
| Commercial jetliners of the 1950s–1960s | 0.18–0.26 |
| Commercial jetliners of the 1970s-present | 0.20–0.35 |
| Modern fighter aircraft | 0.55–1.15 |
The importance of high enough T/W cannot be over-emphasized. As an example, the de Havilland DH-106 Comet 1 suffered two hull losses, one with fatalities, both directly attributed to its low T/W of 0.18. The first incident occurred on October 26, 1952, and the second on March 3, 1953 [2]. In general, due to the low T/W, the airplane had to be rotated with utmost care to avoid a sharp rise in drag and a subsequent reduction of acceleration. In comparison, the modern jetliner has a T/W of the order of 0.3–0.35.
7.1.6 Fundamental Definitions
Brake Horsepower (BHP)
BHP usually refers to the amount of power delivered at the engine output shaft of a piston engine. It is measured using an instrument called a dynamometer, which is a mechanical or electric braking device. In the UK system, the horsepower corresponds to the work required to raise a weight of 33,000 lbf, 1 ft in 1 minute. This also corresponds to the work required to raise a weight of 550 lbf, 1 ft in 1 second. This is written as follows: 1 hp = 33,000 ft·lbf/min = 550 ft·lbf/s. Horsepower can be converted to watts (J/s) in the SI system by multiplying by a factor of 746. In other words:
![]()
Shaft Horsepower (SHP)
SHP refers to the amount of power delivered at the propeller shaft of a gas turbine engine. If the engine features a gear reduction drive (to reduce the RPM to keep the propeller tip airspeed below the speed of sound), sometimes called a propeller speed reduction unit (PSRU), this value may be somewhat less than the horsepower generated by the engine due to losses in the mechanism.
Equivalent Horsepower (EHP)
EHP is a term used only for turboprops and refers to the combination of the SHP and the residual thrust available from its jet exhaust. The EHP is usually about 5% higher than the SHP.
Thrust Horsepower (THP)
THP refers to the amount of power used to propel an aircraft through the air in terms of horsepower. The thrust of turbojets, turbofans, pulsejets, and rockets is generated by accelerating the fluid directly. For that reason, such engines are always rated in terms of the thrust they generate. This contrasts with piston engines and turboprops, whose mechanical work is used to rotate a propeller, which then creates the thrust. This way, it is not the engine per se that generates the thrust, but the propeller, and this is why it is more appropriate to rate such engines in terms of their power. This is easier to see by noting that the thrust generated by such engines depends on the propeller – for instance, one can mount two different types of propeller on the same engine and generate two different levels of thrust at the same power level. This is not the case for a turbofan or a turbojet. One of the nuisances with this difference is that sometimes it is helpful to convert the thrust into horsepower, for instance, to compare the effective power of a piston or a turboprop to a turbofan. This must be done by multiplying the thrust T of the turbofan (or turbojet or pulsejet, etc.) with the airspeed V at which it is flying. If working in the UK system, the thrust is given in lbf and the airspeed in ft/s. The unit for the power is thus in terms of ft·lbf/s, which can be converted to horsepower (i.e. THP) by dividing the product by 550, using the expression below:
Engine Torque and Turboprop Engines
The power output of turboprop aircraft is often represented using torque and RPM, rather than horsepower. Consequently, when considering performance data for turboprop aircraft, it is often helpful to convert the torque and RPM into horsepower.
Torque is equivalent to work (force × distance) and not power (force × speed). Thus, torque is power × time, or power is torque divided by time. Consider a rotating arm of length d rotating at rate RPM due to the force F. Then the work done each minute by the force F is the product of it and the distance over which it is applied. For rotary motion, this can be written as F·2πd·RPM. If we use the UK system of units, this will be in terms of ft·lbf/min. It can, thus, easily be converted to horsepower by dividing by 33,000 ft·lbf/min, yielding the following relationship:
Thus, a turboprop operating at a torque of 1500 ft·lbf and 2000 RPM is delivering 571 SHP of power.
Engine Power and Thrust Ratings
The following concepts are frequently used when specifying engine power and thrust ratings:
(1) Take-off, wet either refers to thrust generation of a jet engine utilizing afterburner or the maximum available T-O thrust of an engine that uses water injection. The latter is more representative of GA aircraft. Water injection dates back to early gas turbine technology, where it was used on turboprop engines such as the Rolls-Royce Dart, which powered aircraft such as the Fokker F-27 and Vickers Viscount. It was also used in jet engines such as the Pratt & Whitney JT3D, which powered the Boeing 707 jetliner. In short, water injection is the mixing of atomized water with air before it enters the combustion chamber. This reduces the temperature of the combustor inlet air and consequently, the turbine entry temperature (TET). The same effect can be achieved by direct injection into the combustion chamber. Since the TET may not exceed material limitations, the injection of water is really a trick to add more fuel (to get more thrust or power) without exceeding engine temperature limits. Injecting water in this fashion is usually limited to a short time, perhaps some 5 minutes. Its use is constrained by altitude and ambient air and water temperature. While water injection is no longer commonly used, Daggett et al. [3] discuss it as a means to reduce NOx emissions and engine operating costs by lowering hot section temperatures and, thus, prolonging its operational life.
Water injection is related to throttle ratio, discussed in a Section 7.2.2, Turboprops. If the throttle ratio is 1, the TET will be at its maximum for engine operation at standard S-L temperature. If the engine operates at a higher than standard temperature, the engine power must be decreased since the combustor entry temperature would be too high and the limiting TET must not be exceeded. Newer engines have a throttle ratio greater than 1, and, therefore, at standard temperature operation, the TET is less than the maximum allowable value. Water injection is thus no longer necessary at higher ambient temperatures and nowadays is often associated with turbo-machinery of yesteryear.
(2) Take-off, dry either refers to thrust generation of a jet engine without the use of an afterburner, or the maximum thrust available for T-O without the use of water injection. The latter is more representative of GA aircraft. The thrust setting is usually limited to 5 minutes. The setting is also permitted to provide reverse thrust during landing.
(3) Maximum continuous power (MCP) or thrust (MCT) refers to the maximum power (or thrust) setting that can be used continuously, although it is usually intended to be used in an emergency (eg. one engine inoperative) situation. In piston-engine aircraft, maximum level airspeed, VH, is obtained at this power setting.
(4) Maximum climb power or thrust refers to the power or thrust setting used during normal climb operations. For piston engines, this is often the same as the MCP, or close to it.
(5) Maximum cruise power or thrust refers to the power setting used for cruise.
(6) Flat rating. An engine is said to be flat-rated if it generates the same thrust or power over a range of temperatures. The thrust or power of an engine operating at wide-open throttle varies inversely with temperature. Thus, its output will be higher on a cold day than a hot one. This is unfortunate for the operation of aircraft as there will be less power (or thrust) available when taking off on a hot day, when other characteristics of the airplane are deficient as well.
Engine manufacturers have responded to this by offering engines with “reported” power ratings that are lower than what the engine is actually capable of generating. Then the fuel control system is used to control the maximum power available by metering the ambient temperature. In this way, as far as the pilot is concerned, the same engine power is available whether operating on a hot or a cold day. This is called flat rating and may be explained by a simple example: consider a piston engine capable of 300 BHP on a standard day (OAT = 518.67 °R or 273.15 K). According to Equation (7-20), the engine power on a day that is 40 °C above a standard day (often written ISA + 40 °C) will only generate some 280 BHP. Therefore, the manufacturer may market it as a 280 BHP flat-rated engine. Then, as far as the pilot is concerned, the airplane is equipped with a 280 and not a 300 BHP engine. The extra 20 BHP are then used to make up for the power lost on a hot day, giving the pilot a fixed (flat) 280 BHP for T-O even on a day that is 40 °C above a standard day.
7.1.7 Fuel Basics
Density of Aviation Gasoline (Avgas)
The density of avgas is 0.71 kg/liter. In the UK system, its weight is 5.9–6.0 lbf/gallon. For analysis work in this text, a weight of 6.0 lbf/gallon is always assumed.
Energy Content of Fuel for Piston Engines
Piston engine power is directly related to the amount of air mass flow into the intake manifold.
The theoretically ideal (stochiometric) ratio for piston engines is 1 kg of fuel to 14.7 kg of air. When achieved, this ratio results in the highest temperature during combustion and is, therefore, of concern when it comes to engine durability. If the air-to-fuel mixture is less than 14.7:1 (e.g. 14:1), it is called rich. If greater (e.g. 15:1), it is called lean. These two concepts are of great importance to pilots.
The energy content of a 1 lbf of avgas is 14,800,000 ft·lbf (20.07 MJ). Burning 1 lbf of avgas in 1 minute with 100% efficiency would generate:
![]()
A typical, modern medium-sized piston engine, such as the Continental IO-360, delivers 200 BHP at maximum power, while consuming 16 gallons of avgas per hour; 16 gal/h amounts to 16 gal/h × 6 lbf/gal = 96 lbf of fuel per hour, which amounts to 96 lbf/60 = 1.6 lbf/min. The equivalent energy content of this fuel is:
![]()
However, only some 200 BHP is delivered as mechanical energy. The resulting efficiency is thus 200/716.8 or 27.9%. In a long-range cruise mode, the same engine delivers 55% of its rated power (110 BHP), while consuming some 8.4 gal/h. Applying the same calculation method we find the efficiency amounts to 29.2%.
Fuel Octane Rating and Fuel Grades for Piston Engines
Fuel octane rating is a measure of the capability of a fuel to resist compression before it spontaneously self-ignites. Thus, fuel with a higher octane number can withstand greater pressure inside the cylinder before igniting in this fashion. For this reason high-octane-number fuel must be used in high-compression (high-performance) engines or they will suffer from engine knocking. That aside, the concept is one that is often misunderstood as there are a number of different octane ratings (e.g. Research Octane Number, RON; Motor Octane Number, MON, etc.). These definitions are outside the scope of this book.
Fuel used to power piston engines aircraft is commonly known as avgas, or aviation gasoline. This contrasts with mogas, or motor gasoline, which is used in cars and some experimental and a few GA aircraft. The difference between the two is that avgas contains a toxic chemical called tetraethyl lead (TEL), which is used to improve the combustion properties of the fuel. The fuel octane rating is used to differentiate between a few grades of fuel, which are offered in different colors to prevent incorrect selection (see Table 7-3).
TABLE 7-3
Common Fuel Grades for Piston Engine Use
| Fuel grades | Color | Comment |
| 80/87 | Red | The first number (80) is the octane rating assuming a lean mixture. The second number (87) indicates the rating at a rich mixture. Used for aircraft engines with low compression ratios. No longer produced. |
| 82UL | Purple | UL stands for unleaded. Similar to mogas, but without automotive additives. Intended for low-compression engines such as those common in experimental aircraft and aircraft that have STCs permitting the use of mogas. No longer produced. |
| 91/96 91/96UL |
Brown | UL stands for unleaded. Avgas is often intended for military use (e.g. UAVs). Produced today by the Swedish fuel manufacturer Hjelmco in a clear color. |
| 100LL | Blue | LL stands for low lead. The most common avgas in use today. The fuel can be used with engines designed for 80/87. |
| 100/130 | Green | Also called avgas 100. Has been superseded by 100LL, although still available in limited quantities. |
| 115/145 | Purple | Leaded fuel produced for warbirds and the supercharged radial engines used to power the passenger planes of the 1940s–1960s. Now produced in limited quantities for air races. This fuel is necessary in order to obtain rated power in such engines. |
Fuel Grades for Jet Fuel
There is also a wide range of fuel grades intended for jet engines. Table 7-4 lists those most common for civilian aircraft. A range of jet fuel with specifications for different countries is available to, but not presented here. More details are available from Ref. [4]. For analysis work in this text, a density of 6.7 lbf/gallon is always assumed.

Specific Fuel Consumption (SFC)
Specific fuel consumption (SFC) is one of the most important metrics employed in aviation. It is important not only in aircraft design but also in the operation of the aircraft. First and foremost, SFC indicates how efficiently a power plant converts chemical into mechanical energy. While there is usually not a great variation in SFC between engines within a specific class of power plants, there is a huge variation between the classes. Thus, piston engines are generally more efficient than turbo machinery, which is far more efficient than, say, rockets. This is important when ensuring the selection of power plant matches the mission of the airplane, although most of the time this is not a problem. The primary importance is when estimating range and endurance of the aircraft.
As discussed in Section 7.1.5, General theory of thrust generation, the operation of any mechanical engine requires chemical energy to be converted into mechanical energy, typically by an intermediary conversion to thermal energy. In conventional piston and jet engines, the chemical energy stored in the fuel is consumed in an exothermic chemical reaction (via combustion) that adds considerable thermal energy to the air, rapidly increasing pressure or volume. The change in these states is then used to move the mechanical elements of the machine.
Consider two engines, call them A and B. If engine A requires less fuel to generate a given power (or thrust for jet engines) than engine B, then we say it is the more efficient of the two. This would place engine B at a competitive disadvantage. So, efficiency clearly plays an imperative role in the marketability of an engine (just like weight).
It is crucial for the engineer to be able to compare the efficiency of different power plants for design purposes and this is accomplished by the definition of fuel consumption as the quantity of fuel burned in a unit time (lbs/hr, kg/min, etc.). This is sometimes referred to as fuel flow (FF). We then define specific fuel consumption (SFC) as the quantity of fuel burned in unit time required to produce a given engine output. SFC is a technical figure of merit that indicates how efficiently the engine converts fuel into power.
We will now consider SFC for jet engines and piston engines separately.
SFC for Jets
The fuel consumption of jet engines is always measured in terms of mass or weight of fuel flow, per unit time, per unit thrust force. For instance, a small jet engine may burn some 1600 lbf (725 kg) of fuel in a matter of an hour at a T-O thrust setting. If the thrust of the engine is known, the SFC can be computed as shown below:
The pure turbojet, of the kind used in the early days of the jet propulsion, has very poor efficiency. The high-bypass turbofan, in comparison, has superb efficiency, something that explains their wide use in modern passenger transport aircraft.
SFC for Pistons
The fuel consumption of piston engines is always measured in terms of mass or weight of fuel flow per unit time, per unit of power. For instance, a small piston engine may burn some 100 lbf (45 kg) of fuel in a matter of an hour at a T-O power setting. If the power of the engine is known in BHP or kW, the SFC can be computed as shown below:
7.2 The Properties of Selected Engine Types
A large number of devices have been invented that convert the chemical energy available in fuel into mechanical energy and presenting them all would take volumes. Therefore, only the three main engine types that are commonly used in GA aircraft are presented in this section: the piston engine, gas turbine, and electric motor. The piston engine and gas turbine are used for the vast majority of all aircraft and will thus take precedence. The electric motor is an emerging technology that has been used for a long time in radio-controlled aircraft, but advances in battery technology are already allowing their use in light aircraft and are therefore also discussed.
There is a secondary aim of this section, which is to provide tools to help the aircraft designer estimate power and thrust for use in performance and stability analyses.
7.2.1 Piston Engines
The piston engine has been a stalwart of the aviation industry since the Wright brothers flew the first airplane on December 17, 1903. The modern piston engine is very reliable, affordable, common, and relatively light, which has made it ideal for use in aircraft. For airplanes, piston engines come in a variety of sizes, ranging from tiny single-piston, glow-plug engines such as the Cox Tee Dee 0.010 in3 engine, used to power small radio-controlled aircraft, to the giant 5000 BHP Lycoming XR-7755 36-cylinder [6] radial piston engine, intended to power huge airplanes like the early Cold-war era Convair B-36 ‘Peacemaker.’ Some modern manufacturers of piston engines for UAV and GA aircraft are listed in Table 7-5. Note that at the time of writing, all the manufacturers were still in business. Out-of-business piston engine manufacturers are not included.
TABLE 7-5
Selected Manufacturers of Piston Engines for GA and UAV Aircraft

GA = general aviation aircraft, LSA = light sport aircraft, UAV = unmanned aerial vehicles, RC = radio-controlled aircraft.
The piston engines considered in this chapter all share the commonality of consisting of one or more pistons that attach to a crankshaft and operate inside a cylinder. There are many variations of the concept, of which the so-called Wankel engine is the best known, but the engines dealt with here are all conventional pistons as described above, of which there are two types: two- and four-stroke. Several common types of piston engines are shown in Table 7-6.
TABLE 7-6
Power and Weight of Selected Piston Engines for GA and Experimental Aircraft
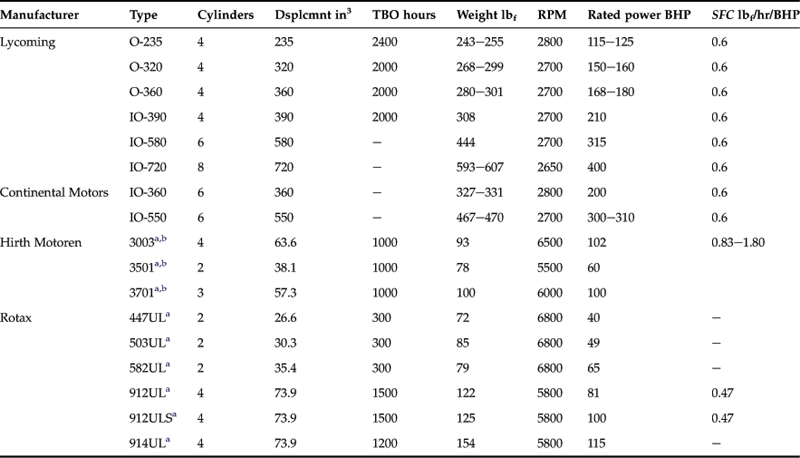
TBO = time between overhauls, RPM = revolutions per minute, SFC = specific fuel consumption.
Two-stroke versus Four-stroke Engines
Two-stroke engines are valve-less so they are simpler, lighter, and less expensive to manufacture. They are less durable than four-stroke engines because they lack a dedicated lubrication system. Instead, they require oil to be mixed in with the fuel (about 4 oz per gallon of fuel). For this reason they burn a considerable amount of oil when compared to the four-stroke engine.
A two-stroke engine will exhaust combustion gases and draw in a fresh fuel/air mixture on the down-stroke. It will then compress and ignite the mixture on the up-stroke. A four-stroke engine will ignite with a subsequent down-stroke. On the following up-stroke the combustion gases are forced out of the cylinder. As the piston’s next down-stroke begins, the fuel/air mixture will be drawn into the cylinder and be compressed and ignited on the subsequent up-stroke. Thus, ignition occurs once every revolution in a two-stroke engine, but once every other revolution in a four-stroke. This gives the two-stroke engine a significant power boost and allows it, potentially, to double the power for the same-displacement engine. A two-stroke engine manufactured by Hirth Engines is shown in Figure 7-4.
The operation of a two-stroke engine is less efficient than that of a four-stroke engine. This results from the use of cleaner gasoline in a four-stroke engine, which is not mixed with oil as is the fuel for two-stroke engines. As a consequence the combustion burns the fuel more completely and at a higher temperature than possible in a two-stroke engine and both lead to higher efficiency. Additionally, the two-stroke approach leaves remnants of combusted gases inside the cylinder during compression and ignition and forces unburned gas into the exhaust, resulting in greater emission of environmentally harmful chemicals.
Operation of the Four-stroke Engine
Figure 7-3 shows a schematic of a four-cylinder internal combustion engine. The piston and cylinders have been labeled 1 through 4 and are shown during the four stages of the Otto cycle (refer to Figure 7-1).
(1) Injection: piston is at the end of its down-stroke and has drawn in a fresh fuel/air mixture.
(2) Compression: piston is at the end of its up-stroke and has compressed the fuel/air mixture just prior to ignition.
(3) Combustion: mixture has been ignited and the down-stroke of the piston is beginning.
(4) Exhaust: piston is beginning its up-stroke, forcing the combustion gases out and into the exhaust tube.
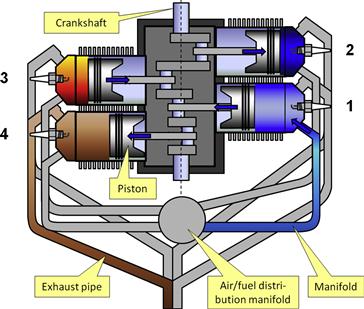
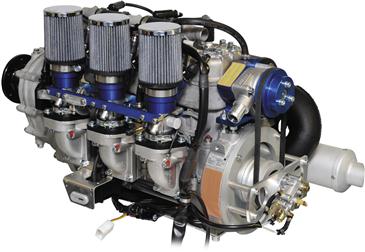
FIGURE 7-4 A Hirth 3702, 84 BHP (62 kW) three cylinder, two-stroke, water-cooled piston engine for light experimental (homebuilt) aircraft. (Courtesy of Hirth Engines. www.hirth-motoren.de)
There are a number of concepts concerning piston engines that one must be aware of.
Air-to-fuel Ratio
As stated in Section 7.1.7, Fuel basics, the ideal stochiometric (air-to-fuel) ratio is 14.7:1 and it yields the least amount of carbon monoxide emissions. However, the engine’s maximum power is generally achieved at about 12:1 to 13:1 (rich mixture). On the other hand, minimum fuel consumption is achieved at approximately 16:1 (lean mixture).
Compression and Pressure Ratios
The compression ratio is defined as the ratio between the volume of the cylinder with the piston in the bottom position, Vbottom (largest volume), and in the top position, Vtop (smallest volume). The higher this ratio, the greater will be the power output from a given engine. It is generally in the 6–10 range.
Similarly, the pressure ratio is defined as the ratio of the pressures inside the cylinder with the piston in the top and bottom positions, denoted by ptop and pbottom, respectively. Assuming adiabatic compression inside the cylinder (no heat energy is added when compressing the gas), the relation between the pressure and volume can be shown to comply with the following expression:
![]() (7-13)
(7-13)
Displacement
Displacement is the total volume of the combustion chamber in the piston engine. The diameter of each cylinder is called a bore. The total distance a piston moves is called a stroke. The displacement of an engine with N cylinders is defined as follows:
![]() (7-14)
(7-14)
The displacement represents the maximum volume of the combustion chambers of all the cylinders assuming the piston is simultaneously at the bottom of the stroke for all (an impossible scenario).
Typical Specific Fuel Consumption for Piston Engines
The fuel consumption of piston engines varies by type, as shown in Table 7-7.
TABLE 7-7
Specific Fuel Consumption of Typical Normally Aspirated Piston Engines for Aircraft
| lbf/hr/BHP | gr/kW/hr | |
| Two-stroke | 0.83–1.80 | 280–600 |
| Four-stroke | 0.42–0.60 | 140–205 |
A typical breakdown of how energy is wasted in piston engines can be seen in Table 7-8.
TABLE 7-8
Energy Wasted in a Piston Engine (Based on Ref. [7])
| Cause | Percentage |
| Available in fuel | 100 |
| Heat lost to oil | −2 |
| Heat lost to cooling air | −11 |
| Heat lost to radiation | −5 |
| Heat lost to exhaust | −52 |
| Mechanical losses | −5 |
| SUM | ≈25% |
Effect of Airspeed on Engine Power
Generally, the power generated by a piston engine is assumed constant with airspeed, making it an airspeed-independent power plant. Effectively, this means that if a piston engine produces 100 BHP at a specific power setting, say, at stalling speed, it will also generate 100 BHP at the same power setting at its maximum airspeed. In real applications, however, the power output from the engine depends on the pressure recovery at the manifold. If the pressure recovery is airspeed-dependent, for instance as a consequence of the changes in the attitude of the aircraft, then the engine power will become airspeed-dependent, albeit only slightly so. However, for all intents and purposes, during design work, piston engine power output can be considered independent of airspeed.
Effect of Altitude on Engine Power
The power output of normally aspirated engines depends on how efficiently the mixture of air and fuel burns inside the cylinder during combustion, a process that sharply increases the pressure inside the cylinder and pushes the piston in the opposite direction. This, in turn, depends on the total quantity of oxygen molecules (O2) initially inside the cylinder as the piston begins the compression stroke. The quantity of molecules inside the enclosed volume of the cylinder, of course, is the density and it is directly related to the initial pressure in the cylinder, as realized through the equation of state. For this reason, pressure and density are fundamental variables in the operation of piston engines. This, of course, implies that such engines are highly dependent on the density of air, which is a function of altitude.
Initial pressure in the cylinders can be increased by two means: by recovering as much ram air pressure as possible in the engine manifold (pertains to normally aspirated engines); and by artificially increasing the pressure in the manifold. The former is achieved by ensuring the intake is not blocked and is located in an area where air is allowed to stagnate with minimum losses. The latter can be done through the process of turbo-charging or turbo-normalizing.
To estimate the impact of altitude on the power output of an engine some specialized models are applied. The simplest one, presented below, assumes that the engine power is directly dependent on the density ratio:
where P, ρ and σ are power, density, and density ratio at altitude, respectively; and PSL and ρSL correspond to S-L values. Another more accurate altitude model for piston engines is the Gagg and Ferrar model [8], here presented in its three most frequently encountered forms:
where
The two expressions above are used with normally aspirated engines only. Figure 7-5 shows a comparison between the simplified and Gagg and Ferrar models. The horizontal axis shows the percentage power and the vertical altitude in ft. One way of reading the graph is to ask how much power a piston engine delivers at a given altitude. For instance, how much power does an engine rated as 200 BHP at S-L deliver at full throttle at 15,000 ft? By tracing the horizontal line extending from 15,000 ft to the point where it intersects the thick curve of the Gagg and Ferrar model, it can be seen it delivers approximately 57.5% power, or 0.575 × 200 = 115 BHP. By the same token, consider the same engine, at S-L, at some arbitrary throttle setting that generates 100 BHP. At the same altitude it will deliver a mere 57.5 BHP at the same throttle setting. The Gagg and Ferrar model matches manufacturers’ data far better than the former and is recommended for design work.
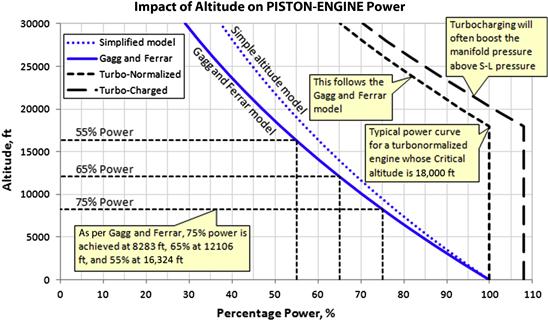
FIGURE 7-5 A comparison showing the difference between several models used to describe how piston-engine power is affected by change in altitude.
Straight lines representing 55%, 65%, and 75% power have been plotted in Figure 7-5, but these represent typical power settings reported by manufacturers or widely known publications such as Jane’s All the World’s Aircraft. It can be seen that once the engine is at 8283 ft, even at full throttle the maximum engine power will not exceed 75% of its rated S-L value as long as it is normally aspirated. Corresponding altitudes for 65% and 55% are shown as 12,106 ft and 16,324 ft, respectively. In order to prevent this sort of power loss with altitude, the air flowing into the manifold must be introduced at a higher pressure. It must be pre-pressurized.
Ideal manifold pressure for a normally aspirated engine is around 29.92 in Hg, depending on the ambient pressure, so ideally such pre-pressurization should maintain this pressure to as high an altitude as possible, and even boost it a tad. There are three common ways of doing this: by supercharging, turbo-charging, or turbo-normalizing. Discussing these devices in detail is beyond the scope of this book, so only a few introductory facts will be included here.
Supercharging is the oldest method known to pre-compress air prior to entering the cylinder of a piston engine. A supercharger is a compressor, often of a centrifugal design, that is directly or indirectly connected to the engine. Such devices may operate at rotation rates as high as 120,000 RPM. And while requiring additional energy from the engine to drive it, the increase in power far overweighs the cost of its production. A supercharger will often generate manifold pressure in the 50–60 in Hg range. For instance, Ref. [9] specifies 52 inHg MAP for the C-46 Commando, a twin-engine heavy transport aircraft from the Second World War era.
A turbocharger is a centrifugal compressor that features a turbine that is driven by the hot exhaust gases from the engine. For this reason, when operating at optimal conditions it puts no additional load on the engine. Rather it utilizes the thermal energy that otherwise would go unharnessed into the environment. This causes it to inflict reduced load on the engine, making it more efficient than a supercharger. However, its presence causes back-pressure to mount in the exhaust manifold, reducing the efficiency of the engine. The magnitude of the back-pressure is largely dependent on a complex interaction between important parameters such as RPM, throttle setting, ambient pressure, and geometry of the inlet [10]. Back-pressure is the obstruction to free flow of the exhaust gases through the tailpipe. Additionally, an exhaust-driven compressor is less efficient than a mechanically driven one.
The third type is turbo-normalization, which really is a turbocharger designed to limit (or normalize) the manifold pressure to that at S-L up to its critical altitude, hence its name. The critical altitude is one at which the ambient pressure has dropped so much that the compressor can no longer deliver air at S-L pressure into the manifold. The turbo-normalizing differs from turbocharging in that it limits the maximum manifold pressure to that of the S-L pressure up to the critical altitude. The turbocharger, on the other hand, increases the manifold pressure above what is possible at S-L. Thus, super- and turbochargers may maintain the manifold pressure to between 32 and 38 in Hg, in contrast to 29.92 inHg average pressure at S-L. The increased pressure implies a greater number of air molecules that must combine with fuel to ensure proper combustion and, therefore, the process increases power, but fuel consumption and engine wear. Turbo-normalizing, in theory, maintains rated S-L power and fuel consumption with altitude. Thus, its operation at altitude is not unlike what it is at S-L.
The impact of altitude on turbocharged and turbo-normalized engines is shown in Figure 7-5. The turbocharged engine is shown to yield power higher than that possible at S-L. The turbo-normalized engine, on the other hand, provides S-L power up to its critical altitude. The critical altitude differs from installation to installation. Some typical installations have a critical altitude of 18,000 ft, while some GA aircraft are capable of even higher altitudes. For instance, the Cirrus SR22 is offered with a turbo-normalized engine capable of S-L power up to 25,000 ft. Such a feature has great customer value because it effectively means its maximum available power is independent of altitude.
Engines that are pressurized in this fashion can be analyzed by assuming power to decrease after the critical altitude has been achieved in accordance with the Gagg and Ferrar model. Mathematically, if the S-L power is given by PSL and critical altitude by hcrit, then power can be estimated using the following expression:
It is inevitable that the compression of air greatly increases its temperature. Therefore, some such mechanical systems use intercoolers to cool the air exiting the centrifugal compressor. The temperature rise can be approximated by assuming a thermodynamic process called an isentropic process (an isotropic process is one which is both adiabatic and reversible). Using this process, the change in temperature can be estimated from:
![]() (7-19)
(7-19)
Effect of Temperature on Engine Power
Since power is affected by density and pressure, it follows suit that it is also influenced by temperature. The following expression is used to correct power at non-standard temperature conditions:
![]() (7-20)
(7-20)
where
Pstd = standard power at altitude and ISA
κ = lapse rate constant (Table 16-2)
Tstd = standard day temperature
Note that Equation (7-20) is recommended by several piston engine manufacturers without specifically presenting derivations for it. As will be demonstrated in the following example, it over-estimates the engine power when compared to the Gagg and Ferrar model with density ratio based on the ideal gas law. The author recommends the latter method as it yields more conservative performance estimations.
EXAMPLE 7-3
Estimate the power of a piston engine rated at 100 BHP while being operated at full power at 10,000 ft on a day on which the OAT is 30 °F (or 30 °R) higher than ISA.
Solution
Method 1: Use of Equation (7-20)
![]()
Standard day temperature at 10,000 ft:
![]()
Density ratio at 10,000 ft (standard day):
![]()
Maximum power at 10,000 ft per Gagg and Ferrar:
![]()
This is further reduced by the warmer-than-normal day using Equation (7-20) as follows:
![]()
Method 2: Ideal gas law with Gagg and Ferrar
The answer can also be estimated using the ideal gas equation as follows:
Effect of Manifold Pressure and RPM on Engine Power
The relationship between the manifold pressure and RPM is complex and is usually presented by the piston engine manufacturer in the form of a special graph called an engine performance chart. An example of such a chart is shown in Section 7.4.2, Step-by-step: Extracting piston power from engine performance charts. The primary drawback of this plot is that it lends itself very poorly to modern utilization in spreadsheets. The solution to this remedy is found in a specialized formula, called the Petty equation. This powerful tool is presented in Section 7.4.3, Extracting piston power using the Petty equation.
7.2.2 Turboprops
A turboprop is a gas turbine engine designed to primarily drive a propeller as the thrust generator. It differs from a jet engine in that the thrust generated by the engine itself is very small compared to the contribution of the propeller. The turboprop engine packs far more power per unit weight than the piston engine. As an example, the power-to-weight ratio of turboprops is generally in the 2.3 to 2.7 SHP/lbf range for the modern gas turbine (1.5–1.7 SHP/lbf for gas turbines from the 1950s to 1970s). This compares very favorably to the 0.5 to 1.0 BHP/lbf range for the typical piston engine. Figure 7-6 shows a typical turboprop installation in an agricultural aircraft.
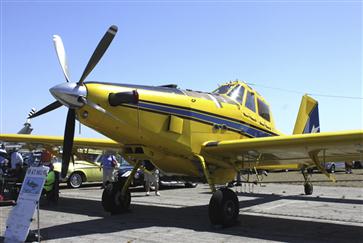
FIGURE 7-6 A typical installation of a turboprop on an agricultural aircraft (Air Tractor AT-802). The comparative light weight of a gas turbine requires it to be mounted far ahead of the wing, something that also increases propeller effects. (Photo by Phil Rademacher)
Since the gas turbine rotates at a high rate (often in the 20,000–40,000 RPM range), a gear reduction drive must be used to reduce the rotation rate of the propeller. Turboprops have proven themselves a very reliable powerplant for aircraft, not to mention generating ample power at high altitudes (where they become more efficient). These qualities have resulted in great popularity among domestic and utility aircraft, as they allow aircraft to fly onto small and sometimes unimproved strips and then take-off and climb to altitudes that allow them to fly above weather.
One of the most popular such engines is the Pratt & Whitney Canada PT6 turbine, currently used by more than 6500 operators over the entire planet. It is a family of engines that offer power ranging from 500 SHP to 2000 SHP. It was developed by a company that traces its origins to the 1930s, to a small organization that specialized in the maintenance of Pratt & Whitney Wasp radial engines [11]. The development of the PT6 began in the 1950s and it was introduced to the market in the 1960s. To date, some 36,000 units have been delivered, making it the world’s most widely used gas turbine engine in its class.
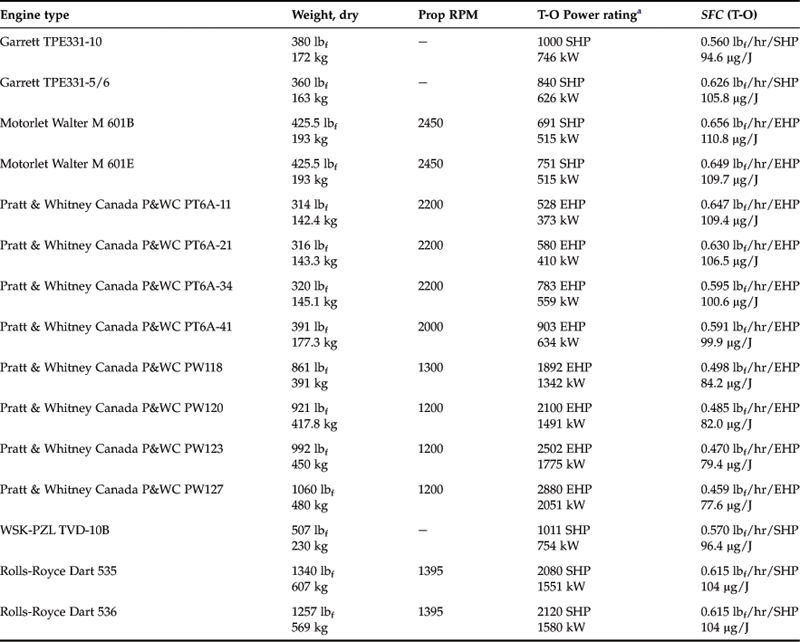
Typical Fuel Consumption
One of the primary drawbacks of turbo machinery is high fuel consumption. This makes gas turbines primarily useful for high-altitude operation, where low-density-reduced fuel consumption (as a consequence of maintaining a constant fuel-to-air ratio) and high true airspeed make their use practical. Table 7-9 shows the typical specific fuel consumption of selected turboprop engines.
Turboprop Inertial Separators
The proximity of the tip of a rotating propeller tends to throw up a cloud of dust and particles that can get sucked into the inlet of gas turbine engines. For this reason many are equipped with an inertial separator that the pilot can activate while maneuvering at low speeds on the ground. The inertial separator refers to the geometry of the inlet, which forces air to make a sharp turn before entering the engine inlet. The sharp turn cannot be made by heavy particles, which get separated from the stream of air and are thrown out of the engine inlet. Inertial separators save a lot of engines from great harm.
Throttle Ratio (TR)
Ambient air is the propellant in gas turbine engines. For this reason, it should not be surprising that atmospheric properties significantly influence their performance. The pressure of air affects engine thrust through its effect on mass flow rate and, since both pressure and density are lower at higher altitudes, engine thrust will also reduce with altitude. However, the total temperature, Tt0, of which static temperature, T0, is a part per the expression Tt0 = T0[1 + (γ − 1)M²/2], affects engine behavior in more profound ways than both pressure and density.
As the flight Mach number and altitude change, so does the total temperature. Engine materials and cooling methodologies place limitations on compressor exit temperature (CET) and turbine entry temperature (TET). The former is the temperature of air as it leaves the last compressor stage and the latter is the temperature after combustion immediately before it enters the first turbine stage. In order to keep compressor efficiencies at a practical level, the engine may operate at its maximum TET and maximum compressor pressure ratio only at one specific value of Tt0, say, Tt0des (call it design total temperature). The ratio of this total temperature to standard S-L temperature (518.67 °R) is known as theta-break. If the actual Tt0 is less than Tt0des (which could be caused by lower flight Mach number or higher altitude) then TET must be decreased to maintain efficiency. If the actual Tt0 is greater than Tt0des (due to operation at higher Mach or lower altitude) then the power generated by the turbine is reduced, causing the compressor pressure ratio to decline.
High compressor pressure ratio results in good thrust specific fuel consumption (TSFC) and high TET yields high specific thrust ![]() , where F is the thrust generated and
, where F is the thrust generated and ![]() is the mass flow rate through the engine. These imply that it is best to operate the engine always at its theta-break; however, this is never possible since an engine is required to satisfactorily operate at various Mach numbers and altitudes. As a compromise, an engine may be designed so that it has a theta-break value roundabout the most desired combination of altitude and Mach number. The engine is then said to have throttle ratio (TR) equal to the theta-break value. For instance, if the desired combination is, say, M = 0.6, sea level, then the theta-break will be (Tt0/Tstd) = 1.072, and the engine has TR = 1.072. On the other hand, if M = 0 and h = 0 (takeoff condition) is chosen as the desired combination, then the theta-break (and TR) will be 1.
is the mass flow rate through the engine. These imply that it is best to operate the engine always at its theta-break; however, this is never possible since an engine is required to satisfactorily operate at various Mach numbers and altitudes. As a compromise, an engine may be designed so that it has a theta-break value roundabout the most desired combination of altitude and Mach number. The engine is then said to have throttle ratio (TR) equal to the theta-break value. For instance, if the desired combination is, say, M = 0.6, sea level, then the theta-break will be (Tt0/Tstd) = 1.072, and the engine has TR = 1.072. On the other hand, if M = 0 and h = 0 (takeoff condition) is chosen as the desired combination, then the theta-break (and TR) will be 1.
To the extent of the author’s knowledge, the concept of throttle ratio was first introduced by Mattingly, Heiser, and Pratt [13], in their aircraft engine design textbook. The book presents a very convenient method to estimate the thrust of gas turbine engines (turboprops, turbojets, and turbofans) as a function of flight conditions. The fundamentals of the method were developed by Mattingly [14] and utilizes simple empirical algebraic equations dependent on Mach number and altitude to determine the change in thrust from some baseline thrust value. The method is ideal for use in spreadsheets or software routines during the conceptual and preliminary design stage of aircraft featuring such engines (for instance see the Microsoft Excel Visual Basic routine presented in the Section 7.2.6, Computer code: Thrust as a function of altitude and Mach number).
The TR is selected by the engine manufacturer and is required for an accurate prediction of engine thrust and, thus, for aircraft performance analysis. An important consequence of the selection of TR can be seen from the following: as stated above, an engine with TR = 1 will be at its theta-break point at M = 0, h = 0, and, consequently, its TET will be at its maximum (assuming standard day conditions – ISA). Therefore, no further increase in the turbine entry temperature is possible. This means that when the aircraft is operating at an elevated temperature, say for instance 20 °C above ISA, the turbine power will be reduced. This, in turn, will detrimentally affect the T-O distance and rate of climb. It is possible to restore some of this loss using technology such as water injection.
By the same token, an engine selected so its TR > 1, say TR = 1.072, will operate at less than its maximum TET at M = 0, h = 0. In response to elevated ambient temperature the TET may be raised to compensate, and this allows constant thrust to be maintained up to some specific altitude. In this case, the thrust may be maintained up to ambient temperature of 518.67 × 1.072 = 556 °R (87 °F or 35 °C). From the standpoint of aircraft design, this is very favorable as it permits a far more impressive performance on hot days.
The name “theta-break” can be inferred from gas turbine performance graphs (e.g. see Figure 6.E8 of Ref. 13), which show a decisive break in each curve. For instance, in the cited figure, the break occurs at M = 0.6 at S-L, but at M = 1.45 at 36,000 ft. The particular engine has a unique TR (1.07 in this case), but the break shifts to higher Mach numbers with increasing altitude due to decline in T0. Beyond 36,000 ft, however, the break remains at the same Mach number (stratosphere).
Step-by-step: Effect of Altitude and Airspeed on Turboprop Engine Thrust
The effect of altitude and airspeed on the thrust of turboprop engines can be modeled using the Mattingly method of Ref. [13].
Step 1: Determine the baseline thrust to use at S-L, FSL, for instance the maximum static thrust at ISA.
Step 2: Calculate temperature ratio:
![]() (7-21)
(7-21)
Step 3: Calculate pressure ratio
![]() (7-22)
(7-22)
Step 4: If M ≤ 0.1 then
![]() (7-23)
(7-23)
If M > 0.1 and θ0 ≤ TR then
![]() (7-24)
(7-24)
If M > 0.1 and θ0 > TR then
![]() (7-25)
(7-25)
where
F = thrust at (the atmospheric) condition
FSL = thrust the engine would be producing at a given power lever setting at S-L
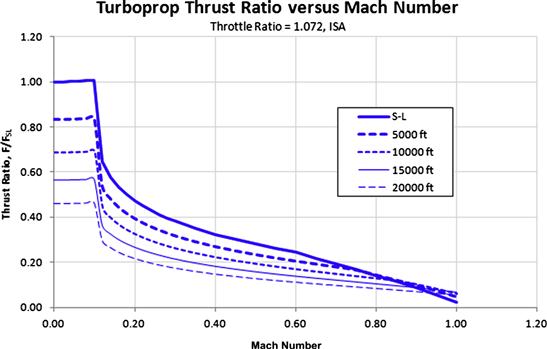
The thrust of a generic turboprop engine is plotted for several altitudes as a thrust ratio (i.e. as F/FSL) in Figure 7-7 using the above formulation and a TR = 1.072. The sharp drop around M = 0.1 occurs when the TET reaches a maximum because of the increase in total air temperature. Until that point, it is possible to maintain constant thrust – something that offers great performance improvements in the operation of turboprop aircraft. Of course, this comes at the cost of a reduction in compression ratio at elevated temperatures in order to keep the TET below its maximum permissible value. In other words, the engine is flat-rated to a given thrust output at standard atmospheric conditions (ISA), even though, theoretically, it could generate thrust greater than what its flat-rating indicates. Plotting the thrust ratio, as is done in Figure 7-7, rather than for a specific rated S-L thrust, allows the curves to be applied to nonspecific turboprop engines. It can be shown using the formulation that at an altitude of approximately 7800 ft the maximum thrust has fallen to 75% of the rated S-L value.
Austyn-Mair and Birdsall [15] present the effect of altitude and airspeed on turboprop power rather than thrust using the following expression:
![]() (7-26)
(7-26)
where
The engine-dependent constants A and n must be selected based on engine data provided by the engine manufacturer. The designer should request power output at specific altitudes and Mach numbers and use this to determine both constants. The constant n is a fraction between 0 and 1, and is often close to 0.5. It reflects the fact that the available shaft power increases with ram pressure in the engine intake.
7.2.3 Turbojets
While the turbojet is rarely used for certified GA aircraft, there are a number of such installations on experimental aircraft and UAVs. One of the best-known uses of a jet engine in such an aircraft was the installation of a Microturbo TRS-18 turbojet in a Bede BD-5J single-seat kit plane. And as stated earlier, a pair of those was used to power the Caproni C22J trainer aircraft. Microturbo (www.microturbo.com) is a well-known manufacturer of small turbojets for drones. PBS VB (www.pbsvb.com) is a company in the Czech Republic that manufactures small turbojets for experimental aircraft and even self-launching sailplanes. Its engines have been installed on a Sonex experimental aircraft and Blanik, Salto, and TST-14J BonusJet sailplanes. The Blanik has been operated at altitudes as high as 32,000 ft using the engine.
Typical Fuel Consumption
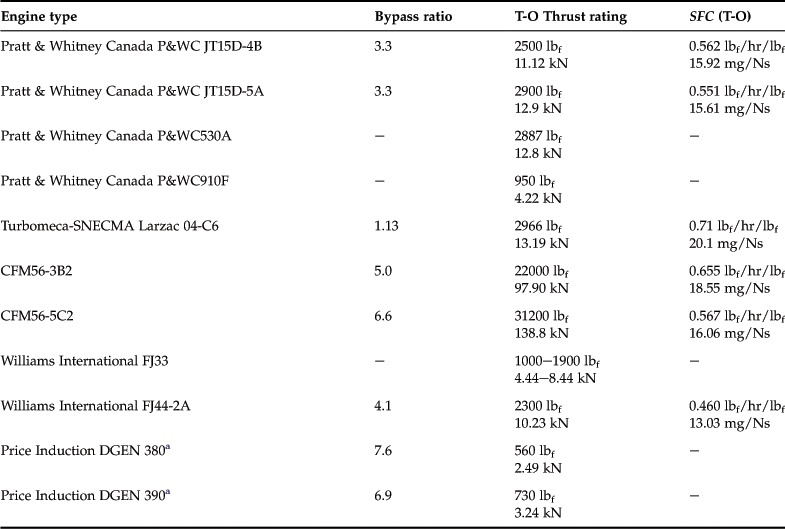
Table 7-10 shows the typical specific fuel consumption of selected turbojet engines. Note that the reported values are all at a maximum T-O thrust.
TABLE 7-10
Typical T-O Thrust and SFC of Selected Turbojet Engines.
| Engine type | T-O Thrust rating | SFC (T-O) |
| Instytut Lotnictwa IL K-15 | 3305 lbf 14.7 kN |
1.006 lbf/hr/lbf 28.49 mg/Ns |
| LM WP6 | 6614 lbf 29.42 kN |
0.980 lbf/hr/lbf 27.76 mg/Ns |
| Microturbo TRS 18-046 | 202 lbf 0.898 kN |
1.27 lbf/hr/lbf 35.97 mg/Ns |
| Microturbo TRS 18-056 | 221 lbf 0.982 kN |
1.27 lbf/hr/lbf 35.97 mg/Ns |
| Microturbo TRI 60 | 772 lbf 3.430 kN |
1.25 lbf/hr/lbf 35.40 mg/Ns |
| PBS VB TJ100 A | 247 lbf 1.097 kN |
1.090 lbf/hr/lbf 30.87 mg/Ns |
| PBS VB TJ100 C | 225 lbf 1.000 kN |
1.177 lbf/hr/lbf 33.33 mg/Ns |
From Ref. [12]
Step-by-step: Effect of Altitude and Airspeed on Turbojet Engine Thrust
Reference [14] also presents a method to estimate the effect of altitude and airspeed on the thrust of turbojet engines, similar to the method of Section 7.2.2, Turboprops. Turbojets are typically used in military applications and, thus, feature formulation for maximum and military thrust (with afterburner used).
Step 1: Calculate temperature ratio:
![]() (7-21)
(7-21)
Step 2: Calculate pressure ratio
![]() (7-22)
(7-22)
Step 3a: Maximum thrust (means afterburner is on)
Step 3b: Military thrust (means afterburner is off)
where
F = thrust at (the atmospheric) condition
FSL = thrust the engine would be producing at the power setting at S-L
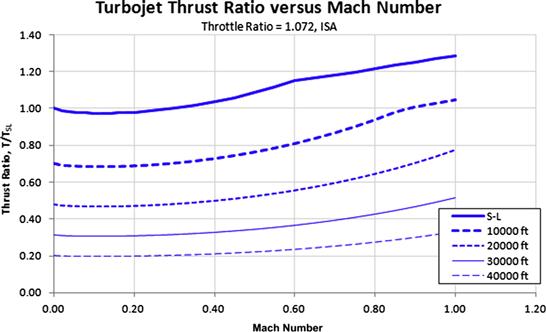
The thrust of a generic turbojet engine is plotted for several altitudes as a thrust ratio (i.e. as T/TSL) in Figure 7-8 using the above formulation and a TR = 1.072.
7.2.4 Turbofans
Turbofan engines are used in a number of GA aircraft. While most are business jets, recently a few new jets have emerged that are powered by turbofans; these are known as Personal, Jets, and are designed to be owner flown and operated, analogous to the operation of single-engine, piston-powered aircraft. This trend has led to the development of small turbofans, such as the DGEN 380 in Figure 7-9. Examples of such jets are the Cirrus SF50 Vision and the Diamond Jet. These airplanes are made possible by the development of low-thrust certified turbofans manufactured by Williams International and Pratt & Whitney Canada. One such engine, the Williams International FJ44, is shown in Figure 7-12.
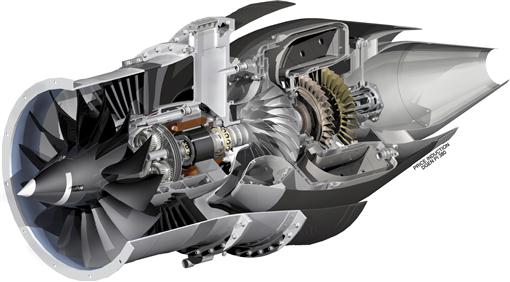
FIGURE 7-9 A cutaway of the Price Induction DGEN 380 730 lbf thrust turbofan engine specifically designed for low and slow GA aircraft. (Courtesy of Price Induction)
The turbofan differs from the turbojet in that the diameter of the forward compressor wheel is larger than that of the engine behind it (the core). The core contains the remaining compressor wheels (the fan), the combustion chamber and the turbine wheels. A part of the air passing through the fan flows through the core and a part over it. The ratio of the air bypassing the core to the air that flows through it is called the bypass ratio (BPR). As a rule of thumb, the higher the bypass ratio the more fuel-efficient is the engine, although other details come into play as well. A turbofan whose BPR is less than 2 is considered a low-bypass-ratio engine.
Typical Fuel Consumption
Table 7-11 shows the typical specific fuel consumption of selected turbofan engines.
Step-by-step: Effect of Altitude and Airspeed on Turbofan Engine Thrust
Reference [13] also presents a method to estimate the effect of altitude and airspeed on the thrust of turbofan engines, similar to those presented above. There are generally two classes of turbofans: those with low and those with high bypass ratios. A low-bypass-ratio turbofan is one whose bypass ratio is less than 1. Low-bypass-ratio turbofans are usually intended for military applications whereas high-bypass-ratio are typically used in civilian applications. For this reason, two types of formulation are presented, one for each type.
Step 1: Calculate temperature ratio
![]() (7-21)
(7-21)
Step 2: Calculate pressure ratio
![]() (7-22)
(7-22)
Step 3a: Maximum thrust of low-bypass-ratio turbofans
Step 3b: Military thrust of low-bypass-ratio turbofans
Step 3c: High-bypass-ratio turbofans
![]() (7-36)
(7-36)
where
F = thrust at (the atmospheric) condition
FSL = thrust the engine would be producing at the power lever setting at S-L
The thrust of a generic-low-bypass ratio turbofan engine is plotted for several altitudes as a thrust ratio (i.e. as T/TSL) in Figure 7-10 using the above formulation and a TR = 1.072. The thrust of a generic high-bypass-ratio turbofan engine is also plotted for several altitudes in Figure 7-11 as a thrust ratio in using the above formulation and a TR = 1.072.


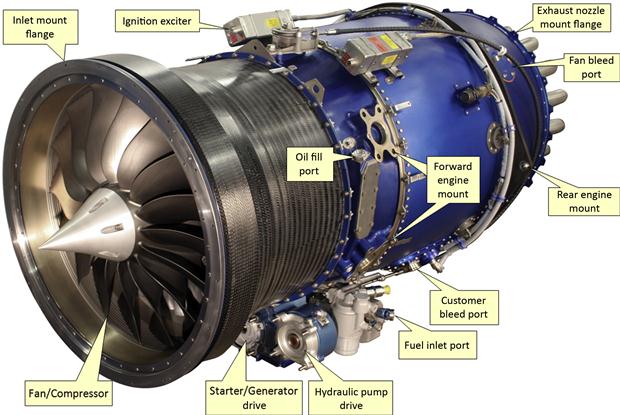
FIGURE 7-12 A Williams International FJ44 turbofan (1900–3600 lbf class). (Courtesy of Williams International, www.williams-int.com)
7.2.5 Electric Motors
Electric motors are no longer only for parasailing and ultra-lights but are quickly becoming an important trend in the light aircraft industry, particularly in light sports aircraft (LSA). Electric motors, capable of delivering power in excess of 80 HP (60 kW), are now being used to power aircraft that can carry as many as four people. At the time of writing, aircraft such as the two-seat e-Genius and the four-seat, two-hull Pipistrel Taurus G4 prototype aircraft demonstrate what the future of electric aviation beholds.
Two recent electric aircraft types are of great interest because they reveal some of the challenges of this emerging technology. The first is the two-seat Yuneec e430, acclaimed as the “world’s first commercially produced electric Aircraft” [16]. It is a two-seat, powered sailplane that has the appearance of a high-wing trainer. It has a glide ratio of 24, almost two times that of a typical avgas powered aircraft. According to product information, it has an empty weight without batteries of 377 lbf (172 kg), empty weight with batteries of 561 lbf (255 kg), and maximum T-O weight of 946 lbf (430 kg). The battery pack weighs 184 lbf (83.5 kg) and is a lithium-ion polymer (LiPo) that takes 3–4 hours to recharge at 220 V (double or triple that for 110 V) and provides about 2 hrs of flying time. The e430 stalls at 35 KCAS, cruises at 52 KTAS, and has a top speed of 80 KTAS.
The second aircraft is the Electraflyer-C (see Figure 7-13). It is a modified single-seat Monnett Moni motorglider that has been equipped with a 13.5 kW (18 hp) electric motor. Its empty weight with a battery pack is 380 lbf (172 kg) and maximum T-O weight is 625 lbf (283 kg). It cruises at 61 KTAS and has a maximum level airspeed of 78 KTAS. It can stay aloft for 1.5 hours using a 5.6 kWh LiPo battery pack. Such a pack weighs about 78 lbf (36 kg).

FIGURE 7-13 An experimental Electraflyer C (a modified Moni motor glider), powered by a 13.5 kW (18 hp) direct-drive electric motor. The photo to the right shows that the installation of electric motors is particularly clean and simple when compared to other engines. (Courtesy of www.electraflyer.com)
Two observations can be made from the above aircraft. First, both aircraft feature high-AR wings. In order for the electric aircraft to be viable, it must be more efficient than the conventional GA aircraft and require far less power for operation. For this reason, aircraft must have a higher-AR wing. Second, the weight of the battery packs is a major part of the gross weight, indicative of the low energy density of electric power when compared to fossil fuels.
Energy Density
Energy density is the amount of energy stored in a unit weight of a battery. It is denoted by EBATT and is typically given in terms of watt·hours/kg or Wh/kg for short. The energy density of even the best batteries (LiPo) is substantially lower than that of fossil fuels, about 60 times less [17], leaving electric aviation at a significant disadvantage. The energy density for typical aircraft battery packs is given in terms of kWh (kilowatt-hours). A 5.6 kWh battery can deliver 5600 W over a period of an hour. This corresponds to the energy required to keep a 100-watt light-bulb lit for 56 hours (2.3 days) or a 1500 W microwave running for 3.7 hours.
Batteries
A battery is a device that converts chemical energy into electrical energy (or the other way around). It can also be thought of as a device that allows electrical energy to be carried around. The invention, according to some, is ancient and dates back to the beginning of the Common Era, some 2000 years ago, with the so-called Parthian batteries. While this is debated, it is known that the battery in the modern form dates back to the 1800s with the invention by Alessandro Volta (1745–1827). The battery has come a long way since then and currently, spurred by growing interest in environmental protection, there is considerable research going on. Some of what is said here will possibly be obsolete in a few years time and the reader is encouraged to do their own research to ensure up-to-date information.
There are several issues that concern batteries and must be kept in mind:
(1) The energy density of current battery technology is very low compared to that of gasoline. Therefore, a lot of battery power requires a lot of battery – i.e. a lot of weight.
(2) Energy durability – shelf life. There is more to battery capability than just energy density. For instance, LiCO2 batteries have a higher initial energy density than, say, LiFePO4 batteries. However, after a year of frequent recharge-discharge cycles, the LiFePO4 battery has similar residual energy density to the LiCO2 battery. In 2 years it does better. This is battery durability.
(3) Discharge voltage depends on the remaining charge and battery temperature. The initial discharge voltage is usually high, but diminishes with the energy used. This means that initially after a battery recharge is completed, the battery appears to “contain a lot of power.” However, this drops rapidly. For aircraft this means that a fully charged battery yields a reported T-O distance, but the first touch-n-go requires a much longer runway. This is not acceptable for aircraft transporting people for commercial purposes.
The ideal battery for use in airplanes should be light, rechargeable, have a long durability, and with the highest energy density possible. The current state of technology has been largely driven by demand for laptop computers and cell phones, where bright screens and long endurance is of the essence. Batteries of the kind people are mostly familiar with, such as those used for flashlights (D, C, AA, and AAA style) or conventional car batteries, are not suitable at all, due to low energy density and high weight. The modern lithium-ion battery is a huge improvement over the batteries of the past, although it is in fact marginal. Currently, two types of batteries are suitable for use in aircraft: LiFePO4 and LiCoO2. Both have their pros and cons.
The current battery technology consists of the types of batteries listed in Table 7-12.
TABLE 7-12
| Battery type | Comment |
| Lead-acid | Best known as the car battery. Low energy option not suited for use in aircraft. |
| NiCad | Used to be popular for radio-controlled aircraft. Largely obsolete. |
| NiMH | Popular as rechargeable batteries for robots. |
| Li-Ion | Lithium-ion battery, best known as battery packs for laptop computers. |
| LiPo | Current power packages for electric aircraft. |
Fuel Cells
A fuel cell is a device that produces electricity by combining hydrogen and oxygen, forming water and heat as byproducts (see Figure 7-14). The fuel cell is superior to batteries in many ways. It has the potential of being a zero-emission device (if the electrical energy is generated using renewable energy) and it overcomes a serious drawback of chemical batteries in which voltage reduces as a function of the battery charge. For batteries, this effectively means that as its charge drains it is no longer possible to get maximum power obtained as when it was fully charged. For airplanes, this means reduced and “variable” top performance, one which depends on charge remaining. In order for electric aircraft to be truly compatible with a conventional fuel-powered aircraft, it is necessary that maximum power can be drawn regardless of the state of charge. This is not an issue with fuel cells and renders them particularly attractive for use in electric aircraft.

While there are several types of fuel cells, this text only considers those that consist of a thin membrane, called a proton exchange membrane (PEM). One side of it is exposed to pure hydrogen gas (H2) and the other to oxygen (O2). The PEM catalytically strips the electrons off the hydrogen, converting it into hydrogen ions (H+). Furthermore, it ensures the ions can only pass through it in one direction: to the side that is bathed in oxygen. The electrons that were stripped off take a different path and flow through the anode to the cathode, generating electric current in the process. At the same time, the hydrogen ions that pass through the PEM encounter oxygen and the electrons flowing through the cathode react to form H2O, completing the process.
Hybrid Electric Aircraft
The low energy density of electric motor installations has led to the introduction of engine configurations that bridge the gap between gasoline engines and electric motors through hybrid functionality. A hybrid electric aircraft is one that features a combination of electric motor and some other type of power plant. Strictly speaking, such a power plant can be any of the other types discussed in this section. However, in this text the use of the term will be limited to aircraft driven by a propeller powered by a combination of an electric motor and a piston engine or a gas turbine. In this context we further classify hybrid electric aircraft into the following types:
(1) A parallel hybrid has an electric motor and a gasoline engine connected to the same drive-train. In this way, the same propeller can be driven using either electrical or gasoline power or it can use both simultaneously.
(2) In a series hybrid the propeller is driven using the electric motor only. However, it has a gasoline engine that runs a generator that charges the battery when it runs low.
In 2011, Embry-Riddle Aeronautical University flew a modified Stemme S-10 (parallel) hybrid-powered sailplane using a Rotax 912 and an electric motor coupled to the same driveshaft – arguably the first hybrid light plane in the history of aviation. In this configuration, the airplane uses conventional piston power for T-O and climb, but once reaching cruise altitude the gasoline engine is turned off and the electric power is switched on for cruise.
The Pure Electric Aircraft
Electric propulsion has a number of advantages over propulsion that depends on fossil fuel. Among those is the very quiet operation of such engines. This is compounded using large-diameter, low-RPM propellers that also generate relatively low noise. This contrasts with noisy piston or gas turbine engines and propellers associated with conventional installations. The operation of electric motors is practically without vibration as long as the propeller is well-balanced. The other usual nuisances of gasoline engines are absent as well. There are no residues, odors, or stains associated with the operation of such motors – they are extremely clean. Additional advantages include a very simple and reliable start and operation of the motor. The motor itself is a very reliable device that requires minimal maintenance when compared to a piston engine. Tune-ups and expensive overhauls are not required. Another important consideration is pilot and passenger safety; since no fossil fuels are consumed there is no chance of carbon monoxide poisoning. Another advantage is that batteries can be recharged by simply plugging them into a household outlet and, at this time, recharging batteries is inexpensive. Electric airplanes are also environmentally friendly and don’t emit greenhouse gases, although this is offset by the fact that in many places the production of electricity releases harmful greenhouse chemicals into the environment. This holds for electricity produced by oil or coal plants. Renewable energy is of course the answer, giving the electric airplane a unique potential as an environmentally friendly transportation vehicle.
Unfortunately, the production of electricity is not the only drawback. One of the most important downsides is the storage of the energy on board an aircraft. There are primarily two ways electrical energy is provided to run the motor: via batteries or via fuel cells. At this time, both options are very heavy and a high toll must be paid in terms of reduction in useful load. In fact, as will be discussed later, an airplane really must be specifically designed to effectively use electric propulsion; it is very impractical to convert existing gasoline-powered aircraft into electric ones. One of the issues with batteries is their relatively low energy content. For longer flights this calls for a large amount of matter (i.e. mass) to be carried around, which reduces the useful load of the airplane. Fuel cells, on the other hand, require large quantities of hydrogen to be carried in highly pressurized bottles, sometimes as high as 5000–10,000 psi. In comparison, the pressure inside the combustion chamber of the Space Shuttle main engine is in the 3000 psi range. This means that if the hydrogen bottles burst, they pose a serious threat to the airplane and its occupants.
Formulation
The following expressions are helpful when solving various problems that involve electrical power.

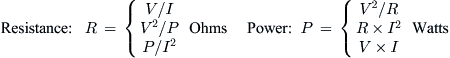
where
I = current (amps)
P = power (watts)
R = resistance (ohms)
V = voltage (volts)
EXAMPLE 7-4
Powered paragliding is currently a popular sport. Some paragliders are powered by a compact electric propeller power-pack the pilot straps to his or her back. The data below are given for one manufacturer of such power packs. Determine an equivalent horsepower rating for the electric motor. Also compute the current to the motor and its internal resistance. If the battery pack stores 30 Ah (Amp-hours) of energy, how long can the motor be run at peak force (assuming no overheating takes place and Peukert’s law is not applied)?
7.2.6 Computer code: Thrust as a Function of Altitude and Mach Number
One of the most important capabilities of the designer is the ability to predict the thrust of the selected engine as a function of altitude and airspeed. This is imperative for performance and stability and control theories. The preceding methods all lend themselves to incorporation in a function that can be called from analysis spreadsheets such as Microsoft Excel. The following function incorporates all the preceding methods and allows piston engines as well as high-bypass-ratio turbofans to be evaluated. The input arguments are thrust (F0), throttle ratio (TR), altitude (H), Mach Number (M), and deviation from ISA (deltaOAT). Note that the routine treats piston engines in a different manner than the other engines, as it assumes the there is a constant-power device.
7.3 Aircraft Power Plant Installation
The type of engines selected will largely dictate the layout of the installation. Propeller engines (pistons or turboprops) require stout bulkheads to which the engine mounts are attached. Such bulkheads are called firewalls. For practical reasons, most of the firewall is normal to the flight direction, calling for measures that reduce drag, most effectively in the shape of an aerodynamically shaped cowling. Jet engines require inlets and exhausts that ideally should be short and without excessive bends. If mounted inside the fuselage, a jet engine requires fireproofing and careful structural design in case of a rotor-burst. If outside the fuselage, bulkheads to mount the engine are still required, but trusty fireproofing is replaced by having to perforate the outside mold line (OML) of the fuselage (or wing) to route the structure, wiring, fuel, and hydraulic lines. Subsequently, this calls for an aerodynamic refinement in the form of a pylon and nacelle. In all cases, the loads generated by the thrust and inertia of the engine must be reacted by a highly reinforced structure in the region of the installation.
In this section, typical engine installations for piston and jet engines will be presented from the standpoint of impact on aesthetics, aerodynamics, and, to a limited extent, structures. While the structural design belongs to the detail design phase, the implications of a particular installation should be understood by the designer. In particular, the regulatory aspect of the installation should be pondered, but for GA aircraft these can be found under 14 CFR 23.901, Installation, which is best recited for convenience:
Note that the term ‘part’ in subparagraph (f) refers to the subpart of 14 CFR Part 23 that treats power plant, aptly called Subpart E – Powerplant. The subchapter consists of the paragraphs 23.901 through 23.1203. The designer should be familiar with those that pertain to the particular engine type being selected. Note that many of the paragraphs specifically refer to other systems that are necessary to operate the engine, such as the fuel and oil systems.
Fireproofing
On the 2nd of June 1983, a DC-9 commercial jetliner en route from Dallas/Fort Worth to Toronto, Canada, suffered a cabin fire thought to have originated behind in the aft lavatory, perhaps by a careless smoker who threw a cigarette, not yet extinguished, into a paper towel container.2 The fire spread between the outside wall of the aircraft and the inside decorative walls. The cabin filled with toxic smoke, causing it to be diverted to an alternative airport, the Greater Cincinnati International Airport, Covington, Kentucky. Once on the ground, some 60 to 90 seconds after the cabin doors were opened, fresh oxygen fueled the fire now extensively burning, although hiding under the decorative wall, causing it to quickly engulf the cabin. The fire killed 23 of the 46 occupants on board [18]. Consequently, the installation of smoke detectors and fire extinguishers as well as proper training of crew members found their way into current Federal Aviation Regulations. This tragedy serves as a reminder that in many ways the aviation regulations are written in the blood of victims; they make flying safer for the rest of us.
Fire is a real threat in all aircraft. Unlike a car, the inability to stop the vehicle on a moment’s notice makes fire in airplanes a very serious issue. Fireproofing is the addition of fire-resisting or retarding material and the installation of fire-suppression chemical dispensers to aircraft intended to make it more fire-resistant and, thus, safer in the case of such an emergency. There are three areas in an aircraft that are more susceptible to fire than others: the engine compartment, the cabin area, and anywhere electrical wiring is placed. Designing the fireproofing does not require much mathematics, but rather should demonstrate compliance with the applicable federal regulations. GA aircraft must comply with the regulation of 14 CFR Part 23:
| 23.865 – Fire protection of flight controls, engine mounts, and other flight structure, 23.1181 – Designated fire zones; regions included, 23.1182 – Nacelle areas behind firewalls, 23.1183 – Lines, fittings, and components, 23.1189 – Shutoff means, 23.1191 – Firewalls, |
23.1193 – Cowling and nacelle, 23.1195 – Fire extinguishing systems, 23.1197 – Fire extinguishing agents, 23.1199 – Extinguishing agent containers, 23.1201 – Fire extinguishing systems materials, and 23.1203 – Fire detector system. |
The Firewall
Piston and turboprop engines are typically mounted on a truss structure made from welded chrome-molybdenum steel (SAE 4130), which is then mounted to the airframe and separated from it via the firewall. Its purpose is to prevent fire from spreading beyond the engine compartment. The firewall is usually made from stainless steel or other heat-resistant material. Per 14 CFR 23.1191, some materials are exempt from fire retardation testing and these are listed below:
0.015 inch thick stainless steel sheet,
0.018 inch thick mild steel sheet (coated with aluminum or otherwise protected against corrosion)
Additionally, steel or copper base alloy firewall fittings are exempt as well. Other materials must be demonstrated to provide fire resistance – for instance, they must be subjected to a flame that is 2000 ± 150 °F for at least 15 minutes without penetration. Furthermore, the material must be protected against corrosion.
External jet engine installations also feature firewalls on the pylon, as will be discussed later.
Danger Zones Around Propeller Aircraft
Awareness of danger zones around the aircraft that stem from an engine selection is important. The following applies to both piston and turboprop engines. These introduce two kinds of danger zones: those while operating on the ground and those while while airborne. These are due to propwash, turbine exhaust (applies to turboprops only), prop strike (a person walking into the prop), and blade separation. These are depicted in Figure 7-15.
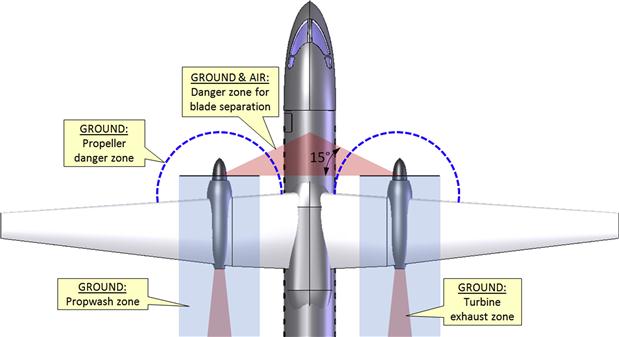
Prop wash can be dangerous if it picks up and blows heavy objects that may harm a person standing behind it. The exhaust zone contains dangerous fumes from the engine that can be harmful if inhaled and can burn a person standing close to the exhaust. Sadly, people walk into rotating propellers several times each year. Not much needs to be said about the outcome of that battle. Blades separating from propeller hubs are, fortunately, very rare, but can happen both in flight and also for reasons that may be easily overlooked. For instance, propeller blades often break off during emergency landings, when landing gear has failed to extend or lock. One of the precautions enforced in such situations in commuter aircraft is to move the passengers inside the danger zone to a different part of the airplane.
7.3.1 Piston Engine Installation
The piston engine installation must meet several requirements:
(1) Be structurally sound enough to react all loads generated by the engine.
(2) Allow for easy access for maintenance.
(3) Allow engine controls to be easily routed to and from the engine. This includes the electrical system, fuel plumbing, and engine controls (throttle, mixture, pitch control).
(4) The installation must be resistant to fire.
(5) The propeller must have a type certificate and be free of vibration.
The loads generated by the engine installation are primarily inertia loads due to gravitation and maneuvering loads and loads generated by the engine itself, such as thrust and gyroscopic moments. For GA aircraft, the loads the installation must be designed to react are stipulated in 14 CFR 23.901(b) (thrust) and 23.361, Engine torque, and 23.363, Side load on engine mount. In summary, these paragraphs state that the engine installation must react the worst of the following loads:
(1) Simultaneous application of max T-O thrust, torque, and 75% of the limit load factor (see Table 1-2 for load factors).
(2) Simultaneous application of max continuous thrust, torque, and 100% of the limit load factor.
(3) For turboprops, to account for a sudden malfunction (e.g. quick feathering), the simultaneous application of max T-O thrust, torque, and 1g load, multiplied by 1.6.
(4) For turbine engine installations, torque due to sudden engine stoppage (such as compressor jamming) or maximum acceleration of the engine.
(5) For all engine types, account for a lateral loading by multiplying engine weight by n1/3, where n1 is the limit load factor, with a minimum value of 1.33.
When determining the torque in (1) and (2), the appropriate mean torque must be multiplied by the following factors of safety:
• Turboprops multiply by 1.25.
• For piston engines with five or more cylinders, multiply by 1.33.
• For piston engines with fewer than five cylinders, multiply by (6−Ncylinder).
These loads are applied at the CG of the engine, except propeller thrust, which is applied at the hub, as is shown in Figure 7-16.
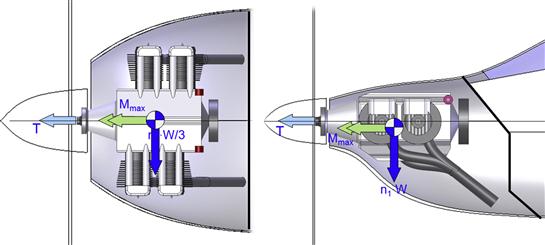
Systems Integration
Figure 7-17 shows a typical installation of a small piston engine and identifies a number of different systems required for proper operation of the engine. This means that a number of perforations have to be made through the firewall. For typical piston engine installations, provisions have to be made for the following instruments:
(3) Tachometer (RPM indicator).
(4) Manifold pressure gage (MAP – often omitted for low-powered engines).
(6) Fuel flow indicator (omitted for low-performance aircraft).
(7) Hobbs indicator (shows the number of hours on the engine).
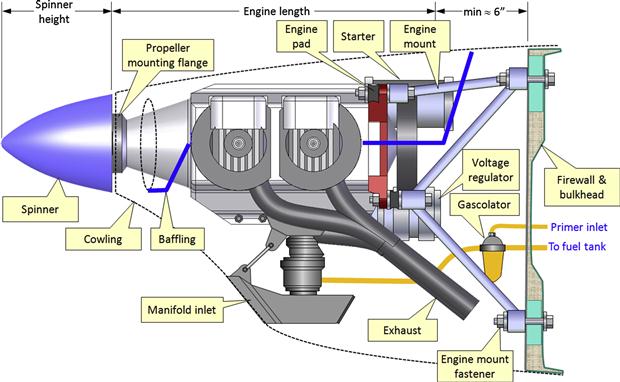
These call for electrical connectors and instruments to be mounted on either side of the firewall. Additionally, the following electrical and fuel related equipment must be accounted for:
Types of Engine Mounts
There are three common means of mounting a piston engine to the airplane. Dynafocal mounts arrange the fastener pattern such that the fasteners point toward the CG of the engine. This reduces engine vibration, but requires the engine mount and motor pads to be welded at an angle, making their fabrication harder. Conical mounts align the fasteners parallel to the crankshaft, while bed mounts align the fasteners perpendicular to the crankshaft (see Figure 7-18).
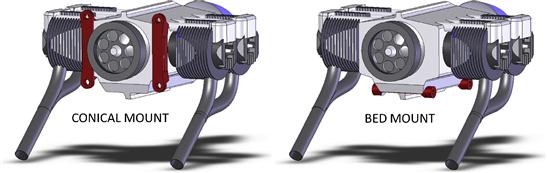
Fuel System
A typical fuel system layout for a low-wing high-performance piston-engine airplane is shown in Figure 7-19. Normally, there are two fuel tanks, one in each wing. The fuel is gravity-fed from each tank into special tanks called collector tanks. Their purpose is to ensure that maneuvering the airplane will not result in a drop in fuel pressure that might interrupt the engine operation. Float-type sensors in each tank detect remaining fuel quantity.
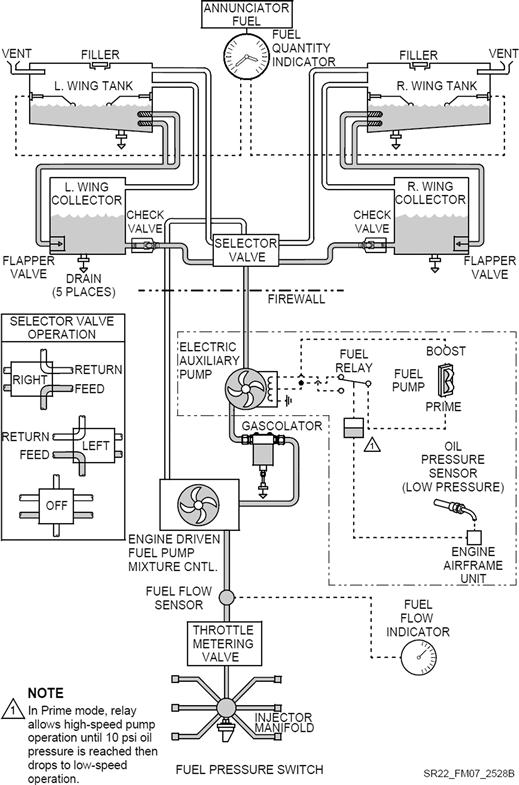
FIGURE 7-19 The fuel system for a single-piston-engine high-performance aircraft. (Courtesy of Cirrus Aircraft)
Since the collector tank is below the engine, it must be pumped to the engine’s injector manifold, where it is delivered to individual cylinders. Two fuel pumps are used for this purpose – one is driven directly by the engine and the other is electric and is used when starting the engine and during critical operations, such as T-O and landing. It is also used for vapor suppression during climb and is left on for up to 30 minutes once the plane levels off for cruise. The pumps draw fuel from the collector tank selected by the pilot. Excess fuel not used in the manifold is returned to the selected fuel tank.
The operation of the fuel system depends on proper venting. If venting were not provided, the pressure in the tank would reduce as the fuel is consumed. Eventually this would lead to decreased flow of fuel and an inevitable engine fuel starvation and stoppage. The fuel vents ensure ambient pressure is provided no matter the remaining fuel quantity. This is often done by exposing a vent line to a stagnation pressure port. This will pressurize the tank and help with suitable fuel flow.
7.3.2 Piston Engine Inlet and Exit Sizing
The size of the inlet for a piston engine is primarily based on the cooling requirements of the engine and relies on allowing air into and out of the engine compartment. The nature of this flow is very complex. Not only is the airflow highly turbulent, it is compounded by imperfect pressure recovery (i.e. how much of the dynamic pressure gets converted to stagnation pressure), heat transfer, and pressure drop as it is forced through the radiator (or cylinder cooling fins). For this reason, the designer should be realistic about the accuracy of the sizing methods presented in here; they are not accurate. However, they offer (1) a way to establish a baseline inlet and (2) an understanding of what parameters affect the cooling. The final inlet and exit dimensions will have to be polished in flight testing. Examples of typical inlets are shown in Figure 7-20.

Adequate cooling requires a steady flow of air through the engine compartment. For this reason, in addition to an inlet, an adequately sized exit must be provided to ensure a steady and continuous supply of low-temperature air through the compartment. But there also has to be a balance between the inlet and exit areas. If the exit size is smaller than the inlet, the volume of air flowing through the compartment will also be low – most of it will simply flow around the nacelle and cooling capacity will suffer. If the exit is larger than the inlet, only air that amounts to the air coming through the inlet will exit, but there may also be backflow of warm air into the engine compartment. This can cause uneven heating and even overheating in areas.
Common ways to cool engines in both tractor and pusher aircraft configurations are shown in Figure 7-21 and Figure 7-22. The cooling method introduces air through a front-facing inlet and it is then directed around the engine cylinders using thin panels called baffles. The purpose of baffles is to ensure that air entering the engine compartment flows around the exposed cylinder cooling fins by blocking other possible paths.
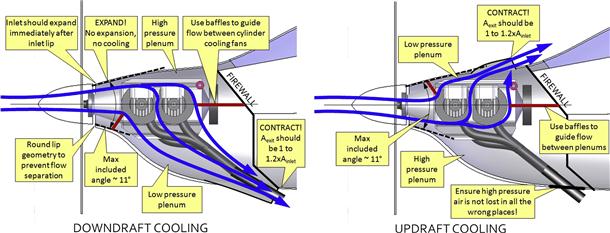
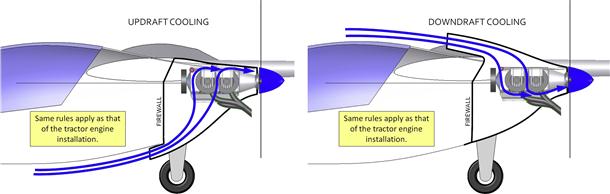
The cooling air is introduced to the engine using either what is called an updraft or a downdraft methodology. The difference between the two is displayed in Figure 7-21 and Figure 7-22. Note that there is a serious drawback to the updraft cooling method for single-engine tractor configurations. Engine failure is often accompanied by oil leaks and, considering the configuration shown, oil could easily cover the windscreen, challenging the safe operation of the aircraft. However, it may be the right configuration for multiengine aircraft with the engines in on-wing nacelles.
The cooling of pusher configurations can be problematic, as the cooling air must often be introduced through curved ducts besides having to ingest air with reduced energy. The designer should anticipate this possibility up front and consider scoop-type inlets for maximum pressure recovery.
The cooling takes place as air flows across the surface and around the fins of the cylinders or the heat exchanger (radiator). This carries away thermal energy in the thermodynamic process of convection. The greater the mass flow the greater is the cooling. Proper cooling depends on airspeed, ambient temperature, density, and engine power (power output, fuel consumption, and operating temperature).
Consider the three inlets in Figure 7-23. The top figure shows the engine without a cowling, which from a certain point of view can be regarded as the largest possible “inlet”. This inlet is way too big and results in high drag without any additional cooling effectiveness. The center inlet is tiny and would result in engine overheating because of the poor pressure recovery and momentum losses inside. The bottom inlet is of the correct (and compromised) size. It provides adequate cooling at all operating conditions and while it generates more drag than the center inlet this is acceptable because of its cooling capability.

This shows that the size of the inlet can have a wide range without impacting the cooling capability of the heat exchanger. This is because the cooling is dependent on the area of the radiator, and this does not change with the larger inlet size. A large inlet simply increases the drag of the airplane and for that reason the smallest inlet that provides adequate cooling over the operational range of the aircraft is the right one. The range is limited at the lower end by momentum losses inside the diffuser.
Note that a proper sizing of the cooling air exits should account for the presence of other heat exchangers, such as oil coolers, intercoolers, and cabin air heaters.
Method 1: Inlet-exit-dependent Heat Transfer
This method assumes that the inlet area must be equal to the exit area required to carry the engine heat away. The heat carried away by the air flowing through the engine compartment can be found from:
![]() (7-37)
(7-37)
where
![]() mass flow of air flowing through the engine compartment
mass flow of air flowing through the engine compartment
![]() specific heat of pressure for air and
specific heat of pressure for air and
ΔT = rise in temperature as it flows through the radiator or the cylinder fins
For air, the value of Cp is as follows: ![]()
The mass flow rate is given by
![]() (7-38)
(7-38)
where
This can be used to solve for AE, which then can be used as the inlet area, AI:
![]() (7-39)
(7-39)
The resulting area will be highly dependent on the selection of the exit airspeed, VE. Therefore, the engineer should evaluate area requirements during climb (low speed, full power), approach (low speed, low power), and cruise (high speed, moderate power) on hot days and use these to evaluate the area. The fact that it takes the engine some time to overheat is sometimes used to get by with smaller inlets and outlets. Some airplanes have insufficient cooling capability during climb and depend on the airplane reaching higher (and cooler) altitudes quickly so cruise can commence, where cooling is usually sufficient.
Exit Area and Cowl Flaps
Equation (7-39) shows the exit area is a function of the airspeed. When the airspeed is high, such as at cruise, the required exit area is small. When the airspeed is low, a larger area is required. It is to be expected that a small area that generates relatively low cooling drag at cruise may lead to cooling problems at lower airspeeds, such as before landing. This makes it tricky to determine an area that works for both conditions. Sometimes this is impossible to accomplish and potential for over-heating must be solved using a so-called cowl-flap, a mechanical device that is used to adjust the exit area on a need-to basis.
Many high-performance piston-engine aircraft feature such flaps. Normally, the cowl-flap is open for low-speed operations (T-O, climb, landing) and closed during cruise. Cowl-flaps are also useful when operating the engine in very cold climate, when over-cooling the engine is a realistic possibility. In such conditions the cowl flap is kept closed, ensuring the engine runs at ideal cylinder-head temperature.
EXAMPLE 7-5
The installation manual for a Rotax 912 four-stroke aircraft piston engine recommends a radiator capable of transferring thermal energy that amounts to 28 kW. If air warms up by 50 K as it flows through the radiator, size the exit area as a function of the airspeed through it in m/s. How large must the exit area be for a cruising speed of 50 m/s and during climb at 30 m/s?
Method 2: Inlet-radiator-exit Method
McCormick [19] presents the following method, derived from recommendations by Lycoming for estimating cooling drag for piston engines. The method is also helpful when sizing their inlet and exit area as well. Its primary drawback is that it requires data from the engine manufacturer, which, unfortunately are not always available. The piston engine (or a heat exchanger, such as a radiator) can be analyzed based on the idealized configuration shown in Figure 7-24.

The method idealizes the engine by considering it as a system of inlet-radiator-exit. Then, it is assumed that adiabatic compression and expansion of air takes place inside the inlet and exit, shown in Figure 7-25, which themselves are idealized as a diffuser and nozzle, respectively.

FIGURE 7-25 Changes in speed and pressure as air flows through engine installation (drop and rise in airspeed and pressure are not to scale).
The method assumes that air entering the diffuser will slow down gradually to a minimum value at the forward face of the radiator. The effectiveness of the cooling requires a pressure differential to exist across the radiator (i.e. between its forward and aft faces). This pressure differential is referred to as a “pressure drop” and is imperative as it forces air to flow through the radiator and carry away thermal energy. The process can be improved by greater slowing of air in the inlet, i.e. by a greater recovery of the far-field dynamic pressure. A common pressure recovery in airplane piston engine cowling inlets is of the order of 60–80%, based on airspeed. For carefully designed scoops, it can be as large as 80–90% depending on airspeed.
Figure 7-26 shows the model with the flow properties identified at each important station. The flow conditions can be estimated to the front face of the radiator using the flow conditions upstream, assuming an adiabatic compression. Similarly, it is possible to estimate the conditions up to the aft face of the radiator using the downstream conditions, assuming an adiabatic expansion. It remains to tie the two together, something that requires the change across the radiator to be known (information the engine manufacturer should be able to provide). The temperature and pressure in an adiabatic compression or expansion can be estimated using the isentropic flow relations:
![]() (7-40)
(7-40)
where
p and p0 = pressure at condition and reference, respectively
T and T0 = temperature at condition and reference, respectively
k = pressure recovery coefficient (1 = complete recovery, 0.5 = 50% recovery, etc.)
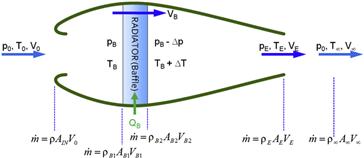
The factor k indicates how much of the dynamic pressure is preserved as the speed of the airflow is slowed down and is an indicator of the efficiency of the diffuser. If k = 0, there is no recovery and the total pressure remains that of the ambient pressure in the far-field. If k = 1, there is 100% recovery and all the dynamic pressure is converted into total air pressure without any losses. This is generally highly desirable.
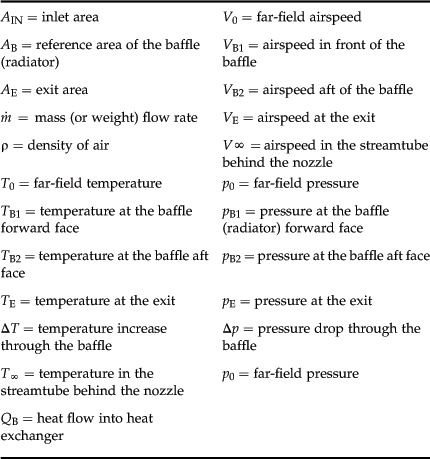
With the pressure known, the airspeed at condition can be determined using the compressible Bernoulli equation:
![]() (7-41)
(7-41)
Determining the pressure drop through the radiator is not a simple task. Usually this is done by empirical methods (read as trial and error). However, the pressure drop across baffle depends on:
![]() (7-42)
(7-42)
where
![]() (7-43)
(7-43)
This implies that the drop in pressure is related to the mass flow rate and density as described by the following relationship, which is derived by inserting Equation (7-43) into (7-42):
![]() (7-44)
(7-44)
EXAMPLE 7-6
A piston engine is being operated at 10,000 ft and airspeed of 185 KTAS where it delivers 230 BHP. OAT is 30 °F above standard temperature. The manufacturer recommends a constant cylinder-head temperature (CHT) of 450 °F for maximum engine life. Size the inlet and exit area assuming 75% pressure recovery at the radiator and that air temperature rises by 150 °F across the cylinders. Estimate how much engine power is lost to cooling.
Solution
This problem assumes a typical piston engine installation to estimate the required exit area based on hypothetical flight condition. The pressure drop through the baffle is based on experimental measurements, and ultimately requires pressure, temperature, and airspeed to be evaluated at four stations through the inlet, radiator, and nozzle. These are denoted as stations 0, B1, B2, and E in Figure 7-27. Also, note that the problem was solved using a calculator with double-floating-point accuracy. Therefore, following along with a calculator and rounding off will yield slightly different numbers in the third or fourth significant digit.
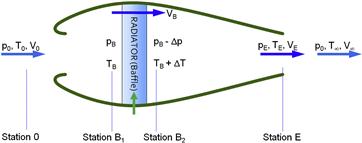
Step 1: Determine Conditions at Station 0
Calculate the far-field temperature using the information given in the problem:
![]()
Calculate pressure at altitude using the hydrostatic gas equation:
![]()
Calculate density using the ideal gas equation:
![]()
Airspeed: ![]()
We have thus completely defined p, T, and V in the far-field (station 0).
Step 2: Determine Conditions at Station B1
Determine the temperature at the radiator front face using the adiabatic gas relation, assuming that adiabatic expansion takes place inside the diffuser. This allows us to determine the flow characteristics at the forward face based on the flight conditions already determined at station 0 using the adiabatic relations of Equation (7-40). Therefore, the temperature at the baffle is:
![]()
Where k is the pressure recovery factor. With that said, let’s calculate the dynamic pressure in the far-field to evaluate the impact of the pressure recovery:
![]()
Inserting values (where k = 0.75 for 75% pressure recovery):
![]()
This corresponds to approximately 59.4 °F. Pressure at the baffle assuming 75% pressure recovery:
![]()
Calculate density using the ideal gas equation:
![]()
The airspeed at the baffle can now be calculated from the compressible Bernoulli equation:
![]()
We have thus completely defined p, T, and V in the far-field (station B1).
Step 3: Determine Conditions at Station B2
This step relies on information that must be obtained from the engine manufacturer and this typically consists of two graphs similar to the ones shown in Figure 7-28. It is used to determine the conditions on the downstream side of the radiator. Since the temperature and pressure on the upstream side of the radiator have been determined (Step 2), the pressure altitude must be determined because the graphs of Figure 7-28 depend on this value. The pressure altitude this corresponds to can be estimated using Equation (16-8):
![]()
Next, determine the pressure loss through the baffle using the left graph of Figure 7-28. Locate 59.4 °F on the horizontal axis and move along Arrow ![]() to the isobar designated for a CHT = 450 °F. Then move along Arrow
to the isobar designated for a CHT = 450 °F. Then move along Arrow ![]() to read approximately 2.7 lbf/s of required cooling airflow at this condition. This means that 2.7 lbf of air must flow through the radiator every second to adequately cool the engine. Then, extend the arrow to locate 8947 ft on the right graph (between the 5000 and 10,000 ft curves). Finally, follow Arrow
to read approximately 2.7 lbf/s of required cooling airflow at this condition. This means that 2.7 lbf of air must flow through the radiator every second to adequately cool the engine. Then, extend the arrow to locate 8947 ft on the right graph (between the 5000 and 10,000 ft curves). Finally, follow Arrow ![]() to locate 35 lbf/ft² as the pressure drop across the radiator.
to locate 35 lbf/ft² as the pressure drop across the radiator.

FIGURE 7-28 Special graphs supplied by the engine manufacturer are used to extract the required cooling airflow for the engine. The graphs do not represent any particular engine type.
Required cooling airflow:
![]()
Resulting pressure drop:
![]()
Pressure downstream of the baffle:
![]()
Temperature (+150 °F) rise downstream of the baffle:
![]()
It is assumed the speed of air is near zero as it exits the aft face of the radiator. This is based on the speed already being accounted for in the value of the pressure loss, which was empirically determined (by the engine manufacturer). Therefore we say that VB2 = 0 ft/s and, thus, claim we have completely defined p, T, and V in the far-field (station B1).
Step 4: Determine Conditions at Station E
We will determine some properties at the exit assuming an adiabatic expansion. This will require us to know an additional property at the downstream face of the baffle, namely the density:
![]()
The pressure at the exit is assumed to be the atmospheric pressure in the far-field. The reader should be aware that this is not necessarily true. The pressure depends also on whether or not there is flow separation occurring at the exit, which would lower the pressure and affect our results. However, this is a reasonable first stab assumption as long as we are cognizant of its limitations and until we are able to actually measure it:
![]()
The density at the exit can be found from the adiabatic relation:
![]()
And the airspeed at the exit can be found using the compressible Bernoulli equation:
![]()
Inserting the variables in this example leads to:
![]()
Assuming speed VB2 through the baffle to be small:
![]()
The airspeed at the exit comes to:
![]()
Temperature at the exit:
![]()
Now we have enough information to size the inlet area:
![]()
And the outlet area:
![]()
An area corresponding to about 5 × 5 inches² will suffice for an inlet and 6 × 6 inches² for the exit at this airspeed. It can be seen that this particular flight condition will not dictate the final size of the inlet or exit and other flight conditions, in particular ones involving low airspeed, must be evaluated in this fashion as well. The results are shown graphically in Figure 7-29.

In this example it is assumed air temperature rises by 150 °F across the cylinders. Let’s see how much power this corresponds to (Cp units are ft/lbf/slug/°R):
![]()
In horsepower:
![]()
This is about 57% of the engine power. Generally, this value should range between 40% and 50% (per Ref. 19), but here it is actually based on graphs that are simple examples that do not represent an actual engine type.
7.3.3 Installation of Gas Turbines
Due to the complexity of gas turbine installation, many design details are accomplished with direct help from the engine manufacturer. Polishing the inlet and exhaust design, fuel system layout, and bleed air and other systems requires expertise and experience only they wield. The following discussion should therefore only be considered introductory.
The relatively small diameter of gas turbines allows them to be mounted on the aft fuselage or on pylons on the fuselage or wings in a podded configuration. However, they are also buried inside the wing or in the fuselage. There are usually good reasons to justify each type of installation, but the buried installation poses more serious challenges in the case of a fire. A fire in a podded engine is likely to burn itself out without causing damage to the engine mounts or the nearby airframe. A buried engine, on the other hand, may present serious risks to the surrounding airframe and, thus, requires reliable fireproofing. Even for small aircraft the fireproofing can weigh in excess of 100 lbf, something easy to overlook during the design phase, but can easily shorten range by 50 to 200 nautical miles (nm).
Installation of Jet Engines
Installation of jet engines must comply with largely the same requirements as piston engines, with some exceptions. Jet engines are installed either internally (inside a fuselage) or externally (on a pylon). However, in either case, identical connectors and lines are required. Figure 7-30 shows a schematic of a typical jet engine installation. Internal and external engine installations are also equipped with fire-suppressant systems, which increase the weight further. Additionally, if the aircraft is to be certified for flight into known icing (FIKI), the leading edge of the inlet (usually called inlet lip) must feature anti-ice capability, compounding the complexity.

Installation of Turboprop Engines
Turboprops typically follow a similar process to the piston engine. They are substantially lighter and, while longer than piston engines of comparable power, their girth (diameter) is more compact. For instance, the 400 BHP Lycoming IO-720 weighs about 600 lbf, whereas the 600–1100 SHP Pratt & Whitney Canada PT6 weighs about 350–400 lbf. For this reason, if a piston engine is to be replaced with a turboprop, the installation will require the propeller to be mounted farther forward, giving the airplane a very distinct appearance. Consequently, all forces acting on the propeller result in higher moments, which call for greater control surface authority to react.
Turbo Machinery and Rotor-burst
The compressor and turbine in a typical gas turbine rotate at very high rates when compared to a piston engine. The typical gas turbine rotates at 20–40 thousand RPM. This means the compressor or turbine blades react a substantial centripetal force and, if one breaks off, two things will happen:
(1) The fragments turn into lethal projectiles and can cut through a stout structure like a hot knife through butter (except a tad faster).
(2) The support structure will have to react substantial oscillatory loading due to the imbalanced compressor or turbine rotors. Albeit rare, such events happen from time to time in aircraft and are called rotor-bursts.
It is an extremely dangerous event that must be accounted for in the detail design of the airplane.
7.3.4 Jet Engine Inlet Sizing
Since this book is aimed at GA aircraft design, only subsonic inlets will be presented. Subsonic inlets are generally relatively short compared to their supersonic counterparts and their geometry is that of a diffuser (the cross-section at the inlet lip is smaller than at the front face of the compressor). The purpose of the inlet is to allow air to be brought smoothly to the compressor and to slow its speed to bring up the pressure inside the inlet. At rest, the inlet is designed to allow the required mass flow of air to enter the engine to ensure the maximum rated thrust can be generated. In flight, the inlet is designed to slow air from the far-field airspeed to the most efficient inlet airspeed for the selected jet engine. For instance, a jet aircraft cruising at a high subsonic Mach number (around Mach 0.8 or so) may require the inlet airspeed to be slowed down to the Mach 0.4 to 0.5 range at the front of the compressor.
It is paramount that pressure losses are kept to a minimum in the inlet because of the magnifying effect of the compressor. The pressure in the combustor is reduced by an amount that corresponds to the inlet pressure loss multiplied by the compressor pressure ratio. Thus, a pressure drop of 1 psia in the inlet can cause up to a 25 psia drop in the combustor [20, p. 209].
Losses can stem from several sources, external and internal. For instance, the formation of shocks outside the inlet can affect the total pressure upstream, in addition to increasing the aerodynamic drag of the engine. This can happen at high subsonic airspeeds if the nacelle has a sharp leading edge or when air flows through too narrow a gap between the fuselage and nacelle on a podded engine configuration. Flow inside the inlet can experience unfavorable pressure gradients that can cause flow separation on the inside walls, which can have the following effects:
(1) Flow no longer slows down isentropically, which leads to lower total pressure inside the inlet.
(2) The separated region along the inside wall narrows the effective cross-sectional area, which leads to higher than desired airspeed (and thus lower total pressure) at the front face of the compressor.
(3) The separated flow is inherently unstable and looses “smoothness” as it enters the compressor, reducing its efficiency and stability of operation.
Inlet Types for Jet Engines
Two types of installation methodologies are used for jet engines; external and internal (see Figure 7-31). The external inlet is also called a pitot inlet. For internal inlets, there are predominantly two main subtypes: the NACA inlet and the bifurcated inlet. These inlets have the following pros and cons.
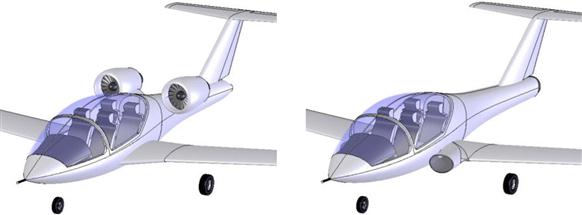
FIGURE 7-31 An external (left) and integrated (right) jet engine installation. The external one is also called a pitot inlet. The integrated inlet is of a bifurcated type.
From an operational standpoint, the external (or pitot) inlet offers great pressure recovery for the entire range of AOA and AOY the aircraft is likely to see in practice. It is easier to access for maintenance and engine removal and replacement. However, it also generates more aerodynamic drag due to the nacelle and pylon.
The internal bifurcated inlet is a good solution for single-engine installations, allowing the engine to be placed behind the cabin and be positioned so thrust effects on stability and control are minimized. This tends to result in less aerodynamic drag since the engine installation adds much less wetted area than the external one. Of course placing the fuselage in front of the inlet will cause boundary layer growth to be ingested, unless steps are taken to avoid it, such as the use of boundary layer diverters. This can be problematic if the airplane yaws and separated air enters the inlet on one side. Other problems are pressure losses due to bending of the internal inlet, as well as problematic ice accretion that may occur on the forward-facing curves of the inlet, which requires anti-ice remedies for aircraft certified for FIKI.
The internal NACA inlet generates even less aerodynamic drag than the bifurcated inlet and can be the right solution for specific single-engine installations. It more often sees use as a generic low-drag inlet for engine or component cooling than as a jet engine inlet, because it suffers from much greater pressure losses than its bifurcated counterpart. Since turbofan engines are more sensitive to inlet pressure losses, it can be argued that the NACA inlet is better suited for turbojet applications and should be avoided for turbofans.
The Diffuser Inlet
The process of slowing air down with minimal losses in pressure recovery is most effectively accomplished using adiabatic expansion. As stated earlier, this is imperative, as any reduction in the total pressure at the front face of the compressor will lead to reduced thrust. The most efficient inlet geometry for this purpose is the diffuser (see Figure 7-32). A diffuser has a capture area slightly smaller than the compressor disc area.

FIGURE 7-32 A typical external jet engine installation features an inlet designed to slow airspeed from the far-field airspeed to some target airspeed.
The airspeed of an airplane has a profound effect on the nature of how a jet engine ingests air. Two extremes are shown in Figure 7-33. At rest, the jet engine will effectively ingest air from around and in front of the inlet, a very important fact for technicians to keep in mind while working on the ground near such machines. The inflow can be tremendously powerful and, sadly, every year an unfortunate mishap takes place in which a person is sucked into a large jet engine with fatal consequences. It also shows the engine can easily draw in FOD off the ground and sustain considerable damage.

As the speed of the airplane increases, the streamlines shown in the upper diagram become more and more aligned with the engine axis and begin to form a distinct streamtube. A distinct streamtube means that only air inside this volume will be ingested by the engine. The lower diagram of Figure 7-33 shows this at cruising speed, during which much more air than required by the engine is available.
While the design of the inlet is best implemented with the participation of the engine manufacturer, the airframe designer may want to perform preliminary sizing of the inlet to expedite the layout of the airplane. The following Step-by-step is provided for that purpose. Note that Flack [20]; Seddon and Goldsmith [21]; and Mattingly [14] provide good guidance for the general inlet design and should be referenced as well.
The inlet design involves a number of important geometric parameters to be considered. For analysis reasons, three stations of interest have been superimposed on the engines of Figure 7-33, denoted by ![]() ,
, ![]() , and
, and ![]() . The inlet sizing requires the flow conditions and geometry to be known at each station and these are pressure, density, temperature, airspeed, and cross-sectional area. Station
. The inlet sizing requires the flow conditions and geometry to be known at each station and these are pressure, density, temperature, airspeed, and cross-sectional area. Station ![]() represents the far-field. In this way, at rest, the far-field area is infinite in size and the Mach number is thus assumed zero. However, at cruise, the area in the far-field is substantially smaller and is less than the area at the inlet lip, denoted by
represents the far-field. In this way, at rest, the far-field area is infinite in size and the Mach number is thus assumed zero. However, at cruise, the area in the far-field is substantially smaller and is less than the area at the inlet lip, denoted by ![]() . Generally, the following procedure can be used to determine the inlet lip geometry.
. Generally, the following procedure can be used to determine the inlet lip geometry.
Step 1: Required Mass Flow Rate
Obtain the maximum mass flow rate required by the engine and call it ![]() . This information is usually provided by the engine manufacturer and is usually dictated by the engine performance at static T-O thrust, making it the critical flight condition for the design. This contrasts with the cruise condition, in which the airspeed is so high that the inlet stream tube necks down in the far-field as shown in Figure 7-33, indicating plenty of air can enter the engine. The remaining steps assume this to be the case.
. This information is usually provided by the engine manufacturer and is usually dictated by the engine performance at static T-O thrust, making it the critical flight condition for the design. This contrasts with the cruise condition, in which the airspeed is so high that the inlet stream tube necks down in the far-field as shown in Figure 7-33, indicating plenty of air can enter the engine. The remaining steps assume this to be the case.
Step 2: Determine Airspeed Limitations at the Inlet Lip and Compressor
Generally, the airspeed at the inlet lip (station ![]() ) should not exceed Mach 0.8. Similarly, the airspeed at the front face of the compressor (station
) should not exceed Mach 0.8. Similarly, the airspeed at the front face of the compressor (station ![]() ) is limited to Mach 0.4 to 0.5 and is ultimately specified by the engine manufacturer. This is intended to prevent the airspeed at the tip of the fan becoming too high, resulting in decreased efficiency.
) is limited to Mach 0.4 to 0.5 and is ultimately specified by the engine manufacturer. This is intended to prevent the airspeed at the tip of the fan becoming too high, resulting in decreased efficiency.
Step 3: Establish Known and Unknown Flow Conditions
The knowns and unknowns can be established in a format similar to the one shown below. Question marks indicate the parameter is initially unknown. Recall that the total pressure is the sum of the ambient and dynamic pressures. Thus, if the engine is moving at some airspeed V, the total pressure is given by ![]() . However, as stated above, for this particular condition the engine is assumed to be at rest, so
. However, as stated above, for this particular condition the engine is assumed to be at rest, so ![]() . For this reason, the total pressure in the far-field is simply the ambient pressure.
. For this reason, the total pressure in the far-field is simply the ambient pressure.
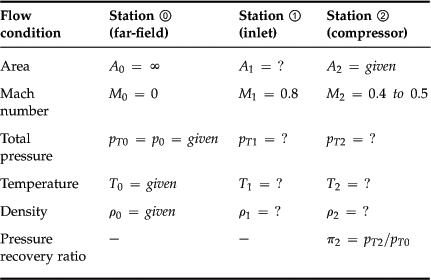
Step 4: Determine Conditions at Station 
Even though the airspeed in the far-field is zero as the engine spools up to T-O thrust, air can easily accelerate to very high airspeeds at the inlet lip. Normally, the inlet lip area is sized so the airspeed does not exceed Mach 0.8. If it is assumed that isentropic flow relations hold between stations ![]() and
and ![]() and that the ratio of specific heats of air is γ = 1.4, it is possible to determine the flow variables PT, T, and ρ, to be determined as follows (using M1 = 0.8):
and that the ratio of specific heats of air is γ = 1.4, it is possible to determine the flow variables PT, T, and ρ, to be determined as follows (using M1 = 0.8):
Step 5: Determine Conditions at Station 
Assuming the airspeed (M2) at the front face of the compressor to be in the Mach 0.4 to 0.5 range, the remaining parameters are again determined using isentropic flow relations between stations ![]() and
and ![]() :
:
Again, it is important to remember that the above equations reflect the assumption the engine is at rest.
Pressure Recovery
For perfect inlets, the pressure recovery ratio, π2, is 1. This will yield the maximum thrust for a given flight condition. Short inlets common to podded jet engines of the type shown in Figure 7-33 usually have π2 close to 1. Integrated inlets (see below) have π2 values that are often well below 1.
Inlet Lip Radius
It is imperative that the lip radius is carefully designed. A small radius can cause flow separation at high AOA or AOY. A large lip radius tends to reduce pressure distortion at high AOA or AOY and it also results in higher nacelle drag. A pressure distortion is localized deviation of the expected average pressure at the front face of the compressor, usually as less than the average pressure. This is very undesirable as it may cause oscillation in the airloads of the fan blades. Practical lip radii for subsonic aircraft range from about 6% to 10% of the inlet diameter.
Diffuser Length
The length of the diffuser is of great importance as well. A schematic of a pitot inlet is shown in Figure 7-34. The parameters of importance are the included angle, θ, the diffuser length, L, and the inlet lip diameter, D1. The ratio L/D1 is called the inlet aspect ratio. For a given aspect ratio, L/D1, too large an included angle θ indicates the diffuser is expanding too rapidly. This promotes detrimental flow separation on the inside wall. Conversely, for a given θ, too long a diffuser also promotes flow separation. The phenomenon is detailed by Schlichting [22, pp. 222–224], who demonstrates that no matter the included angle, if the diffuser length exceeds a certain distance, separation is inevitable. Additionally, such a diffuser is bound to have a larger nacelle wetted area and, therefore, increases the aerodynamic drag of the installation in addition to being heavier. There is also a range of dimensions for which the formation of the flow separation is transitory; i.e. flow separation may fluctuate. The result may be compressor blade flutter and onset of early fatigue due to oscillatory loading of the blades.

As indicated by Flack [20], the optimum pressure difference between stations ![]() and
and ![]() should comply with:
should comply with:
The pressure between the stations must be allowed to rise over a suitable distance and this usually requires more sophisticated analysis methods that can account for the intricacies of the desired geometry. However, in the absence of such schemes, a convenient empirical method for simple diffusers is provided by Flack [20] to evaluate whether the geometry will be prone to separation. Separation is unlikely if the included angle θ is less than the minimum value obtained from the following expression:
Conversely, separation is all but guaranteed if the included angle θ is greater than the maximum value obtained from the expression:
![]() (7-54)
(7-54)
where θ is in degrees. In between the two values is the transitory separation, in which there may or may not be separation. The trends based on this formulation are plotted in Figure 7-35. As an example consider an inlet with an aspect ratio of 3. The graph shows that keeping the included angle less than 15° will prevent flow separation inside the inlet.
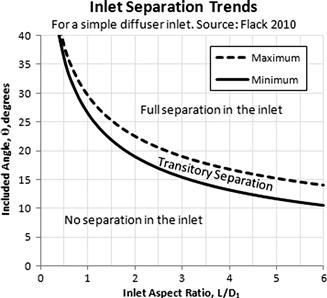
Stagger or Rake Angle
Stagger refers to lip geometry in which the upper lip is forward of the lower one (see Figure 7-32). The arrangement improves flow quality at higher AOAs, by reducing the airspeed at the lower lip and, thus, reduces tendency for flow separation [21]. Staggering is usually very modest in subsonic aircraft and ranges from 0° to perhaps 5°.
Derivation of Equation (7-48)
Of the set of equations, only Equation (7-48) needs to be derived. First, the required mass flow rate is given by:
![]() (i)
(i)
The airspeed, V1, is Mach number multiplied by the speed of sound, i.e. V1 = M1·a, where a is the speed of sound at the inlet lip. The speed of sound can be calculated from the ideal gas expression:
![]()
Inserting this into Equation (i) and expanding and subsequently solving for the inlet area yields:
![]()
QED
7.4 Special Topics
This section introduces several topics related to engine power that are of interest to the aircraft designer.
7.4.1 The Use of Gearboxes
Aircraft engines are designed to deliver maximum power at a relatively low RPM, when compared to car or snowmobile engines. For instance, Continental and Lycoming aircraft engines deliver their maximum power at approximately 2700–2800 RPM, whereas a car engine may deliver this at 5000–6000 RPM. Many airplane designers, in particular those designing homebuilt aircraft, often adapt automobile engines to their designs. These engines rotate at a very high rate so if connected directly to the selected propeller its tip speed would be supersonic, with the associated noise and propulsive losses. For this reason gearboxes are attached to such engines to bring down the rotation rate. Turboprops usually rotate at some 20,000–40,000 RPM so a gearbox is a standard part of the engine unit.
Attaching a gearbox to an engine will reduce the power delivered slightly due to its internal friction. However, in the following discussion it is assumed such losses are negligible. Consider the gears of Figure 7-36. The radius of gearwheel 1 is R1 and that of gearwheel 2 is R2. Assume gearwheel 1 rotates at a constant rate Ω1 and delivers torque T1. Then the following holds for gearwheel 2, where V1 and V2 are the linear speeds of a point on the perimeter of the wheels.
![]() (7-55)
(7-55)
![]() (7-56)
(7-56)
![]() (7-57)
(7-57)
![]() (7-58)
(7-58)

FIGURE 7-36 A schematic of a gearbox. R1 is the gear wheel connected to the crankshaft. R2 is the gear wheel connected to the output axle, e.g. the propeller axis.
From which we see that the gearwheels will change the RPM and Torque, but power remains unchanged.
EXAMPLE 7-7
A four-cylinder Rotax 912ULS engine is capable of generating some 100 BHP of power at 5800 RPM. If fitted with a 2.43:1 reduction drive, determine the reduced RPM and horsepower.
Solution
Rotation rate after gear reduction: ![]()
From Equation (7-58), horsepower after the reduction drive is the same as before, or 100 BHP.
7.4.2 Step-by-step: Extracting Piston Power from Engine Performance Charts
Manufacturers of piston engines usually provide aircraft designers with engine performance charts similar to the one in Figure 7-37. Such charts are used to extract BHP for an engine based on its RPM and manifold pressure (MAP), which are parameters obtained from easily visible instruments in most piston-engine aircraft. Then, further corrections are made by accounting for the outside air temperature (OAT) at the condition. Note that the MAP is usually given in terms of inches mercury (in Hg).
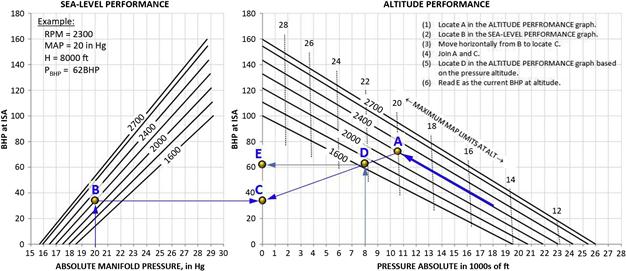
FIGURE 7-37 An example of a piston-engine performance chart for a typical certified 160 BHP aircraft engine. The chart is used to extract PBHP for an engine based on its RPM and manifold pressure (MAP). See text for details of how to read the chart.
Such charts are read as explained below. It is easier to follow by example, so consider the performance chart in Figure 7-37 and assume the engine is being operated at 8000 ft at 2300 RPM and MAP of 20 inHg. Then the following steps are performed:
Step 1: Locate A in the altitude performance section of the graph by moving along the curve that indicates 2300 RPM.
Step 2: Locate B in the sea level performance graph.
Step 3: Move horizontally from B to locate C.
Step 4: Join A and C.
Step 5: Locate D in the ALTITUDE PERFORMANCE graph based on the pressure altitude.
Step 6: Read E as the current BHP at altitude.
Step 7: Correct for temperature deviation using Equation (7-20):
![]()
where
7.4.3 Extracting Piston Power Using the Petty Equation
The extraction of engine power from the engine performance chart is a rather cumbersome and time-consuming effort. It is clear from Section 7.4.2, Step-by-step: Extracting piston power from engine performance charts, that reading such charts is not a suitable approach for analyses conducive to iteration. An analytical equation has been developed by Dr. James S. Petty of the US Air Force Wright Aeronautical Laboratories (AFWAL), which converts the performance chart into a handy equation that is easy to implement in a spreadsheet or a computer code. This equation is recognized as the Petty equation.
![]() (7-59)
(7-59)
where
PBHP = horsepower at condition (specified MAP, RPM, and altitude)
PBHP max = maximum S-L horsepower as a function of RPM (typically a polynomial)
PFHP = friction horsepower as a function of RPM (typically a polynomial – PFHP = PBHP at MAP = 0)
MAP = manifold pressure in inches Hg
MAPmax = maximum manifold pressure as a function of RPM (typically a polynomial)
Rm = manifold pressure ratio = MAP/MAPmax
Rf = friction horsepower ratio = |PFHP|/PBHP max (always a positive value)
The equation is a very valuable tool at the disposal of the designer of piston-powered aircraft as it effectively allows the power of a piston engine to be modeled using a spreadsheet or other computer software. It is priceless and more than worth the effort of setting it up. The primary drawback in its use is the preparation of the two polynomials, for the PBHP max and PFHP. These must be determined using the original performance chart obtained from the engine manufacturer. Both are a function of RPM and can be determined as follows.
Determination of the Polynomials Describing PBHP max and PFHP
Consider the engine performance chart of Figure 7-37, in particular the sea level performance side. The trick to creating these polynomials is to tabulate the endpoints and then fit a curve to these (see Table 7-13). For instance, consider the generation of the polynomial for the values of PBHP max. Column ![]() contains the selected RPM values. Column
contains the selected RPM values. Column ![]() contains the corresponding values of PBHP max, which have been obtained by extending all the curves to a MAP of 29.
contains the corresponding values of PBHP max, which have been obtained by extending all the curves to a MAP of 29.
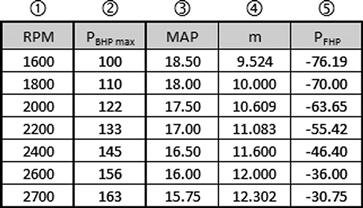
The next three columns pertain to the determination of PFHP. The easiest way to determine the values of PFHP is to read the value of the MAP for PBHP = 0, and then use the equation of a line to determine the values of PFHP when MAP = 0. These values can be seen in column ![]() . Column
. Column ![]() contains the slope of the lines calculated from:
contains the slope of the lines calculated from:
![]()
Then, the PFHP, which is contained in column ![]() , can be calculated as follows:
, can be calculated as follows:
![]()
The points from Table 7-13 have been plotted in Figure 7-38. Then, it is an easy task to determine the best fit curve. Here, an equation of a line turned out to provide an acceptable fit, but this is not guaranteed. Commonly one must resort to quadratic and even cubic polynomials.
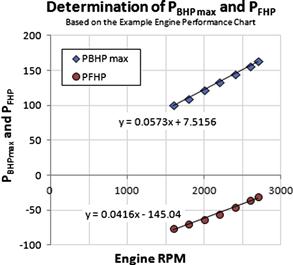
Derivation of Equation (7-59)
Consider the simplified performance chart in Figure 7-39, on which only a single RPM is shown. The sea level curve, in the sea level performance side, extends from a negative friction power (PFHP), which is the norm at MAP = 0, to a maximum power, PBHP max, at the maximum manifold pressure, MAPmax. The representative PBHP versus Altitude curve is shown in the altitude performance side. It depends on σ and extends from the S-L PBHP value to where MAP can no longer be maintained. The locus of these limit points results in a specific PBHP versus Altitude curve for each RPM, starting at σ = 1 to σ = 0.117.
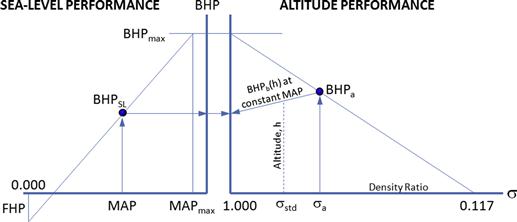
The sea level performance curve can be easily represented using the following parametric expression (noting that the MAP axis extends from 0 to MAPmax so the parameter can be defined as ![]() ):
):
![]() (i)
(i)
Then, define the ratio ![]() . Then, rewrite Equation (i) and insert this definition and simplify.
. Then, rewrite Equation (i) and insert this definition and simplify.

Note that in order to prevent sign errors from occurring, the ratio Rf will from hereon be considered positive. However, since PFHP is always negative, the above result is rewritten as follows, as this will preserve the sign:
![]() (ii)
(ii)
The altitude performance curve is based on the Gagg and Ferrar piston engine power correction of Equation (7-16), here repeated for convenience.
![]() (iii)
(iii)
where the subscript “a” indicates this is taken from the altitude side. The manifold pressure for each RPM varies linearly with the pressure ratio and, thus using Equation (16-6), can be written as follows:
![]() (iv)
(iv)
Or, conversely:
![]() (v)
(v)
Then, substitute Equation (v) into Equation (iii) to yield:
![]() (vi)
(vi)
PBHP a is the power corrected for altitude effects only and this remains to be adjusted to standard day and corrected for temperature at the flight altitude, h. The adjustment takes place by locating the uncorrected power, denoted by PBHP b, along the constant manifold pressure line on the altitude side of the performance chart using the equation:
![]() (vii)
(vii)
where
Inserting this into Equation (vii) yields:
![]() (viii)
(viii)
Further algebraic manipulations:
![]() (ix)
(ix)
The uncorrected power must then be corrected for temperature and this is done using Equation (7-20):
![]() (x)
(x)
And this is the power that one would used in performance calculations. Combining Equations (ii), (iii), (v), and (ix) with (x) leads to the following expression:

Further simplification yields:
 (xi)
(xi)
This is the Petty equation.
QED
Exercises
(1) Determine the SFC for the following scenarios in the UK and SI systems. (a) For a jet engine consuming 660 lbf of fuel per hour while generating 990 lbf of thrust. (b) For a piston engine consuming 21 gallons while producing 275 BHP.
(2) Using the Gagg and Ferrar model tabulate the altitudes at which a normally aspirated piston engine generates 100%, 95%, 90%, …, 45% power for ISA, ISA–30°C, ISA, and ISA+30°C.
(3) Using the Mattingly method estimate the maximum power of a Garrett TPE331-10 at 30,000 ft and Mach 0.45, using the basic T-O data of Table 7-9 and assuming a throttle ratio of 1.072. Estimate the fuel consumption in gallons of Jet-A per hour. Assuming a cruise segment at that altitude, how far can the airplane fly on 500 gallons if equipped with two TPE331s?
(4) Using the Mattingly method to estimate the thrust of a Microturbo TRS 18-056 at 10,000 ft and Mach 0.39, using the basic T-O data of Table 7-10 and assuming a throttle ratio of 1.000. Estimate the fuel consumption in gallons of Jet-A per hour. How much fuel must this airplane carry to cover a 300 nm cruise segment at that altitude if equipped with only one TRS 18-056?
(5) Compare the thrust and fuel consumption of the two CFM56 engines in Table 7-11, at 35,000 ft and Mach 0.8 in terms of lbf of Jet-A per hour, assuming it can be based on the T-O data.
(6) A single-engine electric aircraft is equipped with a 40 kW motor and battery packs that store 150 Ah of energy. Estimate its total endurance if it uses full power for 5 minutes, 65% power for 5 minutes, and 30% for the remaining charge (assuming no overheating and ignore Peukert’s law).
(7) A simple diffuser inlet is being designed for a specialty turbofan engine that requires the cruise speed Mach number of 0.65 to be reduced to Mach 0.3 at the front face of the compressor. The diameter of the compressor is 30 inches. (a) Determine the required inlet lip diameter so the Mach number at the lip at T-O will not exceed 0.8. (b) If the included angle is expected to be 17°, how long must the diffuser be in order to prevent flow separation?
(8) Estimate the power of the example engine in Section 7.4.3, Extracting piston power using the Petty equation at altitudes of 5000 ft, 10,000 ft, and 15,000 ft.


References
1. In: http://cafefoundation.org/v2/gfc_2011_results.html.
2. In: http://aviation-safety.net/index.php.
3. David L Daggett, Ortanderl Silvio, Eames David, Berton Jeffrey J, Snyder Christopher A. Revisiting Water Injection for Commercial Aircraft. SAE 2004-01-3108 2004.
4. Anonymous. ExxonMobil: World Jet Fuel Specifications with Avgas Supplement. 2005; Edition.
5. In: http://www.shell.com/home/content/aviation/products/fuels/types/civil_jet_fuel_grades/.
6. In: http://www.lycoming.com/engines/legacy/.
7. Stinton D. The Design of the Aeroplane. Collins 1983.
8. Avco Lycoming Corporation Report 2268 Horsepower Correction Factors and Operating Techniques for Engine Development and Calibration. August 1960.
9. Anonymous. Pilot Training Manual for the C-46 Commando. AAF Manual No. 50–16.
10. Benser WA, Moses JJ. An Investigation of Backflow Phenomenon in Centrifugal Compressors. NACA R-806 1945.
11. In: http://www.pwc.ca/en/about/history.
12. Taylor, John WR, and Mark Lambert, Eds. Jane’s All the World’s Aircraft. Jane’s Information Group, various years.
13. Mattingly JD, Heiser WH, Pratt DT. Aircraft Engine Design. 2nd edn AIAA Education Series 2002.
14. Mattingly JD. Elements of Gas Turbine Propulsion. McGraw-Hill 1996.
15. Austyn-Mair W, Birdsall DL. Aircraft Performance. Cambridge University Press 1992; 102–106.
16. In: http://yuneeccouk.site.securepod.com/Aircraft.html.
17. Eberhardt JJ. Fuels of the Future for Cars and Trucks. U.S Department of Energy 2002.
18. Accident report NTSB/AAR-86/02, January 31, 1986.
19. McCormick BW. Aerodynamics, Aeronautics, and Flight Mechanics. John Wiley & Sons 1979; p. 420.
20. Flack RD. Fundamentals of Jet Propulsion with Applications. Cambridge Aerospace Series Cambridge University Press 2010.
21. Seddon J, Goldsmith EL. Intake Aerodynamics. AIAA Education Series 1985.
22. Schlichting H. Boundary Layer Theory. Pergamon Press Ltd 1955.