
Evaluating the corrosion performance of metal medical device welds
Abstract:
Corrosion is a ubiquitous process that affects nearly every aspect of our lives from large-scale structures like buildings and bridges to small intricate personal items like mechanical watches. Corrosion is also a concern for modern implantable medical devices such as pacemakers that have become synonymous with today’s miracle medical technologies. Because the details of welds are less predictable than normal metallurgy, it is very important to be suspicious of weld corrosion and thus do a thorough assessment before marketing any implantable medical device. This chapter provides a practical guide for assessing the risk of weld corrosion from planning corrosion measurements to sample preparation, to data analysis and risk mitigation.
7.1 Introduction
Corrosion is a ubiquitous process that affects nearly every aspect of our lives from large-scale structures like buildings and bridges to small intricate personal items like mechanical watches. Corrosion is also a concern for modern implantable medical devices such as pacemakers that have become synonymous with today’s miracle medical technologies.
While we all recognize corrosion in the form of things like rust, the mechanisms leading to corrosion often appear mysterious and not well understood to the general population. When we talk about corrosion we are usually concerned with metals. In this chapter we are not only concerned with metals that may be complex alloys, but in particular we are focusing on metal welds in implantable medical devices.
Corrosion is an oxidative process. The material said to corrode is oxidized, which means it loses electrons and becomes a chemical compound that we refer to as the corrosion product. Rust, which is iron oxide, is an example of such a compound. What is sometimes overlooked is that corrosive oxidation cannot occur in isolation. There is always a second, corresponding reaction, called a reduction, which also occurs. In a majority of cases this second reaction is the reduction of molecular oxygen to produce water or hydroxide ions. The laws of physics require that the amount of oxidation and the amount of reduction be equal. Thus, the overall corrosion reaction is said to be stoichiometric. It is this relationship that allows us to measure the amount and rate of corrosion by determining things like the amount of corrosion product formed, or the current associated with the transfer of electrons between the oxidized and reduced species.
In the sections below we will build upon these basics and discuss how some fairly simple methods can be used to estimate the instantaneous rate of corrosion, even if it is far too small to observe in real time. Even more, these same methods can help us to estimate the cumulative effect of corrosion over very long periods of more than a decade.
7.1.1 Types of corrosion
There are many ways to think about corrosion. Some of these are based on appearance and others on more scientific principles like the process that produces the corrosion. Probably the most useful way to begin classifying corrosion is by its general appearance. If the entire area of concern appears to be affected, the corrosion is said to be ‘general’ or uniform corrosion. The rusting of unpainted iron or steel left sitting out in the open is an example of uniform corrosion.
The second classification of corrosion by appearance is non-uniform corrosion. Such corrosion is readily recognized by its blotchy appearance. In many cases there are small heavily corroded areas in near proximity to relatively unaffected and maybe even pristine areas. Perhaps the most common example of non-uniform corrosion is pitting corrosion. Pitting corrosion is often observed as tiny spots, which are actually high aspect ratio pits, in an otherwise reasonable looking surface.
Another way to classify corrosion is by the process that causes it. In the vast majority of cases of interest here the driving force causing corrosion is thermodynamics; the corrosion reaction proceeds simply because the corrosion products are in a less energetic state than the starting surface and reducing species. Such a reaction is sometimes called a galvanic reaction because it is essentially a small, natural (unintended) battery. One of the things that make corrosion appear a little mysterious at first glance is that the metal being corroded and the reductant (usually oxygen) do not have to be in exactly the same physical location. The reason for this is that the metal being corroded serves as a conductor to move the electrons from the species being oxidized to the one being reduced. The other requirement is that an ‘electrolyte’, which is a solution containing conductive ions, bridges the area between where the oxidation and reduction takes place. This is illustrated in Fig. 7.1. Notice that the charge exchanged is always perfectly balanced. On one side the charge is transferred by electrons moving through the metal, while on the other side the charge is passed via ions moving through a solution. This is exactly analogous to the operation of a battery.

There are many variations on galvanic reactions. Different concentrations of oxygen, or different electrolyte concentrations, or the electrical connection of different metals can all drive galvanic corrosion. Some of these will be described at the end of the chapter for those who are interested in more detail.
In order to understand how we can measure and make estimates of cumulative corrosion we need to look at two of the main equations governing corrosion. The first of these is Faraday’s law which relates the amount of corrosion to the ‘corrosion current’, which is the rate electrons (or ions) are moving between the places where oxidation and reduction occur.
Here I is the corrosion current (as opposed to i = I/A, which refers to area normalized current or current density), n is the number of electrons transferred from the corroding species, F is a constant called the Faraday, A is the corroding area, and dN/dt is the moles of the species corroding per area per second. The importance of this equation is that it states that if we can measure I and know the corrosion reaction and area, we know the instantaneous rate of the corrosion. Integrating this value over time is the basis for estimating the cumulative amount of corrosion.
The second equation is the Butler–Volmer equation which relates current to the potential driving the reaction.
Here Icorr is the equilibrium corrosion current, R is the universal gas constant, αa and αc are the oxidation and reduction charge transfer coefficients, T is temperature, and η is overpotential (the potential relative to the equilibrium corrosion potential). Notice that in this equation the current is proportional to an exponential term involving the potential of the system with respect to the corrosion potential. The key features of this equation are the exponential dependence of I on E and the reciprocal involvement of temperature in the exponential. Later we will see that this equation also leads to our ability to measure corrosion rates by observing the slope of a log I vs E plot near where I approaches zero. These equations also tell us about ways to make accelerated estimates of corrosion.
The corrosion reactions discussed so far are termed ‘spontaneous’ because they are powered by thermodynamics and occur without external intervention. However, some implantable medical devices also incorporate a battery, which is a source of energy that may cause systems that would not otherwise corrode to corrode. A common example of this kind of corrosion is the bluish deposits that are often observed on the top of a car battery. This corrosion is caused by some of the energy in the battery being ‘siphoned off’ from its intended purpose of running the car. This process is called electrolysis when it is intended to occur and is the basis for many very important industrial processes such as the manufacture of chlorine gas and aluminum metal. There are a few instances where electrolysis can cause corrosion in some parts of a medical device.
7.1.2 Corrosion on medical device welds
While the corrosion associated with medical devices is technically the same as any other corrosion, it needs to be thought of in a somewhat different manner. One distinction is that medical devices are only constructed from materials that are known to be quite stable. Thus, the amounts of corrosion that are likely to occur are relatively small. There are three areas of concern about medical device corrosion. The first is the threat to the integrity and function of the device. For example, it would be bad if the enclosure of a pacemaker was able to corrode completely through and expose the interior of the device to the body (and vice versa). A typical pacemaker case is about 250 μm (0.010 in.) thick. It must last for at least 10 years, and perhaps twice that. Thus, if the rate of any form of corrosion is greater than 12.5 μm/year, the device case may be breached. Notice that such a requirement does not depend on whether we are concerned with uniform or non-uniform corrosion. A breach is a breach.
It is also important to realize that even the corrosion of internal components within a medical device can be very detrimental. For example, the case of the battery inside a pacemaker or other medical device might corrode through and thus compromise both the functioning of the battery as well as the electronics and other components in the vicinity of the battery. A complete breach is not all we need to be concerned about. Corrosion may also decrease the mechanical strength or electrical conductivity of some vital component and thus indirectly cause a failure. A third concern is that the corrosion products may expose the body to a threat from toxicity.
So far everything that has been said applies equally to all metal parts of a medical device. However, the focus of this chapter is on welds. Why are they special? The simple answer is that welds are special and deserve more attention because they are complicated alloys, usually much more so than the rest of the device, and thus more susceptible to problems.
What is not obvious is that two very corrosion-resistant metals can be welded together and the result is a weld that is not very corrosion resistant. For example, consider the welding of two pieces of stainless steel, which are by themselves quite resistant to corrosion. To understand why their weld might not be corrosion resistant we need to consider why the stainless steel is corrosion resistant in the first place. Stainless steel would readily corrode if it were not for the nanometers thick layer of chromium oxide that forms on the outer surface. If the welding process (which may be done in an inert atmosphere) does not re-form this protective oxide, the weld will not be corrosion resistant. Many metal systems behave similarly. In addition to that, very complex intermetallic compounds can form in weld zones. These are often not completely understood and depend on details of the welding process like temperature, amount of energy, and time. Furthermore, for dissimilar metal welds, the possible intermetallic compounds formed are often surprisingly reactive, even if their parent alloys are stable. Phase diagrams are very useful to help predict the intermetallic compounds that form during welding.
Because the details of welds are less predictable than normal metallurgy, it is very important to be suspicious of weld corrosion and thus do a thorough assessment before marketing any implantable medical device. This is not so different from special military and space applications where high reliability is expected, the time frames of use may be long, and the devices themselves are not very accessible for repair or inspection.
7.1.3 The goals of a corrosion assessment
It is obvious that predicting adequate device integrity is a goal of corrosion assessment. Actually, corrosion is one of many assessments that must be made to ensure an implantable medical device will perform its intended function over the expected longevity. It is difficult to make exact, detailed predictions about corrosion over a long time period of a decade or more. This is especially true when one considers non-uniform corrosion that may happen quickly once it starts. Hence, a major goal of a corrosion assessment is to determine whether a given system shows any propensity for localized corrosion.
Another goal is to show that tiny amounts of innate general corrosion that occur in all systems will have no practical effect on the implanted device. This may amount to demonstrating that there is no practical loss of material during the implant duration, and is equivalent to proving a large safety factor so that even if the corrosion estimate is off by a significant amount, it will cause no problem. Such a strategy is wise since corrosion has shown itself to be very sensitive to small changes in environment and the presence of contaminants. This is one reason why a very controlled manufacturing process is a critical part of any corrosion mitigation strategy. It is vastly important that sources of possible contaminants, like chloride and less corrosion-resistant metals, be controlled and minimized as well as having manufacturing processes, like welding, be very consistent once a suitable process has been identified.
7.2 Measurements of corrosion
The goals of corrosion measurements are to determine the mode (uniform or localized) and rate of corrosion (material penetration rate in distance per time and elemental corrosion product release rate in mass per time). Measurements of corrosion are made by testing a weld sample in the actual (i.e. in vivo) or simulated (i.e. in vitro) implant environments to assess the impact of corrosion on device performance. Since human clinical and animal tests involve both ethical and cost constraints, routine corrosion tests are normally carried out in simulated implant environments. The preparation and design of the sample are also important test considerations (see Sections 7.4 and 7.5).
In vitro corrosion tests are either immersion tests or direct measurements of the electrical current produced by corrosion. Immersion testing consists of exposing the sample to simulated implant conditions and inspecting the sample and environment some time later for evidence of corrosion. Table 7.1 lists common immersion tests along with some aspects of their use (Cramer and Covino, 2003; Jones, 1996; Korb and Olson, 1987). Direct corrosion current measurements use electrical test equipment (such as potentiostats and frequency response analysers) to control the energy applied to the sample and measure the corrosion current using various established test methods (see Section 7.3). Measurements of corrosion current are useful as corrosion current can be directly converted to corrosion rate using Equation [7.1].
Table 7.1
| Immersion test | Corrosion rate or risk | Standard |
| Mass change, galvanic, open circuit potential | Rate | ASTM G31, ASTM G71, ASTM G5 |
| Active device | Rate | None |
| Water exposure (humidity, liquid soak, and boiling) | Risk | ASTM A967, practice A and B; ASTM F1089 |
| Salt spray | Risk | ASTM A967, practice C; ASTM B117 |
| Pitting and crevice | Risk | ASTM G48 |
| Intergranular, sensitization | Risk | ASTM A262 practice B; ASTM A763, practices X, Y, and Z |
Notes: Test results for corrosion rate are analysed by mass change, solution analysis, corrosion potential versus time trend, and microscopic inspection. Test results for corrosion risk are analysed by microscopic inspection only.
The active device test is an interesting example of an immersion test where a weld is subjected to the therapy waveform under simulated implant conditions. For multiple samples, testing in separate containers allows for solution analysis to determine the sample corrosion rate via the corrosion products produced. The use of electrical test equipment allows for periodic queries of the potential vs time trend and surface changes of the sample via capacitance. It is also useful to devise functional tests of the weld (electrical or mechanical) to assess its performance before and after test.
Simulation of the implant environment is crucial to performing a valid corrosion measurement. The challenge for the corrosion engineer is to replicate the most important factors. Fortunately, the implant environment is fairly stable and well studied (see Table 7.2). If necessary, it is possible to characterize the implant environment by consulting tabulated data (Duck, 1990; Lentner, 1980, 1985, 1990) or by performing a limited number of animal experiments.

The environmental variables which affect weld corrosion are all parameters which change the conditions at the weld–electrolyte interface. Normally the implant environment can be adequately simulated using 0.9 wt% saline (i.e. NaCl) or pH 7.4 phosphate buffered saline at 37 °C and 1 atm. The presence of chloride ions is important as it is well known that halogen ions increase corrosion risk by decreasing the stability of passive oxide films (such as on stainless steel, titanium, and aluminium). Other important considerations include dissolved oxygen and carbon dioxide as well as the presence of protein.
The presence of oxygen can increase corrosion (due to increased reduction rates for an oxygen reduction rate controlled process) or decrease corrosion (due to enhanced passive oxide film stability). As the oxygen concentration in the body is less than the fully aerated test condition (3.0 mL/L vs 5.5 mL/L, respectively), it is necessary to understand the effect of oxygen on the particular corrosion situation under study prior to testing (Letner, 1990; Weast, 1983). Protein adsorption is one of the first events that occurs at the site of a device implant as part of the foreign body response (Ratner et al., 2004); however, the use of protein in testing can normally be neglected.
As device implant times are long, compressing test time through the use of accelerated testing is often necessary. The goal of accelerated testing is to maximize the test acceleration factor such that acceptable performance for the full implant time of the device may be demonstrated within the product development timeline. The acceleration factor for the test is determined by a ratio of the test variables or of the corrosion rates for accelerated and non-accelerated tests. Accelerated test results are only valid when the mode of corrosion and the mechanism of corrosion rate control can be shown to be the same as for the non-accelerated in vivo situation. The variables which can be used to accelerate corrosion are compressed use cycles, temperature, and reactant concentration.
Acceleration by compressed use cycles is performed by increasing the frequency of known elements of the use condition (i.e. the electrical waveform or mechanical stresses). Further acceleration may be obtained by reducing or eliminating rest periods (i.e. increasing duty cycle). Temperature is a common accelerant applied to corrosion; however, the actual effect of temperature depends upon the rate limiting reaction. Commonly, temperature is expected to accelerate corrosion by increasing the value of Icorr (see Equation [7.2]). The value of Icorr is also dependent upon the reactant concentrations adjacent to the surface of the weld. Common reactants which can affect the corrosion rate are oxygen, chlorine, protons (i.e. hydronium ions from acid), and metal ions. Knowledge of the implant environment is essential for the acceleration of corrosion as it is difficult to justify the use of an accelerated condition which cannot be related to the actual implant environment.
The desired output of a corrosion assessment is evidence of the weld’s resistance to corrosion. This evidence may be as simple as a weld free of corrosion after a period of immersion or a measurement of Icorr; however, other metrics are available by closer inspection of the sample and sample environment. Sample inspection can determine the corrosion mode (uniform or localized) from the presence of corrosion product and the appearance (or not) of localized corrosion features such as pits and crevices.
Mass change, sample volume change (from measured dimensions), and pit or crevice volume can all be translated into corrosion rate using Faraday’s law and assumptions regarding the corrosion reactions and material density. Metallographic methods may be used to mount and cross-section samples for a more detailed microscopic view of corrosion damage and interior device spaces (Vander Voort, 1984, 2004). The extent of localized corrosion (pit or crevice depth) can be revealed in well-prepared cross-sections, but the calculation of the volume removed is difficult without making assumptions regarding the pit or crevice depth and shape. White light interferometry is a superior technique to directly measure the volume of the material removed (Holme and Lunder, 2007). In this way, a penetration rate for a survey of features may be calculated. As it is often impractical to image an entire sample, microscopy results can be used to estimate the overall corrosion rate if assumptions are made for the distribution of corrosion damage across the sample surface. ASTM G46 provides a guide and methods for surveying corrosion damage.
ASTM G102 instructs the corrosion engineer regarding the use of Faraday’s law to calculate corrosion rates in the form of penetration rates (distance per time). The penetration rates calculated from Faraday’s law using the entire sample volume and area presume uniform corrosion. Assumptions regarding the distribution and shape of localized corrosion features can be used to calculate the localized corrosion penetration rate in a similar way. Time-varying corrosion rates may also be handled using an integral of the rate over the desired time (this requires multiple sampling time points). Years is the typical unit of time as the corrosion rates of medical devices and materials are normally quite low.
Solution analysis for dissolved metallic elements can also be used to determine corrosion rate. There are two main methods for solution analysis – inductively coupled plasma-atomic emission spectroscopy (ICP–AES) or mass spectroscopy (ICP–MS). The two methods differ in terms of cost (AES < MS) and detection limit (MS < AES). Typical detection limits for AES and MS vary by lab and analyte but are typically in the range of 10 and 0.1 ppb, respectively (Harris, 2003). Each medical device weld and design has a different acceptable maximum amount of corrosion; such a threshold should be considered when selecting the test duration and solution analysis method as the combination determines the minimum detectable corrosion rate. The requested solution analysis should include measurements for all major alloying elements (wt% > 1) or dissolved elements (as determined from literature or prior experience). The elemental concentration data must be re-combined computationally to yield a metallic dissolution rate. For both the use of Faraday’s law and solution analysis for calculations of the corrosion rate, the methodology used for the calculations should be recorded to support the results.
7.3 Direct measurements of corrosion current
Direct measurements of corrosion current are possible using suitable sample and test cell designs and electrical test equipment. Corrosion currents are clearly observable for both uniform and localized corrosion, but uniform corrosion current is much easier to translate into a corrosion penetration rate. Area normalized corrosion current only makes sense for uniform corrosion. As for immersion tests, sample and sample environment inspection after test are required to gain the maximum amount of information from the effort. The methods which are useful for measuring corrosion current include polarization, galvanic, and electrochemical impedance spectroscopy (EIS) tests.
Polarization tests can be used both for direct measurement of uniform corrosion rate (Icorr) and for the comparative assessment of localized corrosion risk. The method described here is based on voltage control of the corrosion rate and the Tafel equation (Equation [7.4]). There are many standardized methods for performing polarization measurements (ASTM G5, G59, G61, G100, F746, and F2129).
Polarization scans are made by scanning the electrode potential at a constant rate and measuring the current response; other methods also exist such as measuring current over a series of fixed potential values. Polarization scans to determine the corrosion rate are typically performed at a slow scan rate to minimize the effects of non-steady state reaction rates and the current error due to capacitive charging. Care must be used in designing the test sample and in setting up the test cell to yield useable results. Possible sources of error include non-corrosion oxidation reactions and non-voltage (i.e. reactant mass transport) rate control (Scully and Kelly, 2003).
There are two regions of the polarization plot which are of interest – small and large overpotentials. Different information regarding the corrosion performance of the weld can be derived from each overpotential region. Figure 7.2 shows a polarization scan from a typical corrosion experiment. Polarization scans at high overpotentials (η > 30 mV) are likely to introduce sample damage due to the forced corrosion. Evidence of corrosion damage can be seen in Figure 7.2 by the spikes indicating pitting on the forward scan and by the elevated current on the reverse scan. Corroded test samples cannot be re-used unless all corrosion damage can be removed (such as by re-polishing the sample surface).
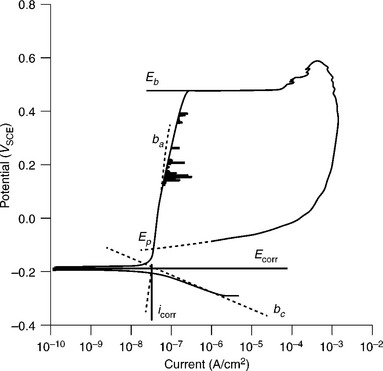
7.2 Polarization scan for a 304SST sample performed in N2 de-aerated, pH 7.4 phosphate buffered saline from −0.2 V vs open circuit potential (OCP) to 1 mA/cm2 at 0.167 mV/s = 0.6 V/h, with the reverse scan also shown. The dashed lines, ba and bc, are the anodic and cathodic Tafel slopes which intersect at Ecorr and Icorr (indicated by the solid horizontal and vertical lines, respectively). Eb and Ep are the breakdown and passivation potentials.
At small values of overpotential (η < 30 mV) near Ecorr, a linear plot of potential versus current can be obtained (see Fig. 7.3). The linear region typically consists of ±5–30 mV adjacent to Ecorr. The slope of the plot in Fig. 7.3 is the polarization resistance (Rp) which may be used to calculate the corrosion current if the Tafel slopes (ba and bc) are known (see Equations [7.5] and [7.6] and ASTM G59); here B is the Stern-Geary coefficient. The Tafel slopes may be determined from regions of the Tafel plot at large overpotential.

7.3 Polarization resistance plot showing potential versus current for ±30 mV around Ecorr. Polarization data from Fig. 7.2.
Figure 7.4 shows a typical Tafel plot. The linear portions of the E vs log(I) plot nearest to Ecorr yield the Tafel slopes – ba positive of Ecorr and bc negative of Ecorr. From the Tafel equation (Equation [7.4]) we know that the intersection of the lines with slopes ba and bc on the polarization plot occurs at Ecorr and the corrosion current (log (Icorr)). This is a second means of determining Icorr called the Tafel extrapolation method – there is no standardized method for this technique.
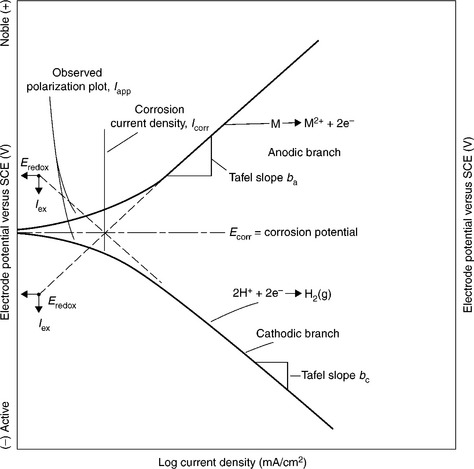
7.4 Tafel plot showing Tafel slopes and extrapolation to graphically determine the values of Ecorr and Icorr. The Tafel current is located at the intercept of the Tafel slopes, ba and bc. Ecorr and Icorr are determined from this intercept. Saturated calomel electrode (SCE). (Taken from Wagner and Traud, 1938.)
So far we have used the data from the polarization scan to determine the rate of uniform weld corrosion. Polarization data may also be used to determine the susceptibility of a weld or material to localized corrosion (pitting or crevice) or to compare the stability of materials. Figure 7.2 shows points labeled Eb and Ep – the breakdown and re-passivation potentials, respectively. These points are taken at very large overpotential and yield comparative data about the stability of the metallic passivation layer and about the corrosion behavior.
Welds and materials whose corrosion rate is limited by a passivating oxide film may exhibit a breakdown potential (Eb) at which the slope of the potential vs corrosion current curve abruptly increases. The greater the value of Eb, the greater is the stability of the passivation mechanism and weld. The breakdown potential is typically defined as the initiation point of an increase of log(I) by at least two powers of ten (ASTM F2129).
After observing Eb, a polarization scan is typically reversed back to its starting potential. The behavior of the potential vs log(I) data over this reverse scan indicates the sample tendency to undergo pitting or crevice corrosion. If the reverse scan re-traces its forward path or falls below it, the risk of localized corrosion is low. If the current on the reverse scan remains elevated, it is likely that localized corrosion is present. Transient current spikes on the forward scan are another indicator of localized corrosion – these are localized corrosion events (pits or crevices) that spontaneously re-passivate. On the reverse scan, Ep is the protection potential where the reverse scan crosses the forward scan (ASTM F2129). The higher the value of Ep or the smaller the magnitude of (Eb – Ep), the more resistant is the weld or material to localized corrosion.
Galvanic corrosion is caused by the electrochemical interaction of different metals or alloys (or by differing environmental conditions on the same material). One material or area serves as the counter-electrode to another corroding material or area; the materials and areas must be in both electrical and ionic contact. The main variables involved in galvanic corrosion are summarized in Table 7.3 along with their effects.
Table 7.3
Key variables and effects of galvanic corrosion
| Variable | Effect of increase on corrosion rate |
| Ionic resistance | Decrease |
| Ohmic resistance | Decrease |
| Area ratio (Areduction/Aoxidation) | Increase |
| Environmental uniformity | Decrease |
The risk and rate of galvanic corrosion may be predicted if polarization scans for the two materials of interest are available. Figure 7.5 shows polarization scans for two hypothetical materials (Cu and Fe) displayed on the same plot. It can be seen in Fig. 7.5 that galvanic corrosion is possible with copper serving as the counter-electrode to the corroding iron. The use of current (not area normalized current) is significant as the current density (current per area) of each material’s polarization scan must be converted to current to reflect the surface area ratio present. The intersection of the polarization scans occurs at Ecorr and Icorr for the galvanic couple. The predictive power of this technique depends on the accuracy of the polarization scans. If a risk of galvanic corrosion is indicated, it is recommended to complete a test for galvanic corrosion.
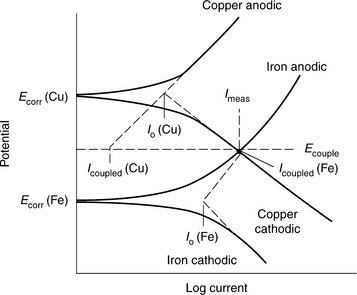
7.5 Use of polarization scans to predict the risk and rate of galvanic corrosion. (Taken from Hack and Taylor, 1987.)
ASTM G71 provides a guide for performing galvanic corrosion testing. In its simplest form, a galvanic corrosion test is an immersion test with the entire galvanic couple contained on a single sample and immersed in electrolyte. The corrosion rate is then determined by mass loss, solution analysis, sample inspection, or a combination of the three. It is more advantageous to obtain a direct measurement of the corrosion rate by current measurement if possible. For a direct measurement, knowledge of the corroding system is used to separate the sample areas where reduction and oxidation occur and each portion is prepared as a separate test sample. Electrical connection is made external to the test cell where both samples are immersed under implant conditions. In this configuration, a zero-resistance ammeter can be used to monitor the galvanic current between the samples (see Fig. 7.6). Considerable time may be required for a stable galvanic current to be established (days to months); thus, maintenance of the test environment is critical. The expected trend for the current is to decrease and asymptotically approach a stable value over time.
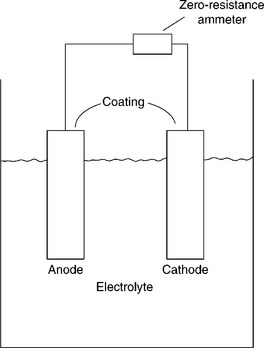
7.6 Galvanic corrosion test cell configuration for direct measurement of galvanic current. (Taken from Hack and Taylor, 1987.)
For representative results it is important to approximate the area ratio, electrical resistance, and relative position present in the actual device. For the galvanic testing of welds, direct galvanic current measurement requires the weld to be sectioned from the base material; in this case it may be more realistic to immersion test the entire device with the weld.
EIS is a measurement technique whereby a small sinusoidal input signal is applied to an electrical test sample (typically in a three-electrode test cell) and the sinusoidal response is measured for amplitude and phase-lag (Orazem, 2008). The input and output signals are paired voltage and current data. Through Ohm’s law, the data pair may be converted into impedance. The introduction of the frequency time domain coverts resistance to impedance – impedance is resistance on a complex plane (real ~ in-phase, and imaginary ~ out-of-phase) measured in Ohms.
For corrosion measurements, EIS experiments are typically performed using a ±10 mV potential input signal to stimulate a current output signal over a frequency range from 105 Hz down to frequencies as low as 10−3 Hz. The potential signal is normally applied about Ecorr, but the measurements can be performed at any desired potential. As the current signals are small and sensitive to noise, it is important to perform EIS experiments using a Faraday cage. A description of the symbols and basic equations used to describe impedance can be found in Orazem (2008) and Bard and Faulkner (2001).
Figure 7.7 shows a typical graphical presentation of impedance data from a corrosion experiment. The value of using EIS to measure the corrosion rate is obtained by fitting an equivalent circuit to the impedance data. Software routines available with EIS measurement systems perform both EIS measurements and equivalent circuit fitting. EIS experiments performed near Ecorr (as opposed to large overpotential polarization experiments) are non-destructive due to the small induced current. Thus, EIS may be used to monitor the corrosion rate of a sample over time provided that the test environment can be stably maintained. Figure 7.8 shows two common equivalent circuits which may be used to model impedance data. Note that constant phase elements (CPEs) are used in place of simple capacitors. CPEs can be thought of as non-ideal capacitors and are used to account for the effects of large electrochemical surface area and many parallel RC time constants. Circuit (b) may be used to model corrosion under paint or a defective passive film.
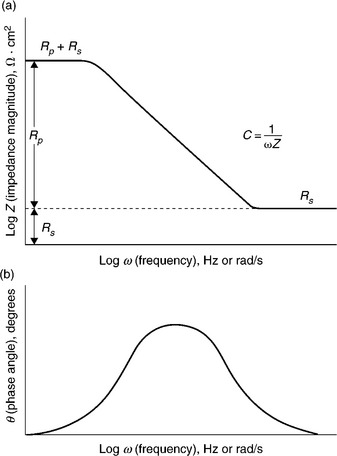
7.7 Example impedance data from a corrosion experiment; Bode plots of (a) total impedance and (b) phase angle vs log(frequency). (Taken from Scully and Kelly, 2003.)
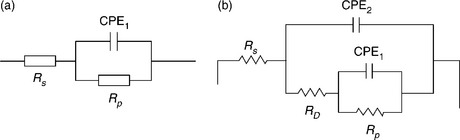
7.8 EIS equivalent circuits for modeling EIS data from a corrosion experiment, (a) Randle’s circuit and (b) two parallel resistor-capacitor (RC) time constants (τ = RC). Rs is the solution resistance, Rp is the polarization resistance, CPE1 is the double-layer capacitance, RD is the defect resistance, and CPE2 is the passive film capacitance. (Taken from Mansfeld, 2003 and Mansfeld et al., 1993.)
EIS data can be used to calculate corrosion rate through the determination of the polarization resistance (Rp) and prior knowledge of the Tafel slopes (ba and bc) using Equation [7.5] and [7.6]. It should be stressed that the use of this method requires knowledge of the corrosion area such that Rp can be area normalized. This requirement limits the use of this technique to uniform corrosion. In instances where the corroding area is unknown (such as localized corrosion using circuit (b)), while Rp may still be quantified, it cannot be assigned to a specific area. Thus, EIS for localized corrosion can be used to rank welds in terms of corrosion risk but not to measure the rate. The use of EIS to monitor long-term corrosion is possible by following the trend of Rp (as Rp decreases, the rate of corrosion increases).
EIS is also useful for determining electrochemical surface area and for following surface area changes over time (such as may be due to corrosion). Both of the circuits in Fig. 7.8 measure double-layer capacitance using a CPE circuit element. The modeled equivalent circuit parameter values may be converted to an effective double-layer capacitance value as described in Hirschorn et al. (2010). Whether modeled as a simple capacitor or CPE, double-layer capacitance may be converted to microscopic surface area if an area-specific capacitance value for the corroding electrode is known (Murray et al., 1988). As such values have not been compiled for all electrode materials in all situations, it may not be possible to make a quantitative conversion; however, changes in double-layer capacitance are directly proportional to changes in surface area.
7.4 Considerations when gathering corrosion data
A critical decision that must be made in performing corrosion measurements is whether to test coupons or actual parts. Coupons are purpose-build weld samples for testing, while actual parts can be complete devices or subassemblies. Coupons can be more convenient but may require a separate manufacturing process and material supply from the device. If a coupon is chosen, care must be taken to ensure that the coupon is representative of the finished device with respect to materials, processes, and design. If a device is chosen for testing, size and fixturing concerns determine its utility. If a device is too large or small, it may be difficult to find a suitable test cell or equipment to accurately measure its corrosion rate. If too large, a good strategy is to fashion a test coupon from the device. If too small, several devices can be tested in parallel. Standardized test methods are a good source for possible test sample designs (ASTM F746, F2129, G5, G61, and G71).
The corrosion performance of a weld may be tested as part of a larger device or in isolation from adjacent device areas. While testing in an assembly may be more realistic, the test results will be less specific to the properties of the weld and more a function of the overall corrosion performance of the entre assembly. Testing the weld alone involves selecting a method for isolating the weld – by creating a welded test coupon, by mechanically sectioning the weld out of the larger device, by masking device areas outside the weld, or by miniaturizing the test cell such that only the weld is exposed (Garcia et al., 2008; Policastro et al., 2012; Suter and Bohni, 1997). Such decisions must be made in advance of testing based upon the desired goals of the test plan and the utility and economy of testing.
The sources of variation inherent in the materials and methods used to produce the actual device must be considered when selecting and preparing a test specimen – failure to do so can generate invalid test results. In evaluations of medical device welds it may be necessary to consider applying conditioning steps prior to testing in order that the condition of the sample more closely matches its implanted state. Relevant considerations to ensure a representative corrosion test sample are summarized in Table 7.4. The reader should note the similarities between Table 7.4 and an Ishikawa or fishbone diagram for sources of process variation. The sample variables which affect the corrosion susceptibility of a weld are those that affect the surface of the sample. Table 7.5 summarizes the surface-condition variables which determine the corrosion risk of a weld sample.
Table 7.4
| Source of variation | Corrosion test considerations |
| Man | Handling, contamination, operator variability |
| Materials | Supplier change, design change, composition variation, mechanical dimension variation, lot-to-lot variation |
| Methods | Process change, process variation, final process including sterilization and packaging, implant procedure |
| Machines | Process change, process variation, fixturing, set-up variation, contamination |
| Measurements | Precision, accuracy, test method, gauge study |
| Environment | Implant conditions (mechanical, electrical, chemical), test conditions, process environment, condition variations |
Table 7.5
Surface-condition sample variables affecting weld corrosion risk
| Variable | Description | Effect |
| Material | Inherent stability of base-material weld alloy, or passivating surface oxide | Increasing stability decreases corrosion risk; galvanic cells increase corrosion risk |
| Surface roughness factor | Ratio of electrochemical surface area (wettable area including micro-scale features) to geometric surface area | Increasing value increases the corrosion risk for passive devices but may decrease the risk for active devices |
| Geometry | Sample shape including outside corners and pit or crevice-forming features | Outside corners increase corrosion risk for imposed current and voltage; pit or crevice-forming features increase corrosion risk |
| Inclusions | Minority metal or alloy impurities which form small particles upon solidification | Inclusions on the sample surface increase corrosion risk |
| Contamination | Embedded particles and machining lubricants on the weld surface | Increase corrosion risk |
One of the main factors controlling corrosion risk is the choice of the metal exposed to the electrolyte; the engineering of a stable weld-electrolyte interface decreases the corrosion risk. The surface roughness factor of a sample increases corrosion risk due to the probabilistic nature of corrosion – more area equals more risk. Additionally, surface roughness caused by pit or crevice-like features increases corrosion risk due to the formation of isolated environments which may accelerate corrosion. For active devices, additional surface area may decrease corrosion risk by decreasing current density. Geometry affects corrosion risk through crevice forming features which create isolated environments and through outside corners which concentrate current density. Inclusions of foreign materials or minor alloying elements on the sample surface increase corrosion risk due to possible galvanic interactions with the base material and through the additional surface area and pits which are formed after dissolution of the inclusions. Contamination on the weld surface can increase corrosion risk as the contaminants may contain chemical species which accelerate corrosion.
The number of samples to test is another important consideration. The number of samples required is determined by the precision and reliability required for the corrosion assessment. Good questions to consider are: What is the standard deviation of typical corrosion-rate measurements? What is the impact of corrosion to device function? What is the allowable patient or supplier risk of a corrosion failure? If a predicate design exists, is equivalence sufficient? How much improvement is required for a new design?
If at all possible, answer these questions before embarking on a test plan, and reference existing data sources whenever possible. It is advisable to use statistical methods to determine a sample size (ASTM G16 and Roberge, 2003). If no previous data exists with which to estimate the typical variation of the results for a corrosion test, consult the open literature, standardized test methods (especially round-robin test results), or corrosion handbooks (Cramer and Covino, 2003; Korb and Olson, 1987) for results from a similar material and test method.
7.5 Test sample preparation
Once a sample design has been selected, the sample must be prepared for test. There are two general types of corrosion tests – immersion and direct corrosion current measurements. Immersion tests require a minimum of sample preparation, including cleaning and possibly a means for suspending the test articles in solution. Care must be taken in designing a specimen holding mechanism as contact between the specimen and the walls of the test vessel, other specimens, or a rack can create crevice-like isolated environments which may unrealistically accelerate corrosion. Immersion tests can be conducted in fully immersed, partially immersed, or gaseous exposure variations where the immersion medium is a liquid electrolyte. While full immersion is the most likely experienced test condition for medical device welds, the other variations should also be considered with knowledge of the use conditions. The preparation for any test which requires electrical measurements is more involved.
Most published corrosion studies involve grinding, polishing, and cleaning steps as part of preparing specimens for test; however, this practice may not be useful for testing medical device welds. If a simple comparative test of materials or devices is desired, standard sample preparation steps may be acceptable (ASTM G1). However, if a corrosion assessment for a finished device or weld is the goal, the test plan should be conducted using specimens in their as-manufactured state with a minimum of additional preparation steps.
Many standardized electrical test methods for corrosion assume a specific sample form factor (ASTM G5, G61, and F746); however, for medical device or weld corrosion testing, sample form factor flexibility is important (ASTM F2129). Reference to a standardized sample form and assembly will be used here to illustrate the important aspects of electrical sample construction (see Fig. 7.9).
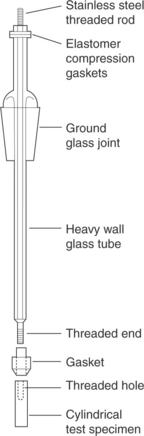
7.9 Standardized test electrode and holder. (Taken from Mansfeld, 2003.)
The important aspects of electrical sample creation are electrical contact, sealing, and masking. A means of electrical contact to the sample is commonly created using a lead wire in electrical contact with the test sample. Electrical contact can be created by welding or by the use of conductive adhesive (such as silver-filled epoxy) – there are disadvantages to both methods. The creation of a welded connection requires fixtures for the weld and compatibility of the two materials being welded. Further, a weld creates heat-affected zones (in addition to the weld under test) that can affect the test results and should be masked. The use of conductive adhesive adds a foreign material to the test environment whose exposure will impact test results.
Materials that are used for masking must not react with the sample surface or release leachants which are electrochemically active or which contaminate the test surface. Masking materials that have been used with success include epoxy, silicone medical adhesive, lacquers (such as those used for metal plating – see Tolber Microstop), and photoresist. Good adhesion of the masking material is critical for valid test results. Loss of masking material adhesion leads to the formation of crevice-like microenvironments which accelerate corrosion and skew results.
Even if the electrical lead wire is of the same material as the test sample, it still must be isolated from the test environment so that it does not contribute to the current being measured. A good strategy for accomplishing this is to encase the lead wire in silicone or polyurethane tubing and backfill the lumen of the tubing where it contacts the device with silicone medical adhesive or another masking material.
Once a sample has been prepared for testing, it should be cleaned prior to placement in the test cell to remove the residues from sample preparation and handling. Cleaning should be completed as close to the start of testing as possible. Three cleaning steps are recommended: detergent washing to remove dirt and ionic contamination, organic solvent washing to remove grease and organic contamination, and water rinsing. Water rinsing is normally used after both detergent and organic cleaning steps and immediately prior to testing. Drying the sample between cleaning steps (using ambient drying, oven drying, or pressurized inert gas or air drying) is also important to prevent contamination of the next cleaning step. Care should be used to ensure that the drying process does not introduce additional contamination (e.g., from compressor oil, particulates, or handling). If samples must be stored, they should be kept in a low-humidity environment such as a desiccator or glove box in a clean glass container. The use of glass containers is important to prevent contamination of the sample surface by plasticizers (such as from the surface of plastic containers and bags).
7.6 Instrumentation and equipment
To conduct corrosion measurements, the basic instrumentation and equipment consists of a potentiostat and a test cell. For immersion corrosion tests, only a test cell is required. Modern potentiostats are computer controlled and some are even multi-channel and allow for the parallel testing of multiple samples. The instrument control software packages offer a variety of pre-programmed test methods and data analysis routines. Many potentiostats now include a built-in frequency response analyser function which may be used for EIS measurements. Good reviews of the types, uses, and configuration of electrochemical test equipment exist and should be consulted for further information (Mansfeld, 2003).
Test cell refers to the container in which a corrosion test is conducted. In general, the test cell design should be only as complex as necessary to simulate the implant conditions. For an immersion corrosion test, the test cell is normally a simple test rack, beaker, or sealable jar. For immersion tests in sealed containers, cell storage in an oven may provide a convenient means of temperature control. While less complex, the immersion test cell shares many of the same requirements with the more complicated electrical test cell used for direct measurements of corrosion current. Figure 7.10 shows the design of a three-electrode electrical test cell, and Table 7.6 lists the cell components from Fig. 7.10 along with their function and requirements.

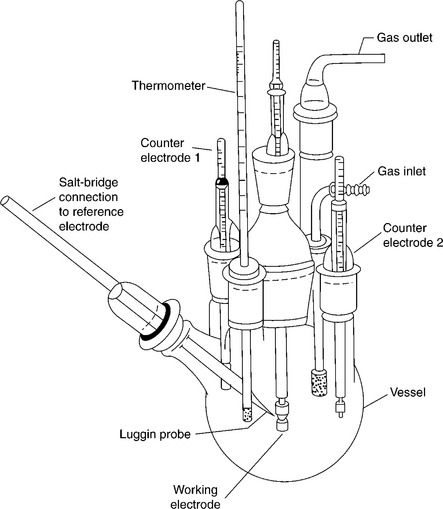
7.10 Electrical three-electrode corrosion test cell. (Taken from Scully, 1987.)
The strategy to be considered when selecting a test cell is to ensure that no aspect of the cell design or materials will affect the results observed on the test sample. Gas-tight refers to the ability of the test cell to maintain a positive pressure of the gas being sparged relative to ambient conditions. It is common to use a water-filled air lock upstream of the test vessel to verify cell sealing and gas flow. For long-term tests, evaporation of the electrolyte due to gas sparging is an issue which may be addressed by periodic additions of the electrolyte solvent to restore the original volume or by pre-saturating the sparge gas with water using a bubbler. Liquid-tight, in regards to the working electrode holder, refers to the necessity of preventing electrolyte contact with the means of electrical connection. Inert refers to the requirement that none of the cell components react with or emit leachants which affect the test result.
The counter-electrode surface area requirement is necessary to ensure that the corrosion current on the working electrode is not limited by the area of the counter-electrode or by a non-uniform electric field. The vessel volume requirement ensures that there are both sufficient electrolyte and reactants to prevent artificial mass-transport limitations on the working electrode corrosion rate (typical test cells contain 10–100 mL/cm2 of working electrode). If possible, any temperature-control heating elements and stirring mechanisms should be physically remote from the test cell as these are common sources of electrical noise. For this reason, the test cell is often located within a Faraday cage to further reduce interference from electrical noise. Because the implant environment for a tissue-encapsulated device contains minimal mass transport, stirring of the test cell is likely unnecessary. During testing, the outlet of the gas sparge is often moved above the electrolyte surface to minimize stirring.
7.7 Interpretation of data
Every medical device weld has a point of greatest vulnerability (PGV) to corrosion damage as created by combined dimensional, mechanical, and electrical requirements. Additional requirements on the maximum corrosion rate are created by consideration of the impact of dissolved elements on patient toxicity. After the corrosion mode and rate have been characterized it is the responsibility of the corrosion engineer to assess the risk of corrosion to device function and patient safety.
The use of the corrosion rate for a corrosion prediction depends on the type of corrosion: uniform or localized. A uniform corrosion rate is applied as measured at the PGV. Conversely, a localized corrosion rate should be applied in a worst-case scenario given its inherent variability; the use of worst-case may entail assuming that all corrosion occurs in one location with a single pit or a representative distribution of localized corrosion features. Other methods of corrosion rate application can certainly be conceived, but a requirement for all of them is that the rationale is well considered and documented.
Mechanical requirements interact with corrosion due to the material removal and consequent reduction in dimensions. Further, localized corrosion creates pits or cracks which can act as stress concentrators that can greatly reduce the mechanical performance of a weld, material, or design. In assessing the risk of corrosion to mechanical weld performance, it is critical to understand the impact of dimension changes and flaws on device function. Such an assessment requires the corrosion engineer to work closely with the device design team. It is possible that additional mechanical testing of corrosion samples or normal welds with induced flaws or dimension reductions will be useful for assessing the risk of corrosion.
As above, the interaction of corrosion damage with weld or device electrical requirements necessitates a similar assessment of uniform or localized corrosion damage on device function. Again, it is necessary for the corrosion engineer to work closely with the device team. Further, any risk due to the accumulation of corrosion product should be considered (especially in the instance where corrosion may affect a mechanical electrical contact).
Even if considerations of corrosion damage with respect to mechanical and electrical requirements proves of little risk to device function, the rate of corrosion must still be considered in terms of patient toxicity. For toxicity analysis, Equation [7.1] is used to convert the corrosion current into a mass release rate for the elements in the weld. If solution analysis has been performed, such data may be used directly for this purpose. Databases exist (e.g. IRIS, Integrated Risk Information System) which list toxicity information for various elements; further, references for the elemental composition of various tissues and elemental excretion rates and routes should be consulted when considering the toxicological risk of corrosion (Duck, 1990; Lentner, 1980, 1985, 1990). In the case of toxicity, the mode of corrosion is not important – only the elemental corrosion product release rate. Toxicity assessments require the corrosion engineer to collaborate with toxicologists and other biological response experts in order to develop a prediction of the risk of corrosion to patient safety. For a majority of medical device materials and devices, toxicity is usually not a concern because release rates are low.
7.8 Mitigations for weld corrosion
If corrosion is found to be an issue for the medical device weld under test, there are a number of different mitigation strategies which may be explored, as shown in Table 7.7.
Table 7.7
Weld corrosion prevention strategies and considerations
| Strategy | Questions |
| Test method | Was testing performed per procedure? Is the observed corrosion a test artifact? Were the samples properly prepared? |
| Device design | Is weld needed or can it be removed? Does the design of the weld accelerate corrosion? Can the weld be isolated from electrolyte contact? Is the device performing as intended? |
| Material selection | Is a galvanic couple present? Can more corrosion resistant metals be used? Do the metals meet specification? Did the supplier change? Did the supplier process change? Is the weld alloy less corrosion resistant than the parent materials? |
| Active device issue | Is the waveform correct? Can the waveform be changed? |
| Pre-weld preparation | Were the materials passivated? Were the materials cleaned? |
| Weld process | Does the weld process make the materials more likely to corrode? Can the weld process be changed? Is poor fixturing an issue? Was a cover gas used? Did the process change? Is process variability a concern? |
| Post-weld preparation | Was the weld passivated? Was the weld cleaned? Was the weld annealed? Could the weld be sensitized? |
| Protective coating | Can a protective coating be applied? Will the coating adhere and remain pin-hole and defect free? |
Finding mitigations for a weld corrosion issue involves thinking broadly and creatively about all aspects of the material, sample preparation, and testing. First and foremost, the test method should be scrutinized to ensure that any observation of corrosion is valid. Only after the corrosion result has been verified should the other questions be considered. The types of solutions that are possible will depend on the stage of the product development project; in general, the availability of convenient solutions decreases with project time. Certainly, many solutions are possible given unlimited time and resources, but the corrosion engineer must be practical and seek an optimal solution given the inherent time and resource constraints. A good approach to maximizing the available solutions is to identify high corrosion-risk welds and test them as early in the project as possible. The corrosion engineer must be especially sensitive to material and process changes over time – welds that are not initially a concern for corrosion can become so if material specifications, material suppliers, or processes change.
7.9 Future trends
While corrosion and its causes have been studied extensively, advances in medical device design, materials, science, and computing power require the medical device corrosion engineer to continually refine the test methods for and understanding of corrosion.
The present state of corrosion assessment and testing is adequate for use by the medical device industry to market safe and reliable devices. What is needed is additional research with the goal of refining the understanding of the specific factors of the implant environment which impact the corrosion performance of medical device materials. These details may prove important as the trends of smaller device size and decreased cost combine to require the use of novel materials and decreased material dimensions.
One criticism of using in vitro test data to predict the implanted corrosion performance of a medical device weld is that the in vitro test environment does not exactly mimic the implant environment. Implanted welds are subject to all the complexities of the host immune response (Ratner et al., 2004), and it is difficult to ensure a test method captures all of the important aspects. For example, published literature contains conflicting reports regarding the effect of adsorbed proteins on metallic corrosion (Clark and Williams, 1982; Karimi et al., 2011). The specific effect of protein on corrosion (accelerating or protecting) seems to depend on the material and device being tested. The fact that these devices are put into diseased patients adds another degree of uncertainty. For example, many diseases are associated with infections which are oxidative in nature and may affect corrosion behavior.
Most corrosion-test methods account for ionic content, dissolved gas, temperature, and major protein species. Even so, it is possible for test data to differ somewhat from implant results (Witte et al., 2006). It would be useful for improved test methods to be developed via a refined understanding of the corrosion-relevant aspects of the implant environment (i.e. most test methods do not account for the direct action of living cells). It is conceivable that future test methods may use living cells and cell culture conditions (Tang et al., 2006).
Related to improvements in corrosion-test methods is the concept of designed experiments with the goal of establishing a direct correlation between in vitro and implant corrosion results. Due to the lack of full confidence in bench test data, animal experiments are routinely used to verify and validate bench results for many aspects of medical device development. However, animal experiments are costly in terms of time, resources, and animal life. If a correlation were developed between bench test and implant corrosion results (especially accelerated test results), time, expense, and animals could be spared. This type of correlation may need to be developed for each device type or tissue environment. Collaboration of the corrosion engineer with medical, veterinary, and biological experts is the key to the success of any such effort.
Computing power and speed continue to rapidly advance, and one of the fields to benefit is computer modeling. The medical device community is increasingly interested in the use of computer modeling to predict implanted device performance. Results from such efforts could be used to quickly test design and material options via computer models with the aim of improving device reliability. A key to accurate modeling efforts is a detailed understanding of use conditions, as these are inputs to any computer-based simulation. Another key is selection of the necessary variables to be included in the model. Computer simulations depend on detailed knowledge of the microstructure and properties of the materials being used. As the understanding of the impact of use conditions and material properties on corrosion performance is advancing, it would be useful to incorporate this knowledge into a predictive computer-based model. It is preferred for such a model to start from first principles to predict corrosion rates and device performance for a variety of materials and designs. Companies such as Vextec (www.vextec.com) are presently working in this direction with the aim of predicting the overall reliability of a device population by taking into account design, material microstructure, and process variability.
7.10 Sources of further information
Additional sources of information regarding corrosion (including books, journals, standards committees, and academic and industrial organizations) have been tabulated by Cramer et al. (2003, p. 999) and Bard and Faulkner (2001, p. 39).
7.11 References
ASTM InternationalA262-10: Standard practices for detecting susceptibility to intergranular attack in austenitic stainless steels. Conshohocken, PA, USA: ASTM International, 2010.
ASTM InternationalA763-93: Standard practices for detecting susceptibility to intergranular attack in ferritic stainless steels. Conshohocken, PA, USA: ASTM International, 2009.
ASTM InternationalA967–05: Standard specification for chemical passivation treatments for stainless steel parts. Conshohocken, PA, USA: ASTM International, 2005.
ASTM InternationalB117–09: Standard practice for operating salt spray (fog) apparatus. Conshohocken, PA, USA: ASTM International, 2009.
ASTM InternationalF746–04: Standard test method for pitting or crevice corrosion of metallic surgical implant materials. Conshohocken, PA, USA: ASTM International, 2009.
ASTM InternationalF1089–10: Standard test method for corrosion of surgical instruments. Conshohocken, PA, USA: ASTM International, 2010.
ASTM InternationalF2129–08: Standard test method for conducting cyclic potentiodynamic polarization measurements to determine the corrosion susceptibility of small implant devices. Conshohocken, PA, USA: ASTM International, 2008.
ASTM InternationalG1–03: Standard practice for preparing, cleaning, and evaluating corrosion test specimens. Conshohocken, PA, USA: ASTM International, 2003.
ASTM InternationalG5–94: Standard reference test method for making potentiostatic and potentiodynamic anodic polarization measurements. Conshohocken, PA, USA: ASTM International, 2004.
ASTM InternationalG16–95: Standard guide for applying statistics to analysis of corrosion data. Conshohocken, PA, USA: ASTM International, 2010.
ASTM InternationalG31–72: Standard practice for laboratory immersion corrosion testing of metals. Conshohocken, PA, USA: ASTM International, 2004.
ASTM InternationalG46–94: Standard guide for examination and evaluation of pitting corrosion. Conshohocken, PA, USA: ASTM International, 2005.
ASTM InternationalG48–03: Standard test methods for pitting and crevice corrosion resistance of stainless steels and related alloys by use of ferric chloride solution. Conshohocken, PA, USA: ASTM International, 2009.
ASTM InternationalG59–07: Standard test method for conducting potentiodynamic polarization resistance measurements. Conshohocken, PA, USA: ASTM International, 2009.
ASTM InternationalG61–86: Standard test method for conducting cyclic potentiodynamic polarization measurements for localized corrosion susceptibility of iron-, nickel-, or cobalt-based alloys. Conshohocken, PA, USA: ASTM International, 2009.
ASTM InternationalG71–81: Standard guide for conducting and evaluating galvanic corrosion tests in electrolytes. Conshohocken, PA, USA: ASTM International, 2009.
ASTM InternationalG102–89: Standard practice for calculation of corrosion rates and related information from electrochemical measurements. Conshohocken, PA, USA: ASTM International, 2010.
Bard, A.J., Faulkner, L.R.Electrochemical Methods: Fundamentals and Applications. Hoboken, NJ, USA: John Wiley & Sons, 2001.
Clark, G.C.F., Williams, D.F. The effects of proteins on metallic corrosion. J. Biomed. Mat. Res.. 1982; 16:125–134.
Cramer, S.D., Covino, B.S.ASM Handbook: Volume 13A Corrosion: Fundamentals, Testing, and Protection. Materials Park, OH, USA: ASM International, 2003.
Cramer, S.D., Covino, B.S., Holcomb, G.R., Ziomek-Moroz, M. Information sources and databases for the corrosionist. In: Cramer S.D., Covino B.S., eds. ASM Handbook: Volume 13A Corrosion: Fundamentals, Testing, and Protection. USA: ASM International; 2003:999–1001.
Duck, F.A.Physical Properties of Tissue: A Comprehensive Reference Book. San Diego, CA, USA: Academic Press, 1990.
Garcia, C., Martin, F., de Tiedra, P., Blanco, Y., Lopez, M. Pitting corrosion of welded joints of austenitic stainless steels studied by using an electrochemical minicell. Corr. Sci.. 2008; 50:1184–1194.
Hack, H.P., Taylor, D. Evaluation of galvanic corrosion. In: Korb L.J., Olson D.L., eds. ASM Handbook: Volume 13 Corrosion. USA: ASM International; 1987:234–238.
Harris, D.C.Quantitative Chemical Analysis. New York, NY, USA: W. H. Freeman & Co, 2003.
Hirschorn, B., Orazem, M.E., Tribollet, B., Vivier, V., Frateur, I., Musiani, M. Determination of effective capacitance and film thickness from constant-phase-element parameters. Echim. Acta. 2010; 55:6218–6227.
Holme, B., Lunder, O. Characterisation of pitting corrosion by white light interferometry. Corr. Sci.. 2007; 49:391–401.
Jones, D.A.Principles and Prevention of Corrosion. Upper Saddle River, NJ, USA: Prentice Hall, 1996.
Karimi, A., Nickchi, T., Alfantazi, A. Effects of bovine serum albumin on the corrosion behavior of AISI 316L, Co-28Cr-6Mo, and Ti-6Al-4V alloys in phosphate buffered saline solutions. Corr. Sci.. 2011; 53:3262–3272.
Korb, L.J., Olson, D.L.ASM Handbook: Volume 13 Corrosion. USA: ASM International, 1987.
Lentner, C.Geigy Scientific Tables, Vol. 1: Units of Measurement, Body Fluids, Composition of Body, Nutrition. West Caldwell, NJ, USA: Ciba-Geigy Corporation, 1980.
Lentner, C.Geigy Scientific Tables, Vol. 3: Physical Chemistry, Composition of Blood, Hematology, Somatometric Data. West Caldwell, NJ, USA: Ciba-Geigy Corporation, 1985.
Lentner, C.Geigy Scientific Tables, Vol. 5: Heart and Circulation. West Caldwell, NJ, USA: Ciba-Geigy Corporation, 1990.
Mansfeld, F. Electrochemical methods of corrosion testing. In: Cramer S.D., Covino B.S., eds. ASM Handbook: Volume 13A Corrosion: Fundamentals, Testing, and Protection. USA: ASM International; 2003:446–462.
Mansfeld, F., Shih, H., Greene, H., Tsai, C.H. Analysis of EIS data for common corrosion processes. In: Scully J.R., Silverman D.C., Kendig M.W., eds. STP 1188: Electrochemical Impedance: Analysis and Interpretation. USA: ASTM International; 1993:37.
Murray, J.N., Moran, P.J., Gileadi, E. Utilization of the specific pseudocapacitance for determination of the area of corroding steel surfaces. Corrosion. 1988; 44:533–538.
Orazem, M.E., Tribollet, B.Electrochemical Impedance Spectroscopy. Hoboken, NJ, USA: John Wiley & Sons, 2008.
Policastro, S.A., Auyeung, R.C.Y., Martin, F.J., Rayne, R.J., Pique, A., Lewis, A., Geltmacher, A., Natishan, P.M. An approach for determining microscale electrochemical behavior. J. Electrochem. Soc.. 2012; 159:C15–C24.
Ratner, B.D., Hoffman, A.S., Schoen, F.J., Lemons, J.E.Biomaterials Science (2nd edn): An Introduction to Materials in Medicine. London, UK: Elsevier Academic Press, 2004.
Roberge, P.R. Statistical interpretation of corrosion test results. In: Cramer S.D., Covino B.S., eds. ASM Handbook: Volume 13A Corrosion: Fundamentals, Testing, and Protection. USA: ASM International; 2003:425–429.
Scully, J.R. Electrochemical methods of corrosion testing. In: Korb L.J., Olson D.L., eds. ASM Handbook: Volume 13 Corrosion. USA: ASM International; 1987:212–220.
Scully, J., Kelly, R.G. Methods for determining aqueous corrosion reaction rates. In: Cramer S.D., Covino B.S., eds. ASM Handbook: Volume 13A Corrosion: Fundamentals, Testing, and Protection. USA: ASM International; 2003:68–86.
Suter, T., Bohni, H. A new microelectrode method to study pit initiation on stainless steels. Echim. Acta.. 1997; 42:3275–3280.
Tang, Y.-C., Katsuma, S., Fujimoto, S., Hiromoto, S. Electrochemical study of type 304 and 316L stainless steels in simulated body fluids and cell cultures. Acta. Biomat.. 2006; 2:705–709.
Vander Voort, G.F.Metallography: Principles and Practice. New York, NY, USA: McGraw-Hill Book Company, 1984.
Vander Voort, G.F.ASM Handbook: Volume 8 Metallography and Microstructures. USA: ASM International, 2004.
Wagner, C., Traud, W. Über die deutung von korrosionsvorgängen durch überlagerung von elektrochemischen teilvorgängen und über die potentialbildung an mischelektroden. Z Elektrochem.. 1938; 44:391–402.
Weast, R.C.CRC Handbook of Chemistry and Physics. Boca Raton, FL, USA: CRC Press, Inc, 1983.
Witte, F., Fischer, J., Nellesen, J., Crostack, H.-A., Kaese, V., Pisch, A., Beckmann, F., Windhagen, H. In vitro and in vivo corrosion measurements of magnesium alloys. Biomaterials. 2006; 27:1013–1018.