
The profiler is a Unity Pro feature. It's a great help when optimizing your game. It can report the amount of time spent for rendering, animating, or code processing.
Open the profiler window by navigating to Window | Profiler. The following window appears (yours will be empty):
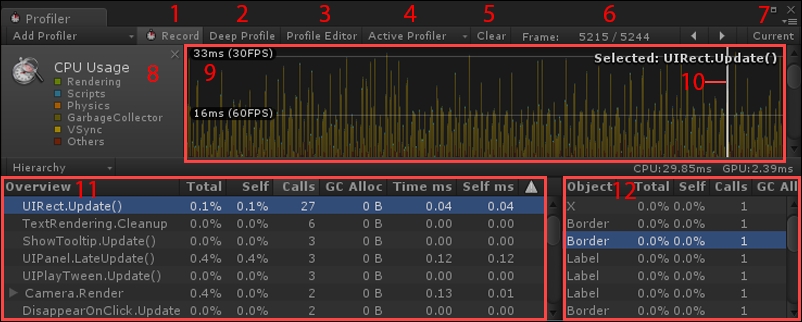
Profiler window while in play mode
Here's an explanation of the most important functions of the Profiler window:
- Record: This enables or disables frame data recording.
- Deep Profile: This records information for all scripts, giving your more script details for each frame. With it enabled, you'll have a deeper hierarchy of analyzed elements and know which method took how much of the processing time. Enabling it at runtime will prompt the game to restart—it's recommended that you enable or disable this feature while the game isn't running.
- Profile Editor: Enabling this will let the profiler run even out of play mode.
- Active Profiler: This displays the profiler for either the editor or the connected device.
- Clear: This clears all profiler data to have an empty window.
- Frame: This shows the current frame number / total recorded frames.
- Current: Click here to record the current frame and display information about it (real-time profiling).
- CPU Usage: Here, you have the hardware category and color legend. This is currently viewing CPU Usage. Scroll down to see other categories (GPU, rendering, audio, and so on).
- Timeline: In this view, the rendering time of each frame is represented. The higher the time is, the slower your game is running. The goal is to avoid having too many spikes and irregularities. Click anywhere here to set the frame cursor (10) and analyze the specified frame.
- Frame cursor: This shows the selected frame cursor.
- Overview: This gives an overview of the currently selected frame by the cursor (10). You'll find here the different instructions that were executed at that frame. You can sort them by the amount of time they took to be processed or draw calls they requested by clicking on the table headings.
- Details: This window displays more information about the selected thread in Overview (11). You can see here the thread's nested instructions and know precisely how they impacted the processing time and draw call they requested.
The profiler records each frame's data and displays it as a timeline. You can view this recorded data separately for each frame by clicking anywhere in the timeline (9).
You should try to optimize your code, assets, scenes, and shaders to avoid having high time values. You should also avoid spikes like this one:
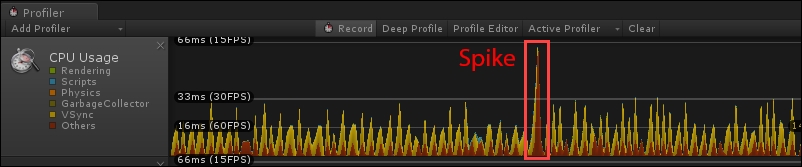
The preceding spike shows that the corresponding frame took twice as long (66 ms) to render than the others (33 ms)
The spike in the preceding screenshot means that your frame took longer than the others to render, leading to a frame-rate drop. By clicking on it, you'll retrieve information about which instructions took longer to process. By doing so, you'll gradually track down the different sources of your frame-rate drop.
Currently, the profiler is set up to record information from Unity Editor and not the device. It is possible to record data directly from the device while it's running the build, but we have a slight setup procedure for the very first time.
Connect your Android device to your computer now. First, we'll check whether the device is detected by the Android Debug Bridge (ADB):
- Hit the Windows key + R to open the Execute window (or launch the Terminal on Mac and move directly to step 3).
- Type
cmdin the new window and hit Enter or click on the Ok button. - In the newly opened command window, type
cdfollowed by your Android SDK'splatform-toolsfolder location and hit Enter. For example, in my case it is:cd C:SDKplatform-tools - Now, type
adb devicesand hit Enter to display the detected device list. You should have at least one device listed, which should be similar to this:List of devices attached R32D103DCQA device
If your device list is empty, reconnect your device and try again. If it's still not detected, restart your computer. If it doesn't show in the list after a restart, reinstall your device's USB drivers and check your cable; some USB cables can only recharge your device but do not allow data transfers.
Once you have your device displayed in the device list, follow these steps to set up the profiler on the Android device:
- Navigate to the File | Build Settings window.
- Check the Development Build option.
- Click on the Build And Run button and select a location for the
.apkfile.
Ok. When Unity has finished building and pushing the package to the device, open the profiler by navigating to Window | Profiler.
Now, we must request to display the connected device's profiler data:
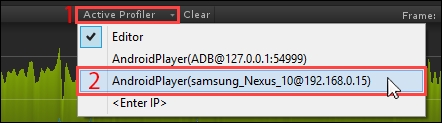
- Click on the Active Profiler (1) button in the Profiler window.
- Select your Android device in the list (2).
And that's it! You can now analyze the data fetched from the connected device. You can see that the GPU Usage category in the profiler is empty; this is simply because GPU profiling isn't supported on mobile devices.
Tip
You can now enable Wi-Fi profiling by following the instructions at http://docs.unity3d.com/Manual/Profiler.html.