Programs rarely work right the first time. In most cases, you'll need to fix problems as they occur until your program finally works. However, just because a program seems to work doesn't mean that it will work, so that involves more testing and fixing, known as debugging.
After you've debugged your program so that it finally does what it's supposed to do without crashing, freezing, or wrecking other files on a computer, you may be ready to ship it. That's the point where you have an actual working program that you can sell and distribute to others.
The main goal of writing any program is to get it to work. Once you get your program to work, you can stop right there and celebrate. Once you release your program to the public, your users are sure to find problems or request additional features, so you'll constantly need to keep updating and fixing your program over time.
Trying to write a program correctly the first time is nearly impossible, especially when you're creating anything beyond a trivial program that displays "Hello, world!" on the screen. The bigger your program, the more potential for errors and the more possible problems you'll need to consider.
Debugging any program can be challenging because you may know that your program isn't working right, but you may have no idea why it's not working right or even where to look for the problem. In general, there are three types of common bugs or errors to look for:
A syntax error occurs whenever you misspell a command or put a punctuation mark or symbol in the wrong place. In many cases, Xcode can immediately identify the problem, as shown in Figure 24-1.
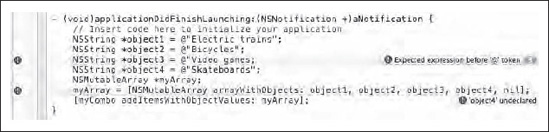
When Xcode highlights a potential problem, it displays a brief message bubble (located to the far right in Figure 24-1) that explains what the problem might be. In most cases, this message bubble may seem confusing because whatever error you created may have affected other parts of your code in an unintended way.
For example, if you forget to type a semicolon at the end of a line, Xcode will treat this line of code as part of the next line of code. Depending on what commands you've typed on each line, the problem can be fixed just by typing a semicolon in the right place, but Xcode's message bubble won't tell you that.
Some more common types of syntax errors that can affect how your program works include the following:
Using
=instead of==to compare two valuesOmitting a
breakstatement in a switch statementOmitting the
@character when using strings of theNSStringclassOmitting the
*symbol when using pointersNot creating a matching pair of property variables in the header (
.h) file and defining a synthesized variable in the implementation (.m) file
The single equal sign (=) assigns a value, while the double equal signs (==) compares two values. In other programming languages, it's acceptable to use the single equal sign to assign values and compare values, but in Objective-C, this will prevent your program from working. For example, if you wrote the following:
if (myValue = 45)
{
  // Code goes here
}
the single equal sign simply assigns the value of 45 to the variable myValue. As a result, it never compares if 45 is equal to the value stored in the myValue variable, so the code inside the if statement always runs, which probably isn't what you want. Because your code works (but not in the intended way), this type of error can be difficult to identify.
One way to ensure that you don't accidentally use a single equal sign instead of a double equal sign is to place an actual value first followed by the variable:
if (45 == myValue)
{
  // Code goes here
}
Now if you mistakenly use a single equal sign, such as (45 = myValue), Xcode will flag this as an error.
Omitting the break statement in a switch statement means your code could accidentally run more lines of code than you wanted. For example, suppose you had the following:
switch (myValue)
 {
     case 45:
          NSLog (@"The value is 45");
          break;
     case −9:
          NSLog (@"The value is −9");
          break;
     default:
          NSLog ("There is no matching value");
          break;
 }
If the value of myValue was 45, the program would just print this:
"The value is 45"
However, if you eliminated all the break statements and the value of myValue was 45, the program would print the following, which is probably not what you intended:
"The value is 45"
"The value is −9"
"There is no matching value"
To identify a string in Objective-C, you must use the @ symbol in front of the string and then enclose the string with double quotation marks like this:
@"This is a string"
If you fail to put then @ symbol in front of the string or forget to enclose the string with double quotation marks, Xcode won't recognize this as a valid Objective-C string object. Instead, it will treat it as an ordinary C string, which is probably not what you want since your program won't work right.
Whenever you use a class, such as NSString or NSWindow, make sure you use the asterisk (*) symbol to define a pointer. If you omit this asterisk (*) symbol when declaring a pointer, Xcode won't run your program.
Whenever you change something in your header (.h) file, make sure you make any necessary changes in your corresponding implementation (.m) file (and vice versa).
The header (.h) file typically contains Outlet variable declarations and an accompanying property declaration of that same variable:
@interface MyTestAppDelegate : NSObject <NSApplicationDelegate> {
    NSWindow *window;
    NSTextField *nameField;
}

@property (retain) IBOutlet NSWindow *window;
@property (nonatomic, retain) IBOutlet NSTextField *nameField;

@end
In this case, window is declared as a pointer to the NSWindow class and then defined as a property as well. In the implementation (.m) file, you must also define this pointer using the @synthesize command:
@synthesize window;
To modify a class, you must almost always change both the header (.h) and the implementation (.m) files. Because making one change involves editing two separate files, it's easy to forget to change two different files.
A logic error can be harder to identify because you think you wrote your code correctly but your instructions may not be accurate or complete. As a result, logic errors can be frustrating to track down because you may not know where to look.
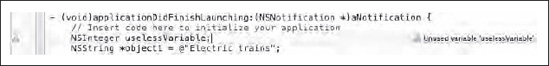
The simplest type of logic error is when you declare a variable but never use it, as shown in Figure 24-2. This won't stop or affect your program at all, but it's an error you should fix just to eliminate unnecessary code.
One serious type of logic error occurs when your code does exactly what you want it to do but your instructions are wrong. For example, suppose you wanted to run a loop exactly five times using this code:
int i;
for (i = 0; i <= 5; i++)
    {
        NSLog (@"The value of i = %i", i);
    }
This loop actually runs six times like this:
2010-10-08 13:04:47.894 Demo[77461:a0f] The value of i = 0
2010-10-08 13:04:47.898 Demo[77461:a0f] The value of i = 1
2010-10-08 13:04:47.901 Demo[77461:a0f] The value of i = 2
2010-10-08 13:04:47.905 Demo[77461:a0f] The value of i = 3
2010-10-08 13:04:47.906 Demo[77461:a0f] The value of i = 4
2010-10-08 13:04:47.907 Demo[77461:a0f] The value of i = 5
Because you think the loop is repeating five times, you may not even consider that this loop is doing something wrong until your program runs and starts messing up.
Logic errors can be one of the hardest types of errors to identify and fix because you already think everything is working but it's not.
A run-time error occurs only when you actually run your program and your program gets data that suddenly confuses it. For example, suppose your program takes a loan amount and divides it by the number of months of the loan, specified by the user. If the user accidentally types in a zero, your program will try to divide the loan amount by zero, and division by zero is impossible. As a result, your program won't work.
Run-time errors are another difficult bug to find and eliminate because your program may work exactly as you expect—except when the program receives the wrong type of data. Unless you test for all possible types of data your program might encounter, you can never be sure that you have eliminated all run-time errors in your program.
To identify possible run-time errors, test your program with a variety of different types of data, using extreme values. For example, if your program expects a number, see what happens if you give your program a huge number like 1 billion. Then see what happens when you give your program an extremely low value such as −0.0000009. If you want your program to accept data within a limited range, you may need to write extra code to check that all data falls within this acceptable range.
When you build your program, Xcode can highlight two types of errors: warnings and cautions. A warning is an error that can keep your program from working such as a misspelled variable name or a missing semicolon. A warning is an error that won't stop your program from running but could cause problems while your program runs. Xcode highlights warnings with an exclamation mark inside a red circle and identifies cautions with an exclamation mark inside a yellow triangle.
To view each error message in your program, choose Build
There is no one best way to debug a program because every program and every bug is different. However, there are some simple tricks and techniques you can use to isolate problems in your code. Finding the source of the problem is the hardest part. Fixing that problem, once you've identified what's causing it, is relatively easy in comparison.
If you suspect that one part of your code might be causing a problem, the simplest way to test your suspicion is to delete the suspicious code. Of course, if the code wasn't the source of the problem, now you have to retype it all back in again.
A simpler solution is to comment out your code. Just turn the suspicious code into a comment that Xcode will ignore. Now if you test your program and the problem goes away, you'll know your commented-out code is the problem. If your program still messes up, then you'll know that your commented-out code is not the problem, so you can examine and comment out another part of your program.
For commenting out one or two lines, you can use the double slash comment symbols:
// int i;
for (i = 0; i <= 5; i++)
    {
        NSLog (@"The value of i = %i", i);
    }
For commenting out multiple lines of code, you can use a matching pair of /* and */ symbols:
/*
int i;
for (i = 0; i <= 5; i++)
    {
        NSLog (@"The value of i = %i", i);
    }
*/
Note
You can also highlight multiple lines of code and then press
One major source of bugs is when your program somehow changes the value of a variable in an unexpected way. To determine where your program might be changing a variable, you can insert NSLog commands in different parts of your program. These NSLog commands can print out the value of a variable at different points of your program. The moment you see a value change, then you'll know approximately where that change occurred and which code you need to closely examine to identify the source of that problem.
For example, if you suspect a particular method is inadvertently changing the value of a variable, you could place an NSLog command before and after the method call like this:
NSLog (@"The value of x = %i", x);
y = calculateResult(x);  // suspect method call
NSLog (@"The value of x = %i", x);
If the value of your variable is 10 before the method call and afterward the value of your variable is 8974 when it should have stayed 10, then you'll know that your method is somehow messing up that variable.
Ideally to identify problems in your program, you should be able to watch each step of how the program works and behaves at any given time. That way, you can see whether your program is skipping some lines of code by mistake or mangling the value of certain variables in unintended ways.
To give you the ability to examine your code, line by line, Xcode offers breakpoints, which you can place on an individual line of code. A breakpoint simply tells Xcode to run your program and stop when it hits a breakpoint.
Once you're stopped at a breakpoint, you can examine the current value of variables and then choose to step through your program, line by line, to see how the rest of your program works.
You can place a breakpoint on any line of code, such as the first line of a method. To place a breakpoint, follow these steps:
Click a header (
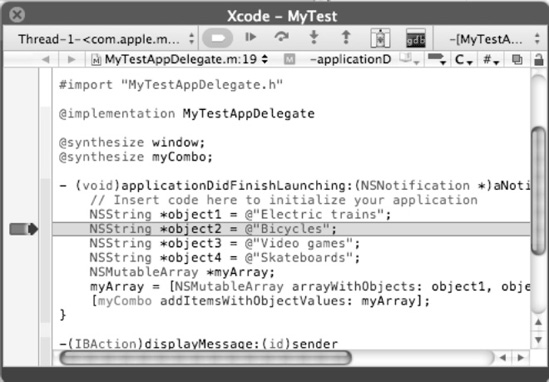
.h) or implementation (.m) file where you want to place a breakpoint.Click in the vertical gray column that appears to the left of the line of code where you want to place a breakpoint, as shown in Figure 24-3.
Repeat step 2 for each additional breakpoint you want to add to your code. You can add as many breakpoints as you want.
Note
To remove a breakpoint, just drag it away from the left margin, and when the mouse pointer displays a puff of smoke icon, release the mouse button to delete your breakpoint, as shown in Figure 24-4.

The Debugger window gives you the option of watching variables and stepping through your code after pausing at a breakpoint, as shown in Figure 24-5.
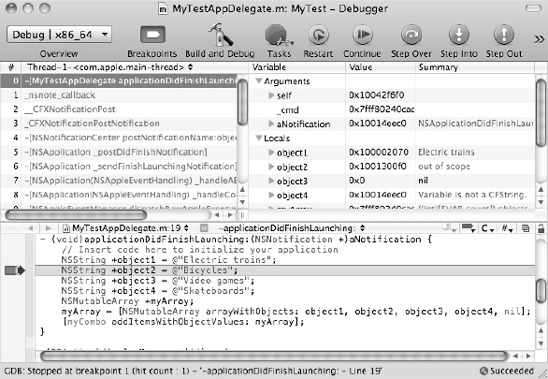
Figure 24-5. The Debugger window can display the value of variables and let you step through your code one line at a time.
To open (or hide) the Debugger window, choose Run
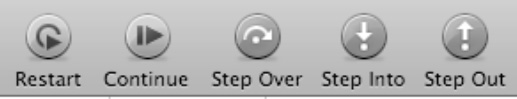
After you place one or more breakpoints in your code and build and run your program, your code will temporarily pause at a breakpoint, which you can view in the Debugger or mini Debugger window. At that point, you have several options, as shown in Figure 24-7:
Restart: Starts your program running from the very beginning.
Continue: Runs your program to the next breakpoint. If no other breakpoints exist, it runs your program normally.
Step Over: Steps through each line of code, skipping over method and function calls.
Step Into: Steps through each line of code, but when it reaches a method or function call, it steps through the code stored in that method or function.
Step Out: If you're currently stepping through code in a method or function, Step Out returns you to the code immediately after the method or function call.
To see how the debugger works, follow these steps:
Create a new Cocoa Application, and give it a descriptive name like MyTest.
Click the
MyAppDelegate.mfile in Classes folder, and modify the code as follows:#import "MyTestAppDelegate.h" @implementation MyTestAppDelegate @synthesize window; - (void)applicationDidFinishLaunching:(NSNotification *)aNotification { // Insert code here to initialize your applicationint i;for (i = 0; i <= 5; i++){NSLog (@"The value of i = %i", i);}} - (void)dealloc { [window release]; [super dealloc]; } @endChoose File

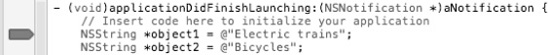
Click in the left margin of the first line (
int i;) under theapplicationDidFinishLaunchingmethod (see Figure 24-4) to set a breakpoint. A breakpoint arrow appears in the left margin.Chose Run
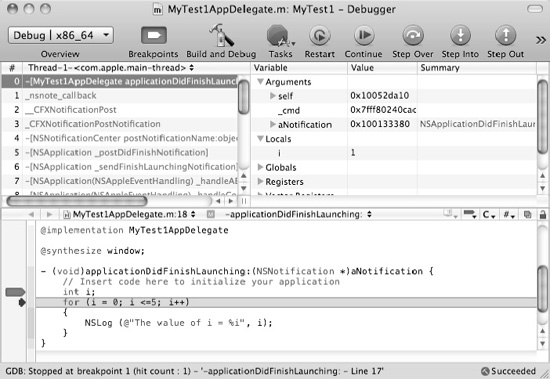
Click the Build and Debug button. Xcode highlights a line of code, as shown in Figure 24-8.
Click the Step Over icon to watch Xcode step through your code one line at a time. Notice that each time you click the Step Over icon, the contents of the
ivariable changes.Click the Continue icon. Xcode runs your program from its currently highlighted line of code to the next breakpoint. If there are no additional breakpoints, the program runs normally.
By using the debugger, you can step through each line of code and watch how each line of code may affect your variables. The moment you see that a variable changes incorrectly, then you can pinpoint the exact line of code that's causing the error.
Debugging may be tedious and exhausting, but it's the only way to track down and eliminate as many bugs as possible in your program. The larger your program, the more places bugs can possibly hide, and the more bugs you'll need to track down and wipe out. Although you may not find and eliminate all possible bugs, make an effort to wipe out as many as possible, especially the ones causing your program to work incorrectly.
Even the best programmers make mistakes, which makes programming a constant trial-and-error process as you write your code, test it, and fix any problems with it before moving on to writing more code. Three common problems with programs are syntax, logic, and run-time errors.
Syntax errors are typically misspellings or misplaced (or omitted) symbols or punctuation marks that can keep your program from running at all. Xcode can often identify syntax errors so you can fix them.
Logic errors are harder to find and isolate because the code may be working perfectly, but it's not working the way you thought it would work. As a result, tracking down and eliminating logic errors is much harder because you first must identify what's causing the problem.
Run-time errors are some of the hardest errors to fix because your program may work perfectly, except when you distribute it to others who use the program in situations that you never expected or intended. When your program receives data that it doesn't know how to handle, it can cause a run-time error. Fixing such run-time errors can be difficult because you can never anticipate all possible problems your program might face when in actual use.
When Xcode identifies a problem in your code, it displays a message in the Issues window. The two types of issues are Warnings and Cautions. A Warning signals a problem that keeps your program from working at all. A Caution alerts you to a problem that won't keep your program from running but may cause unintended problems if you don't fix it.
Two simple ways to debug your program involve using comments and printing out values using the NSLog command. When using the NSLog command, you can view the printed results by opening the Console window (choose Run
The Debugger window can display a variable watching window and your code with breakpoints so you can stop your code at certain points and step through each line to see how your program works.
When your program is working exactly the way you want, it's time to distribute it to others. Then you can sit back and look back on the long journey you took from learning about programming to writing your own programs to finally distributing your own programs for others to use. That's when you'll know you're a real programmer.
No single book can teach you all there is to know about programming, so now that you've reached the end of this book, it's time to start practicing writing your own programs, learning and sharing tips and ideas with others, and learning as much as you can from other books or attending conferences.
Since technology is always changing, you'll always need to keep learning something new just to keep up. The good news is that nobody can be an expert in everything, but many people can be experts in their own niche. Even though you may not think you know enough to be a programming expert, you probably know a lot more than you might think, and if you combine your programming skills with your current knowledge, you already know more than many people in your field.
Whether you plan on writing programs to sell, create custom programs for your work, or just enjoy making programs for a hobby, you'll find that computer programming can be a never-ending intellectual challenge that can keep you amused and mentally stimulated.
With your knowledge of Mac OS X programming, you can easily start creating iPhone and iPad apps. The future belongs to people willing to adapt to change and follow the market. By knowing how to program in Objective-C and use Xcode, you've just moved yourself into a select group of programmers ready to take advantage of the growing Mac, iPhone, and iPad markets. Within a short period of time, you may look back and marvel at how far you've come and how much you've learned, and it all started with your initial desire to learn the basics of programming the Mac.