If the more obvious checks fail to yield a result, you can use the database tracing cockpit. This has two tasks: recording a trace database and interpreting the results. This process is done in two parts: configuring the trace and executing it.
Tracing is done as part of a coordinated effort with other performance monitors and the user who is experiencing the problem. Since this will affect the system's performance, we need to select a window when this is done so that the user can perform the specific tasks in question.
You will need to have the Trace Parser installed, which is done from the Dynamics AX setup. This should be done on your local PC, and you need to be the local administrator of your PC. Moreover, you should have your account mapped to the system administrator security role within AX.
You should also have access to a SQL Server other than the one used by Dynamics AX.
Carry out the following steps:
- Launch Microsoft Dynamics AX 2012 Trace Parser (if using Windows 8, search for Trace Parser).
- In the Register database dialog box, select SQL Server that will store the trace result's database.
- Enter a database name for the trace file, for example,
MyTraceDatabase.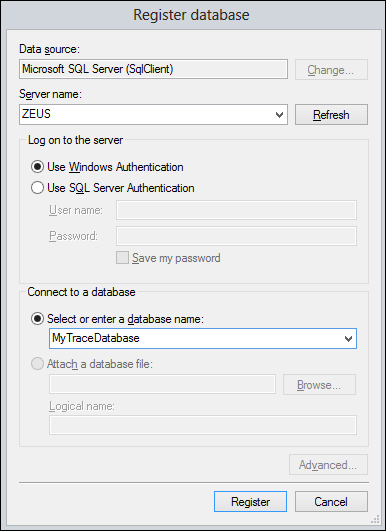
- Click on Yes when you are asked, The specified database does not exist. Would you like to create it?
- Launch the AX client using Run as administrator (right-click on the client icon).
- Launch the development environment (a quick way to do this is to press Ctrl + D).
- Click on Tools and Tracing Cockpit.
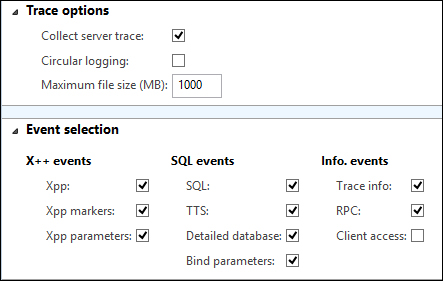
- The defaults are fine, but to make the results more useful, you should also check Xpp parameters and Bind parameters as shown in the following screenshot:
Note
The reason why the Xpp and Bind parameters are disabled by default is that they may reveal information (that is, actual data) as it is passed between the AX and SQL Servers. This could include sensitive information, for instance salary details. You should, therefore, obtain approval for this before proceeding.
- Click on Start trace to start the process.
- Enter a file for the trace to be stored within; this must be accessible by the server, so please use a UNC.
- Once the data has been captured, click on Stop trace.
- To view the trace, click on Open trace that imports the trace file into the registered database.
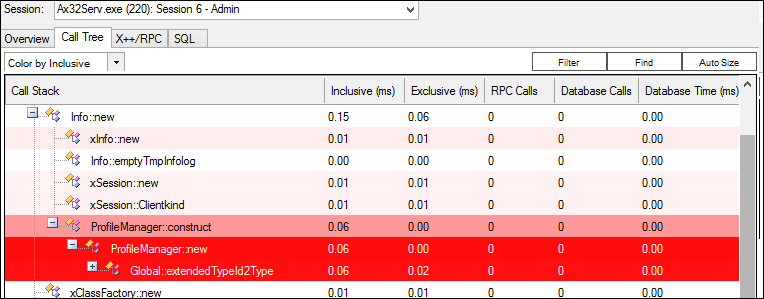
- The initial view of the trace is a brief summary; to view more details, select the user in question from the Session drop-down list.
- Use Call Tree to examine the call stack; the darker the red highlight, the larger the impact the event has on performance. You can use the code window to see the code that was executed. This is useful for developers, where custom code maybe the cause. This is shown in the following screenshot:
- Use X++/RPC to view the aggregate X++ and server RPC call information. You can also see the call stack and code that was executed.
- Finally, the SQL section shows the aggregate or detailed SQL transactions. This will give you the Transact-SQL statement that was executed.
If the trace fails to start, check the following:
- The AX Server service account has write access to the file
- You have rights to create the file
- There is sufficient disk space
- The AX client was started with Run as Administrator
Tip
You should perform the trace after the system has been in use for a period of time, so as to simulate normal use and avoid having your results skewed by investigating the issues related to the system starting up. The system will behave slower than normal as it takes time to initialize and cache. Always follow this advice, unless the issue is specifically that a task is slow the first time it is performed after system startup.
The trace is performed by the server monitoring the AX code and SQL activity and producing a file that you can import into Trace Parser.
The ETL (Event Trace Log) file can then be imported into the Trace parser (which is done for you by clicking on Open trace). The reason we created the database before starting the trace is so that we can simply click on Open trace and import the file.
By undertaking a full performance test, we analyzed the server counters for the AX and SQL Servers and also performed an AX trace with the tracing cockpit.
Each one, in isolation, will not always provide us with the reason for a performance problem, and even with all these tools being run together, it will not always make the reason obvious. Users can experience performance problems even when all the servers seem to be idling.
Now, we have the following information in hand:
- AX Windows Server counters for CPU, disk, memory, and network
- SQL Windows Server counters for CPU, memory, and network
- Details of the tasks being performed by the user in the window
- Details of the SQL statements being executed and ability to generate an execution plan
With this, we can correlate the information in order to determine the cause. The cause can be hardware resource, indexing, statistics, code, or a combination.
Low resource utilization, while you are experiencing a performance problem, is also a clue; the resource in question must be waiting for something else.
The most likely causes of performance issues within an SQL Server are:
- Disk subsystem: It is indicated by high disk queue length, low CPU usage, and high page life expectancy.
- Memory: It is indicated by high disk queue length on the system disk, reduced buffer cache hit ratio, and reduced page life expectancy.
- CPU: It indicates high CPU, low disk queue length (less than one per spindle), and high page life expectancy.
- Network: This is often misreported. If the SQL Server is slow to respond and the SQL counters are low, network latency could be the cause. It could also mean that there is a deadlock chain and the process causing the deadlock is "sleeping", for example, AX has locked the record, while communicating with an unresponsive service.
If a counter indicates high usage for the AX server, it is either badly written code or the server is underpowered. Adding a second AOS may not solve the issue, as code is not load balanced. If this is caused by a batch task running on an AX Server to which users connect, you should consider installing a dedicated AOS for batch tasks (which is the best practice anyway).
One of the main reasons to enable Bind parameters was to take the SQL statement into SQL Management Studio in order to determine its execution plan.
Do not try and use the DELETE or UPDATE statements. Even though we don't need to execute the statement in order to gain the execution plan, we will have to use the live database to gain an accurate plan. Not only is there very little we can do to improve the UPDATE statements, but also there is the risk that we could execute the statement by mistake.
The SELECT statements are safer, and while checking the resultant execution plan, we are looking primarily for:
- Table scans (unless the table has few records)
- Clustered index scans
As a lower priority, we are looking for index use and the corresponding bookmark lookups. It is ideal to always use clustered index seeks and, less ideally, index seeks. Table or clustered index scans are bad and indicate incorrect indexing on the table or out-of-date data statistics.