
Charts are an easy mechanism of visually analyzing data patterns and providing deeper insights into the performance of your marketing activities. Microsoft Dynamics CRM 2013 has out-of-the-box marketing charts created based on some of the trending needs for marketing data analytics. Charts also provide the drill down feature enabling the users to select a chart section and further investigate the records by selecting a drill down field and the chart type.
In conjunction with Microsoft Dynamics CRM Views, charts allow users to visualize the data from multiple dimensions. Also, the same chart can be used with various views by keeping the visualization static but feeding variable data to charts from different views.
The following screenshot shows some of the predefined charts that help analyze your marketing campaigns:
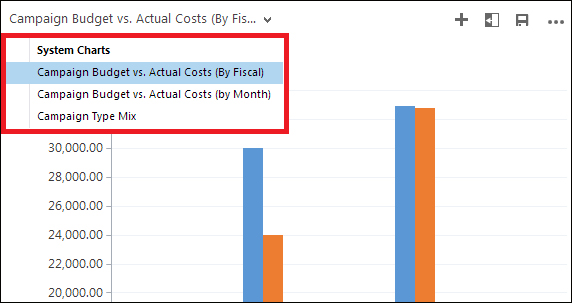
The campaign budget versus actual costs chart provides a comparison analysis of the original planned budget for the campaign against the actual costs incurred. You can explore the details either by the fiscal year or month.
Views and charts together provide great freedom to the users to slice and dice the data at various levels and visualize it from multiple angles. The views and charts can also be integrated into dashboards, which provide instant access to the user to gather real time information. We will explore more on dashboards later in this chapter.