
Dashboard is an intuitive and powerful visualization technique that provides a real-time graphical view of the relevant information, enables users to monitor critical metrics, and helps them make the right decisions at the right time. The marketing management can extensively use dashboards to keep track of their marketing programs; the real time visualization of the key parameters enables them to measure the effectiveness and make quick corrections to their programs in order to have them aligned to the marketing strategy.
The dashboard's visibility can be personal, selectively shared, or organization wide. This provides the user with the ability to only expose relevant information to other users, in order to help them focus on the right information. Dashboards should be carefully designed keeping in mind the relevance of information. The dashboard showing the marketer's pending activities may not be relevant to the senior management and the CXOs, as they would mainly be interested in seeing a broad summary and the overall picture.
Dashboards in Microsoft Dynamics CRM 2013 are a combination of various charts, views, HTML web resources, reports, and IFrames that are organized into various sections to display relevant information. Designing dashboards requires a deep insight into the data to understand what is truly important in order to choose the right metrics for display without overwhelming the user with too much information.
The following are some of the key factors to be taken into consideration while designing dashboards:
- The intended user
- The source and the type of information
- Choosing appropriate views and graphical visualizations
One of the key factors to be taken into consideration is the intended user of the dashboards. Dashboards designed for individuals and teams can have low-level detail that help them with their daily tasks and activities, whereas the reports for the senior management and high-level decision makers would be at a summary level, providing an overall view in a monthly or quarterly timeframe.
The source and type of information also need to be taken into consideration when designing dashboards. The data within the CRM application can be exposed using views, charts, and reports. External data can be directly integrated into the dashboard using IFrame or by creating custom HTML web resources. It's important to consider the level of detail required to decide whether we should show actual records in a view or rollup the data to show trends and comparisons using graphs for a bigger picture.
Intuitive visualization of data is another key to creating a successful dashboard. The list of pending activities can simply be formed using a custom view, but when we are tracking the progress and looking at changing trends, a line graph is considered ideal. Bar graphs are great for comparisons, and pie charts are best used to describe the share of the whole. The drill down feature helps us to investigate the actual records that are being rolled up in the graph. It's good to have the drill-down feature in the reports and charts developed for use with dashboards.
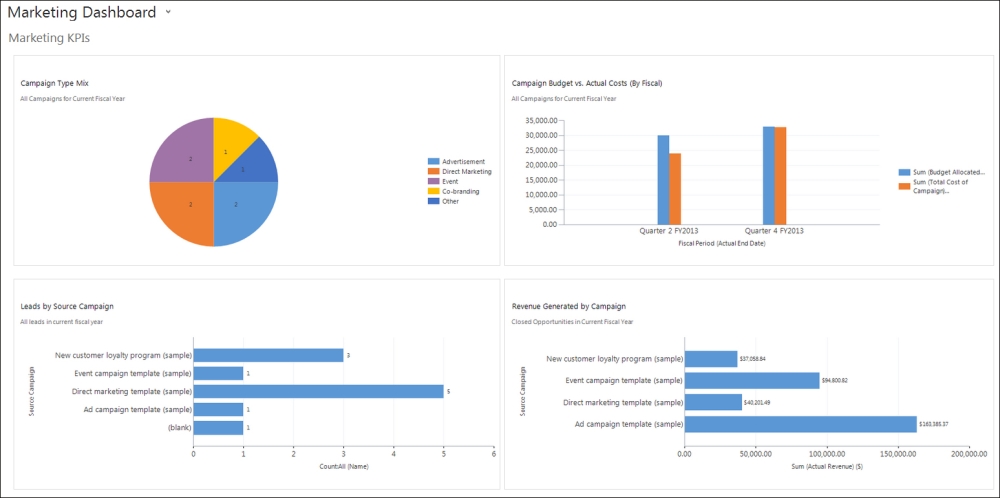
Marketing Dashboard in Microsoft Dynamics CRM displays Campaign Type Mix, Campaign Budget vs. Actual Costs, Leads by Source Campaign, and Revenue Generated by Campaign along with the list of activities and campaigns, as shown in the following screenshot:
We will now explore the goal management features in Microsoft Dynamics CRM 2013, which can be used to track the performance of the marketing team against various marketing metrics.