
12
Gaining Insights through Moodle Reporting and Analytics
Moodle collects usage data from various activities from when users log in until they log out. This data can be utilized for a range of reporting and analytics activities, all of which will be dealt with in this chapter.
To get an overview of the topics that will be covered, have a look at the following diagram:
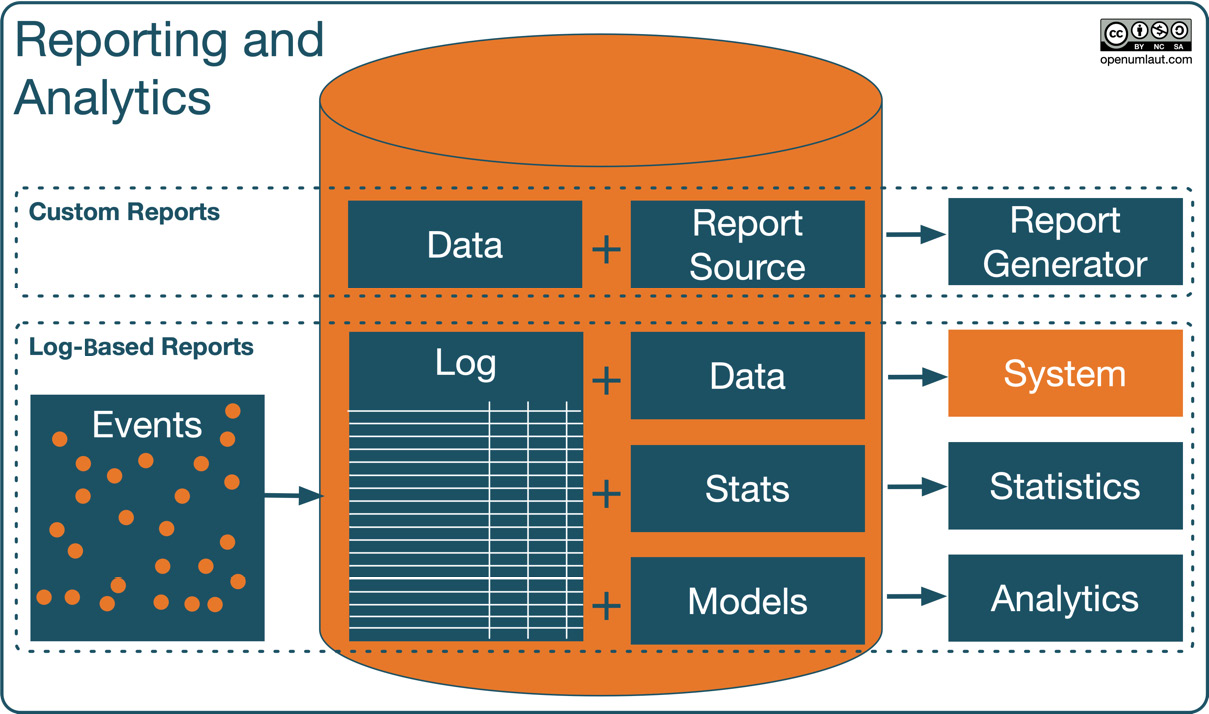
Figure 12.1 – Reporting overview
There are two types of reports in Moodle: custom reports created with the report generator and log-based reports, hardcoded in Moodle.
The first part of this chapter will provide an overview of the report generator and cover data sources, report building, report audiences, and schedules. We will also briefly cover a more technical third-party report generator: Configurable reports.
The second part of this chapter deals with log-based reports. After a detailed overview of the underlying Moodle logging framework and its components, events, and log stores, you will learn how to interact with Moodle logs.
Finally, we will deal with two more reporting techniques that use logs as their basis: Moodle statistics and Moodle analytics.
We won’t cover system reports in this chapter – that is, reports that deal with a particular topic; they will be dealt with when the relevant topics are covered. For instance, backups reports will be described in Chapter 16, Avoiding Sleepless Nights – Moodle Backup and Restore.
In this chapter, we will cover the following topics:
- Creating custom reports with the report generator
- Understanding Moodle’s logging framework
- Interacting with log-based reports
- Gathering statistics
- Making predictions with Moodle Analytics
OK, let’s start with the first part of this chapter and create custom reports with the report generator.
Creating custom reports with the report generator
The report generator was initially implemented as part of Moodle Workplace, Moodle’s powerful and flexible learning platform for corporate training and workplace learning. Due to its popularity in Moodle’s commercial edition and its applicability across sectors, it was decided to port the report generator to Moodle 4. The stripped-down version has been adopted by Moodle and has proven to be a valuable addition to creating custom reports.
So, before we deal with data sources and report building, let’s explore the report generator.
Exploring the report generator
You might not have realized it, but you have already used reports in the previous 11 chapters! How? Well, Moodle has done something very smart: it uses internal reports for key features in Moodle. For example, the list of certificate templates in the Skills and incentives section in Chapter 9, Configuring Educational Features, is a report. The report on config changes? You guessed it, yet another report. Every time you see a table list view in any Moodle tool, it is likely to be a built-in system report.
Moodle distinguishes between two types of reports:
- Internal reports: Embedded, predefined reports that are part of Moodle. Internal reports cannot be modified or removed since Moodle relies on them.
- Custom reports: User-generated reports made available to other users.
This section exclusively deals with custom reports, so let’s see how Moodle’s report builder works. The following diagram illustrates the high-level elements of the reporting workflow:
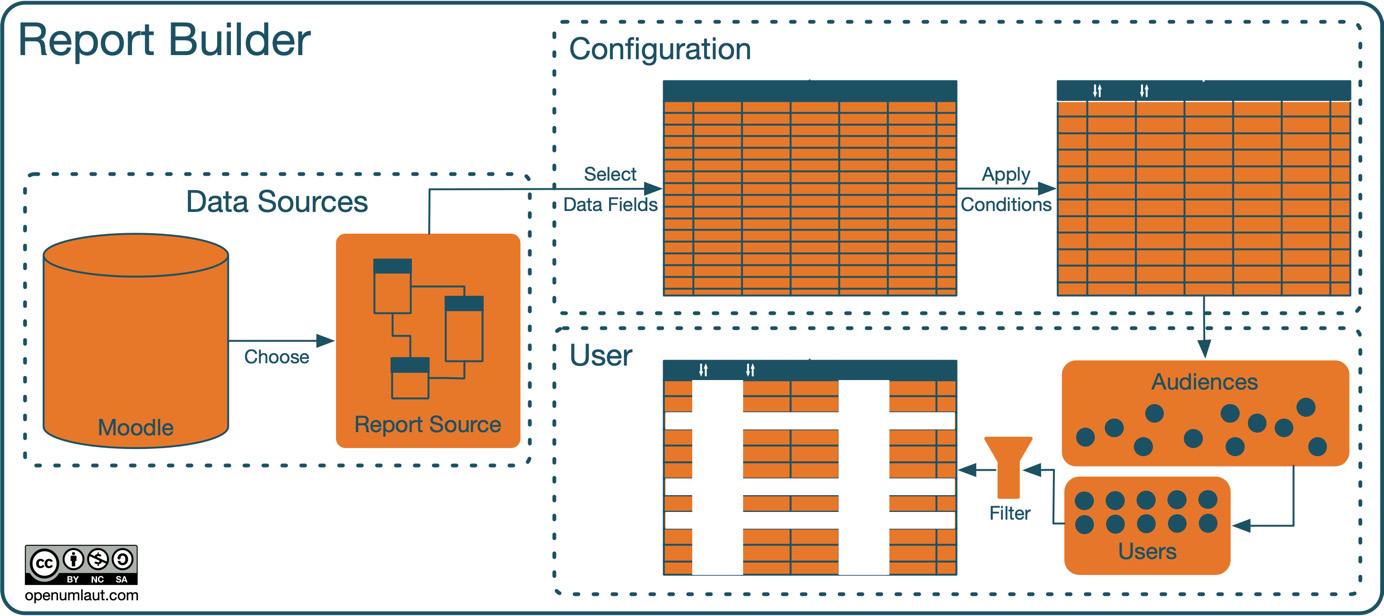
Figure 12.2 – Report builder workflow
Moodle stores its data relevant to reporting in the Moodle database. External data sources might be added in future versions, but at the time of writing, this is the only data source available.
The most flexible reporting tool would let you select individual fields from every entity in the underlying database. However, this would require users to be familiar with the entire database model, which contains well over 100 tables and even more relationships among them. Instead, Moodle offers some report sources to simplify the usage of the report builder.
Important note
A report source contains a predefined set of fields and relationships available when building a report.
Based on the selected record source, a certain amount of data will be available, which can be reduced by the following mechanisms: Selecting data fields lets the report creator decide which columns are being made available – for example, student name, course name, and completion status. Applying conditions lets the report creator decide which rows will be made available – for instance, all records from a particular faculty. Access to reports is granted via audiences – for example, all users with the Manager role or all users who are members of a particular cohort.
The report viewer can then reduce the amount of data further via filters. A filter, which has to be configured by the report creator, allows you to select one or more criteria – for instance, by course category or by country.
Important note
A report isn’t static; it is an interactive view of your data.
The following subsections are dedicated to each building block of the reporting workflow. Let’s start with the first part of the diagram: data and report sources.
Selecting data and report sources
In this subsection, we will deal with the input options for the report builder – you will learn what they are and when to use each option.
The database is the underlying data source where Moodle stores its data. Courses, users, course completions, grades, and other data – such as information about learning resources added by authors, forum posts contributed to by learners, and system settings configured by the administrator – are mostly stored in the database.
A report source implicitly defines which elements (tables and relationships) of the data source will be used in a report. The set of available report sources includes data such as user profile information, course data, or cohort membership. Additional report sources can be created by Moodle developers programmatically, and the number of record sources is expected to go up in upcoming releases.
Before exploring the report builder, ensure the Enable custom reports setting is enabled under Site administration | General | Advanced features.
Let’s look at the report sources available in Moodle to date. You can manage reports via Site administration | Reports | Report builder | Custom reports, where you will see a list of available reports – actually, what you will see is a report. A report of reports! In our example instance, we have already created some reports, as shown here:
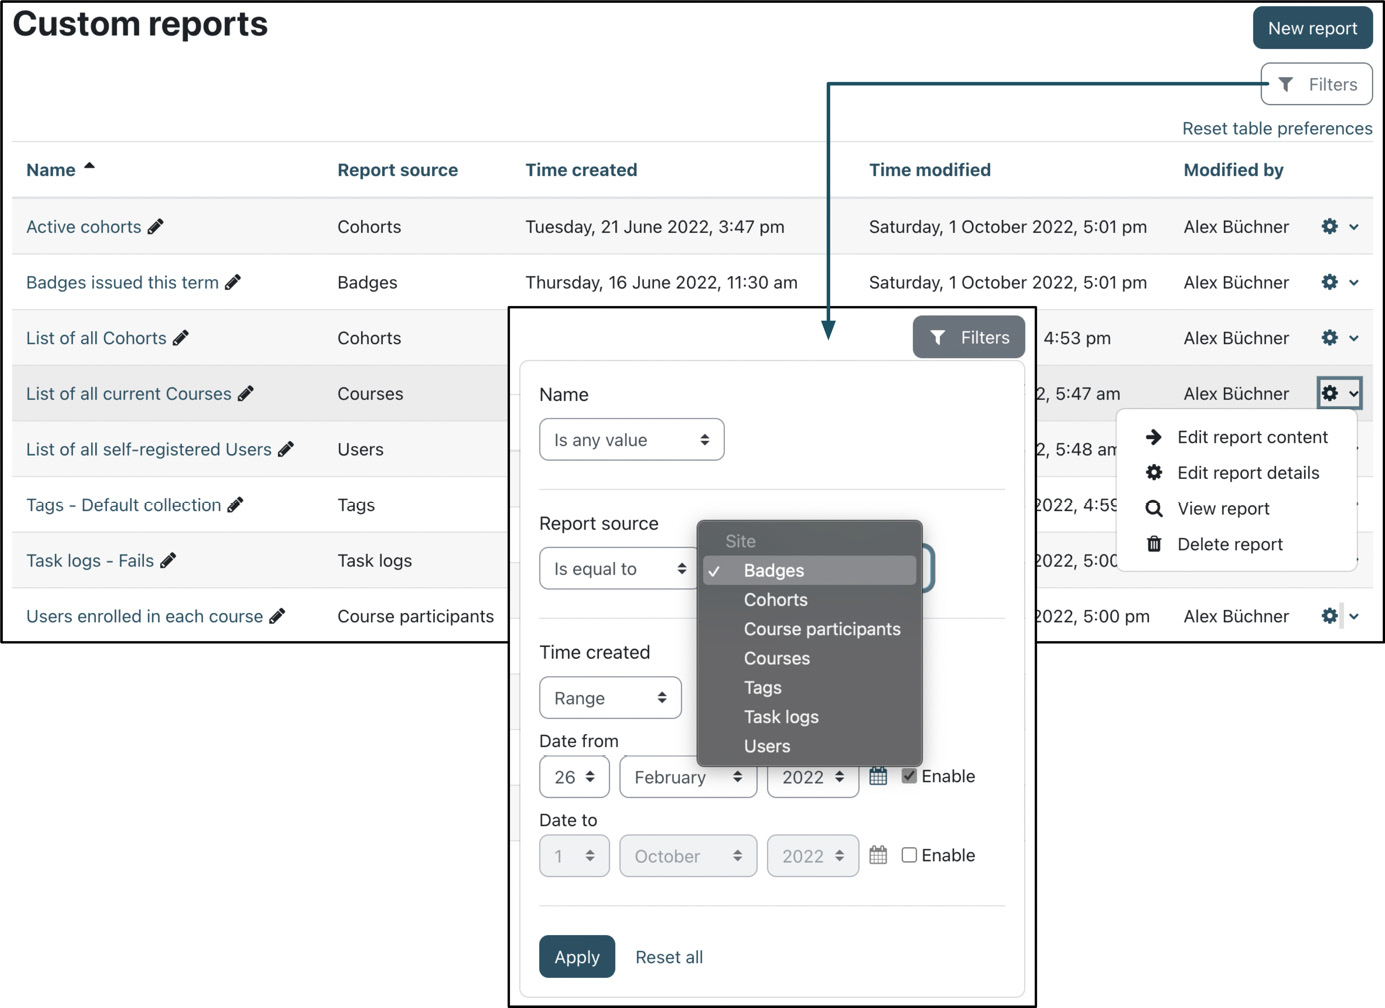
Figure 12.3 – Custom reports and filters
The self-explanatory fields shown in the report table are Name, Report source, Time created, Time modified, and Modified by. The standard actions available are Edit report content, Edit report details, View report, and Delete report. There are filters available on the right-hand side that let you limit the number of reports shown by Name, Report Source, and Time created.
Important note
Each report has one report source.
The selected report source cannot be changed once a report has been created. To use a different report source, a new report must be created.
Select the New report button on the Reports page to create a new report. You will then be greeted with a pop-up screen, as shown here:
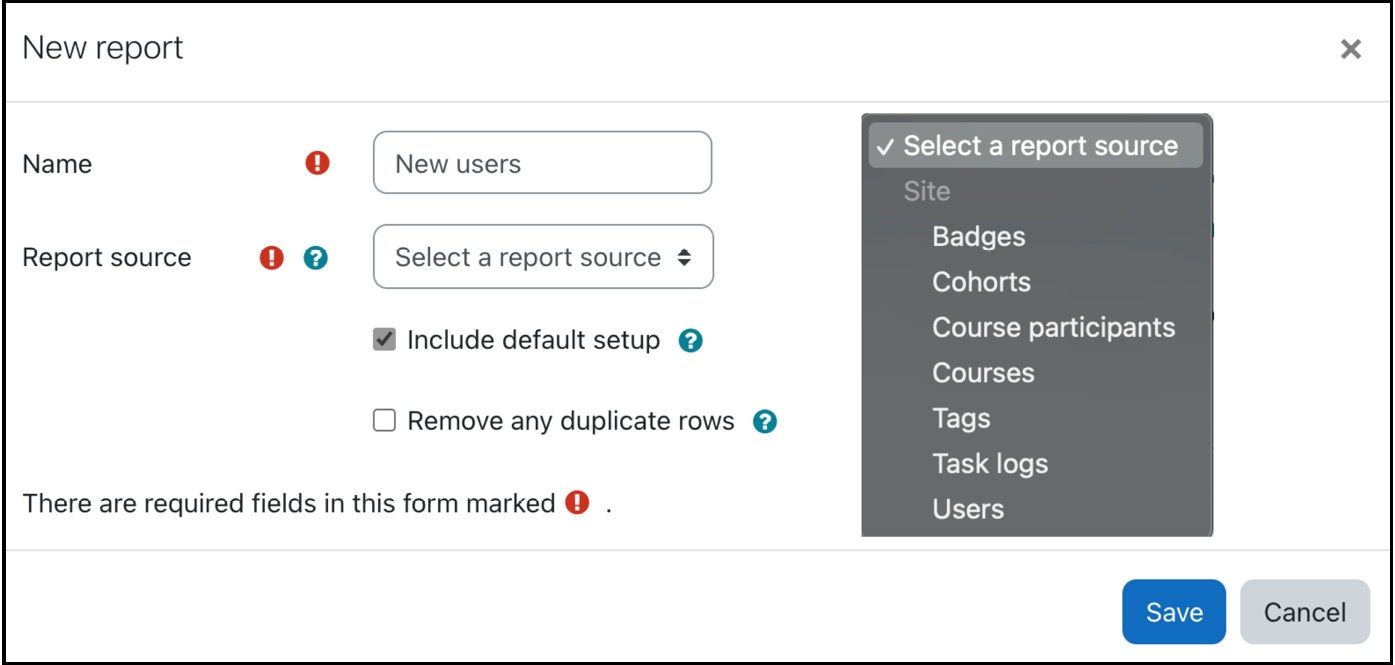
Figure 12.4 – Creating a new report
A report contains the following two compulsory settings: Name (displayed whenever the report is made available to users) and Report source (defines where the data for the report will come from). The following report sources are currently available in Moodle:
- Badges: Badge details linked to recipients (users) and courses
- Cohorts: Cohort data and user membership details
- Course participants: Courses, users, and their enrolments and course completions
- Courses: Course and category details
- Tags: Tags and tag categories
- Task logs: Data regarding scheduled and ad hoc tasks
- Users: User details
The following report sources are already in the pipeline and are likely to be available by the time you read this book: Notes, Blogs, Groups, Comments, and Files. Existing report sources may also be extended by adding more data fields, relations to other entities, conditions, and filters.
There are two more settings when creating a new report that require some attention:
- Include default setup: When enabled, the report will already be populated with several predefined columns, conditions, and filters. When you get started, it is recommended that you leave this option ticked since it simplifies the process of building reports, which we will cover next.
- Remove any duplicate rows: When enabled, any duplicate rows will be removed from the report.
By default, there is no limit to the number of reports you or anybody with the reportbuilder:edit (edit your own custom reports) or reportbuilder:editall (edit all custom reports) capabilities can create. If you need to restrict the number of custom reports, go to Site administration | Reports | Report builder | Custom report settings and adjust the Custom reports limit setting accordingly.
Another setting on the same screen that potentially improves performance is Custom reports live editing. If disabled, the preview of data while editing the report will be deactivated; otherwise, it will be kept up to date:
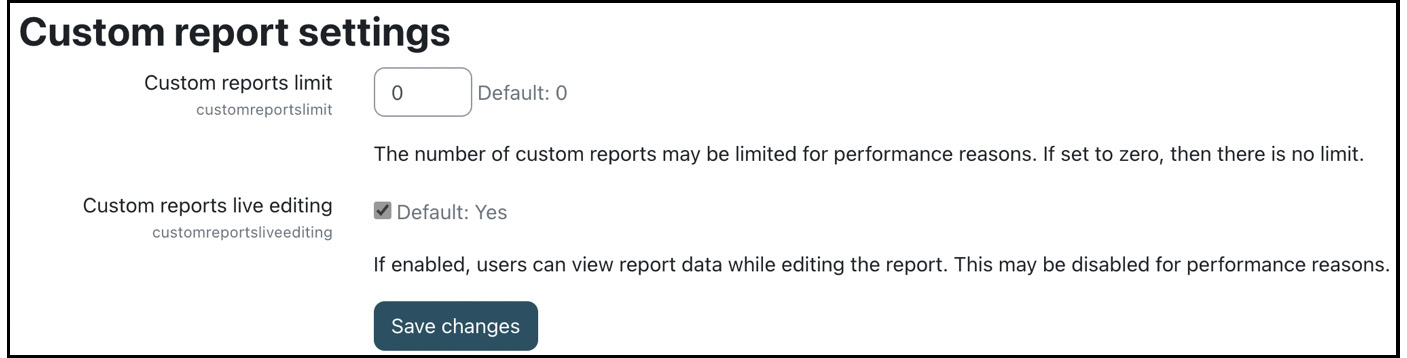
Figure 12.5 – Custom report settings
When you Save the report, you will be redirected to the actual report builder, which we will cover next.
Building reports
In this subsection, we will deal with the various facilities the report builder has to offer. You will learn what these are and how to apply them in real-world scenarios.
The report generator allows you to build and customize reports with drag and drop, instant preview, inline column editing, grouping, and aggregation. The following annotated screenshot shows the key elements of the Moodle report generator:
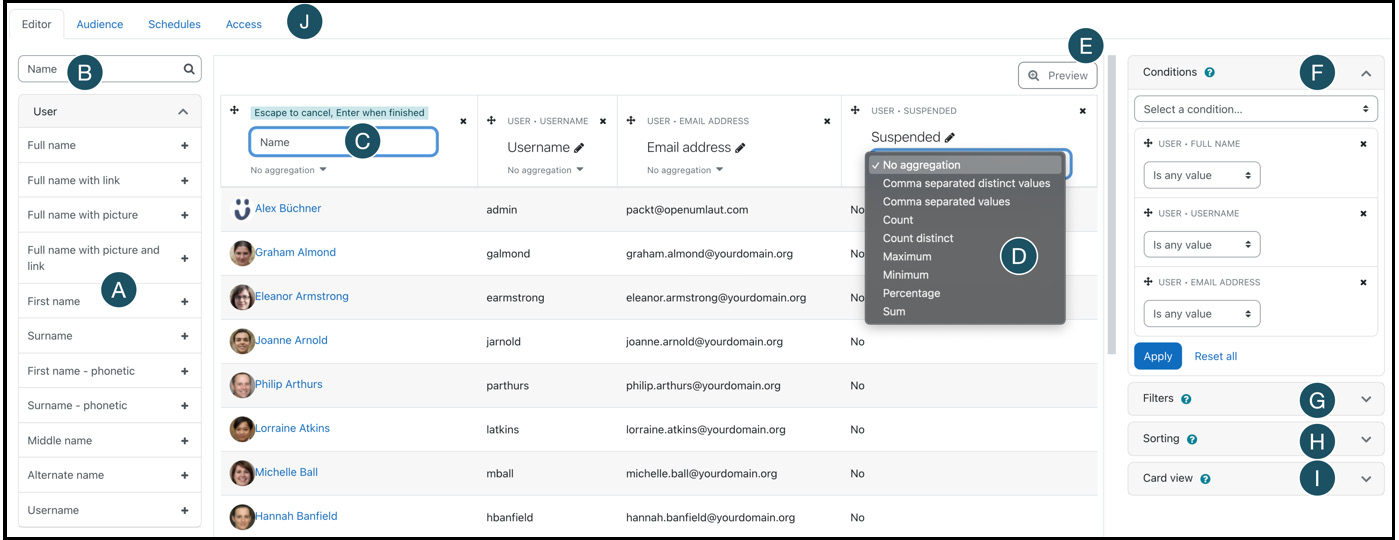
Figure 12.6 – The report builder interface
The following actions are available in the report generator:
- A – Data fields panel: List of data fields, grouped by entities
- B – Data fields panel: Live search fields
- C – Preview panel: Inline editing of column names and headings
- D – Preview panel: For selecting the field aggregation method
- E – Preview panel: Preview toggle
- F – Settings panel: Conditions
- G – Settings panel: Filters
- H – Settings panel: Sorting
- I – Settings panel: Card view
- J – Report builder menu: Access to report tabs
For the database boffins among you, it might be helpful to map the report elements to their SQL counterparts:
- Selected data fields: SELECT … FROM …
- Conditions: WHERE
- Aggregation and grouping: GROUP BY
- Sorting: ORDER BY
Now that you have had a first glimpse of the report creation interface, let’s look closely at the various elements, which can be grouped into two categories: configuring fields (columns) and configuring settings (rows).
Configuring fields (columns)
This subsection deals with available options to customize the columns in a report.
In the left-hand side panel of the Moodle report generator, you will see all available fields for the selected report source, which have been grouped into entities. Each entity can be expanded or collapsed for better usability. You can also search for field entries to limit the number of displayed items. These items have been labeled A and B in the previous screenshot.
To add columns to the report, click on the selected field on the left list. The column will be added automatically as the rightmost column in the table. You can then rearrange the column order via the standard Move handle. To remove a column, click on the standard delete icon.
Two field types are available that can be added as columns to a report:
- Text fields: For example, surname, department, or course name
- Image fields: For example, user picture or badge image
Most text fields reflect a value from the underlying Moodle database. However, some text fields are preprocessed by the report generator to support additional functionality:
- Hyperlinked text fields: Mainly to directly view data entries – for example, to a user profile or a course
- Calculated text fields: To provide a numeric value – for instance, the number of courses in a category
- Grouped text fields: To provide multiple data points as a single cell – for example, the members in a cohort
Custom fields, such as custom user profile fields or custom course fields, are fully supported by the report generator. They will appear in the list of available fields, just like any built-in variable.
One of the most powerful features of the report generator is its support for aggregation. Have a look at the following three reports, all with the same fields but different aggregation methods applied to the Badge recipient column:
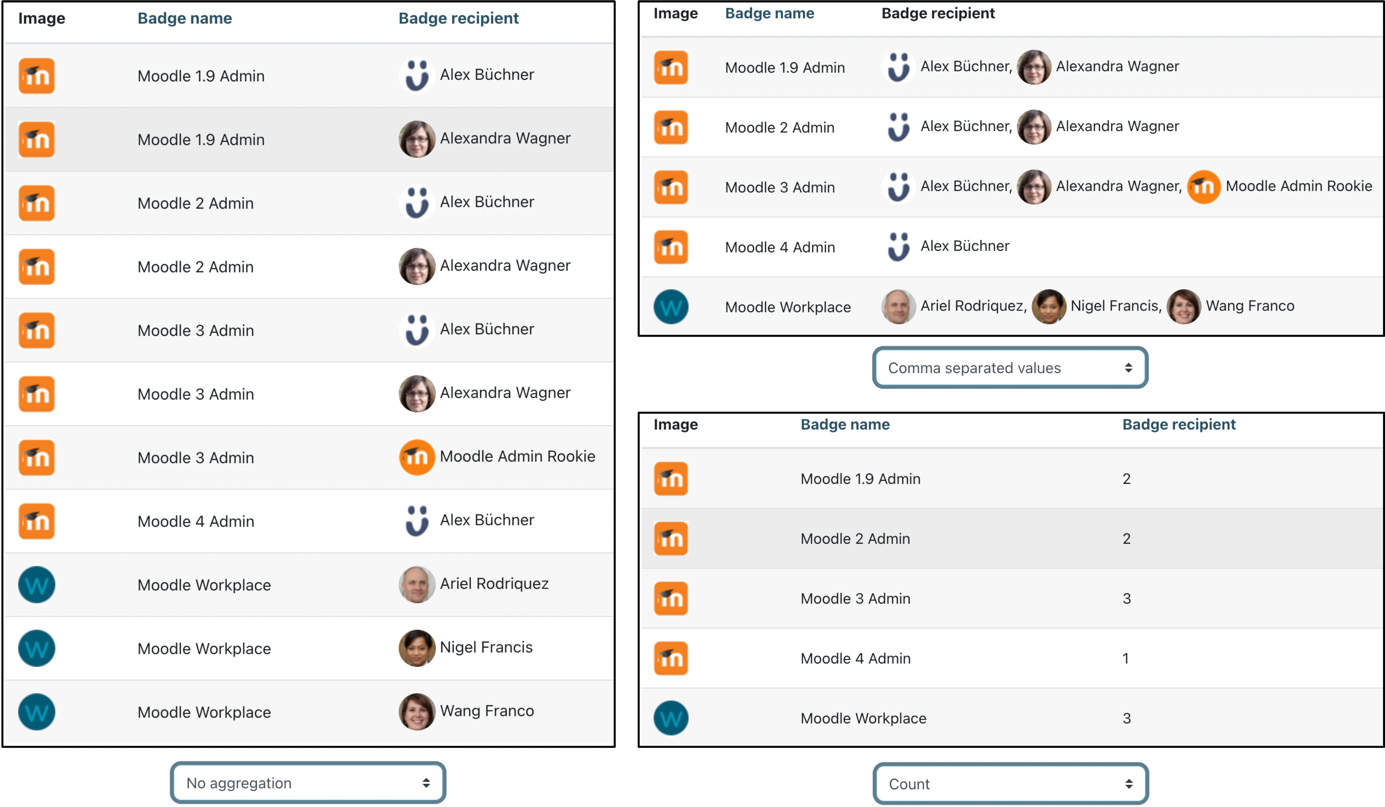
Figure 12.7 – Aggregation
In the first report, No aggregation has been applied, so all data entries are shown. In the second report, the Comma separated values option has been selected, which displays multiple usernames in a single cell. In the last report, the Count method was chosen, which shows the number of recipients per badge.
Depending on the data field selected, different methods are at your disposal, as shown in the following table, including the SQL function used internally:
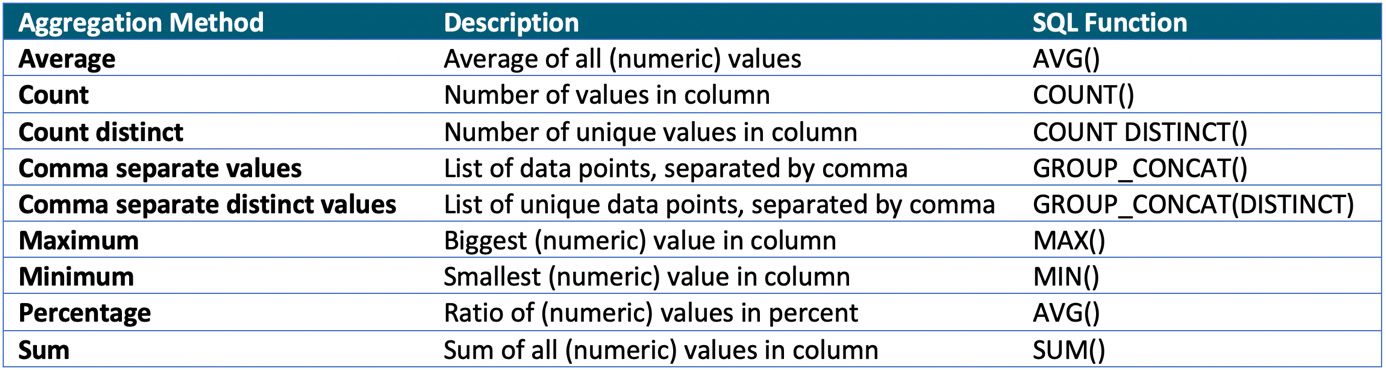
Figure 12.8 – Aggregation operations
An aggregate function calculates a set of values and returns a single value. For example, Count takes a list of values and returns – you guessed it – the number of items. The Remove any duplicate rows setting has no effect if columns are aggregated.
Using the Course participants record source in conjunction with aggregation methods, you can create powerful reports, such as the following:
- Number of users enrolled in each course: Course full name (No aggregation), User Full name (Count)
- Users enrolled in each course: Course full name (No aggregation), User Full name (Comma separated distinct value)
- Number of completions of each course: Course full name (No aggregation), Course completion (Distinct count)
There is no system behind what methods are available for which field type. For each data field, a set of possible aggregation methods is offered by Moodle.
Viewers also have the option to download the table data in various formats, namely CSV, XLSX, HTML, JSON, ODS, and PDF. You can reduce or rearrange the options in that list by going to Site administration | Plugins | Data formats | Manage data formats. The XLSX format is useful for visualizing data using Excel’s charting tools.
Now that we have exhausted all the options for customizing columns in a report, let’s look at how to configure the second dimension in a table: rows.
Configuring settings (rows)
This subsection deals with the available options for customizing or limiting the rows in a report. This can be done via the Settings panel on the right-hand side, where you can access the Conditions, Filters, Sorting, and Card view accordion panels. These configuration options will be described in the following four subsections.
Conditions
Conditions let you limit the amount of data that is being presented to the report viewer. For example, you might want to exclude any suspended users from your reports.
Important note
Conditions are a predefined set of criteria that are always applied when viewing a report. Conditions cannot be changed in viewing mode.
Depending on the selected report source, the list of available conditions might differ slightly from the list of available fields.
An interesting condition available in most report sources is Select user, which has three options:
- Any user: All users are shown.
- Current user: The report only shows data about the report viewer. Using this powerful mode, you can create reports that display personalized data, depending on who is viewing the report. For example, if you wish to create a report showing the progress of the report viewer in each course, select the Course full name and Student progress fields and set the Select user condition to Current user. When students view the report, they will only see the progress in the courses they are enrolled in.
- Select: The same principle as Current user, but you can select one or many users.
Two more conditions let you select values: Select course and Select category, including an option to View all subcategories.
Filters
The following two screenshots show configuring filters (left) and what the first three entries look like from a user’s perspective when viewing the report (right):
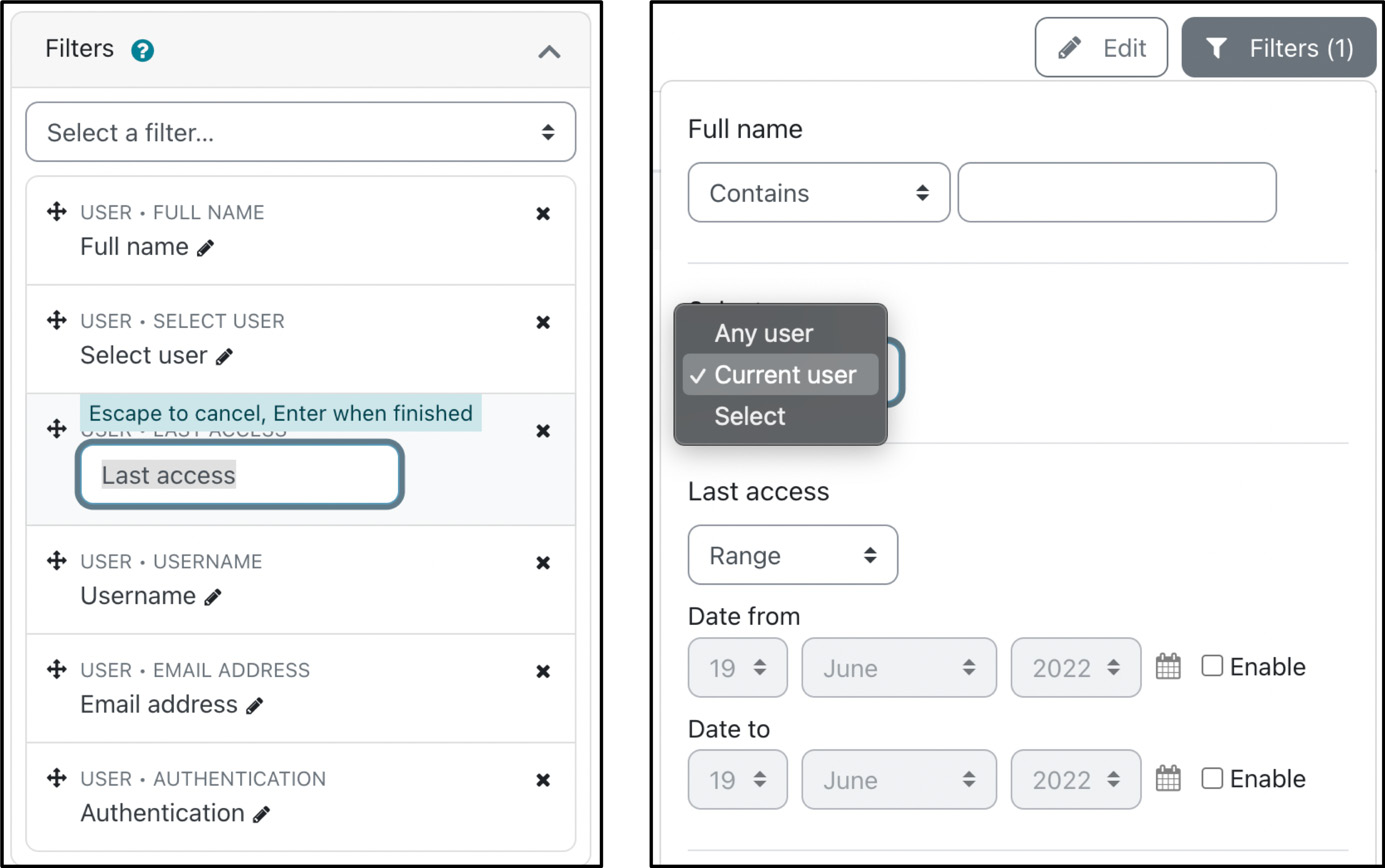
Figure 12.9 – Report filtering
We described the Current user option in the Select user filter, which creates a unique report for each viewer. This type of filter also impacts reports created automatically and sent out to users via schedules (see the Scheduling reports section further down).
You can add as many filters as you wish. Furthermore, the list of filters is not limited to the fields shown in the report. For example, in a user report, you might add a filter to narrow the search down to individual authentication methods, even though the field is not available in the report itself.
Sorting
The penultimate of the four settings deals with the order in which the data is presented.
Important note
Sorting defines the initial order in which the fields are being ordered.
In the following screenshot, the data is ordered by Category name (in ascending order), Course short name (in descending order), and Course full name (in ascending order):
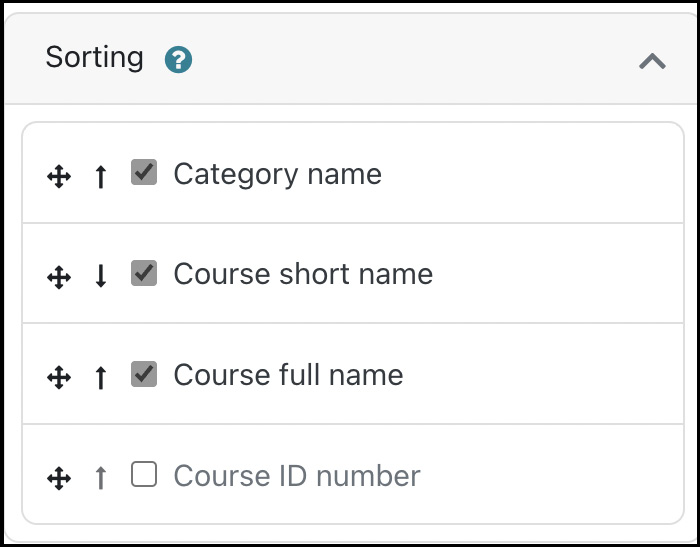
Figure 12.10 – Report sorting
When in viewing mode, the preceding order will initially be applied. Once a user clicks on a column name, the data will be sorted by this field; the sort order will be reversed when the same column is clicked again.
Card view
The card view feature supports responsive layout design in the report builder. Card view allows you to configure the report layout for narrow views when the block is in the sidebar or a smaller device is used. A report will automatically switch to card view when displayed on small screens.
Report audiences
Report audiences indicate which users have access to the report. They can also be used as recipients in scheduled reports. To access audiences, select the Audiences tab of a report, where you can create the following audiences:
- All users: Use this audience to give access to all users
- Assigned system role: Select at least one system role
- Manually added users: Select at least one user (via name or email address)
- Member of cohort: Select at least one cohort
- Site administrators: Moodle admins – that is, you and everybody who is also an admin
To confirm which users now have access to the report, switch to the Access tab, which is, as you might have guessed by now, yet another system report. Now that we know who has been granted access to the report, let’s configure when a report is sent to the specified audiences.
Scheduling reports
By default, all reports are available as pull reports; that is, users have to select and view a report proactively. This section provides instructions on configuring the automatic delivery of reports via the report scheduler, known as push reports. Having users log in to see a report is less effective than having the report land directly in their inbox.
To access the scheduler, select the Schedules tab of a report. And yes, the list of schedules is yet another system report with a predefined filter:
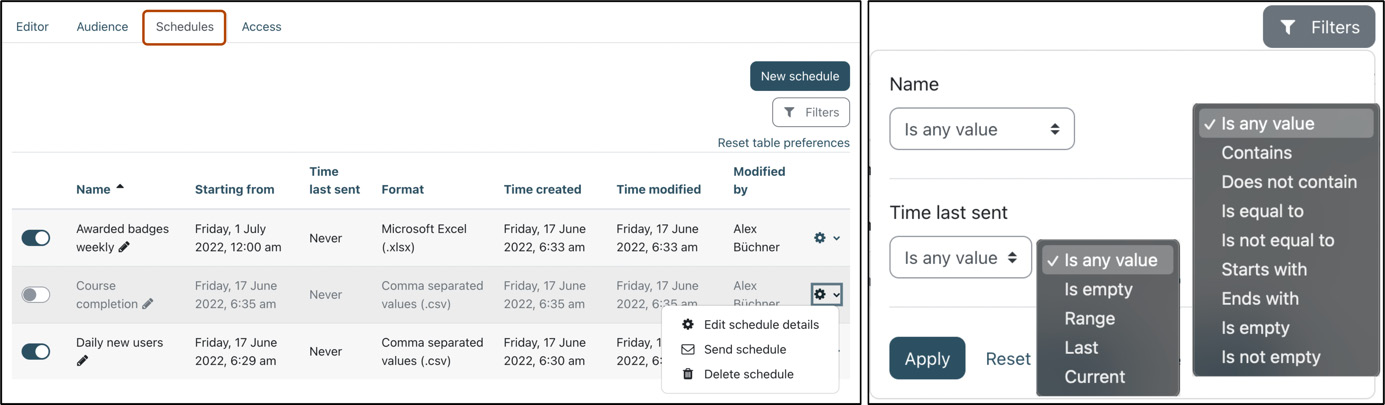
Figure 12.11 – Scheduling reports I
Select the New schedule button at the top right to create a new report schedule. You will then be presented with a pop-up window containing the following four sections:
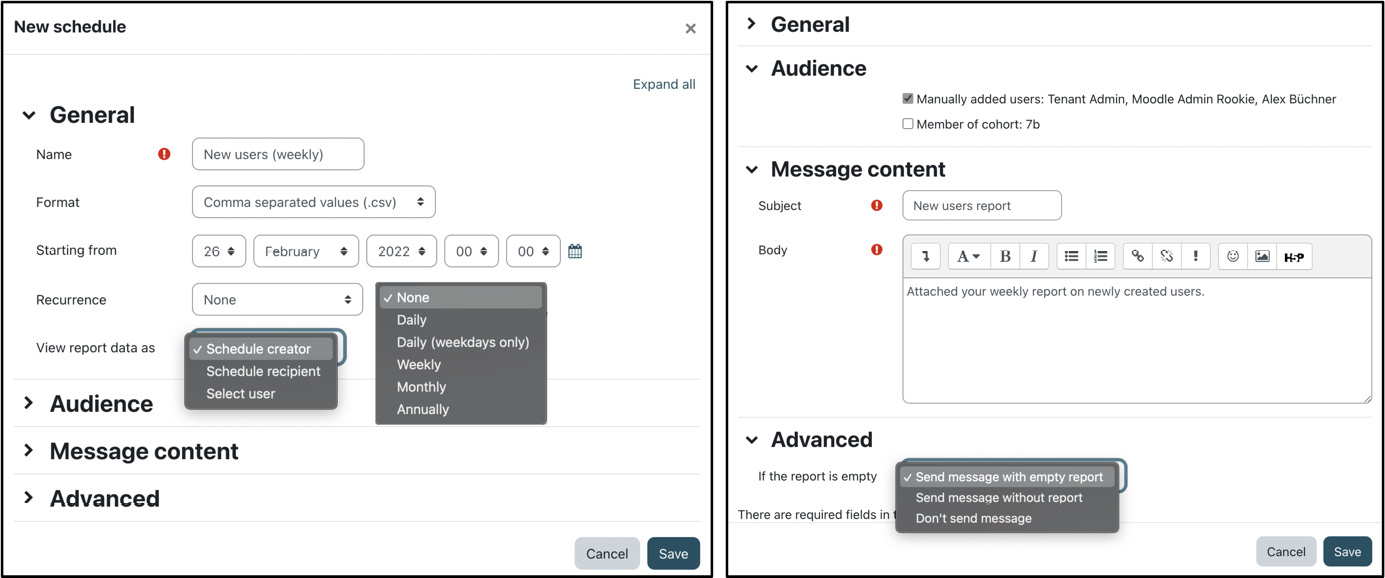
Figure 12.12 – Scheduling reports II
These four sections contain the following settings:
- The General part of the screen contains information about the schedule, including what report to send, in which format the report should be sent, and the timing settings.
Name is only used in the list of schedules. The Format dropdown lets you pick the file format of the report. The options are CSV, XLSX, HTML, JSON, ODF, and PDF. You can reduce or rearrange the options in that list by going to Site administration | Plugins | Data formats | Manage data formats.
The Starting from setting specifies when the report will be sent for the first time. The Recurrence option lets you specify whether the report should be sent once (None) or frequently. The repeating options are Daily, Daily (Weekdays only), Weekly, Monthly, and Annually. The cron process triggers the execution of the report being sent.
The last setting in this section is View report data as, which has three options: Schedule creator, Schedule recipient, or Select user. If a user or the schedule creator is selected, the attached report data will be included as if viewed by this masquerading user; that is, all recipients will receive the same report. If left empty, the report’s recipient will be used; individual reports will be sent out, depending on how the report has been configured. The reportbuilder:scheduleviewas capability determines whether reports can be scheduled to be viewed as others.
- In the Audience section, you specify who the recipients are. You need to select at least one audience, as specified previously. If no audiences have been specified yet, a warning will be shown.
- The Schedule section contains the custom message, which includes the two standard elements of any email message: Subject and Body. At the time of writing, no placeholders are supported, so you will have to tailor the message text accordingly.
- In the Advanced section, there is only a single option, which lets you specify what happens If the report is empty. The self-explanatory options are Send message with empty report, Send message without report, and Don’t send message (default).
With that, we have provided an overview of the report generator, a potentially powerful tool for generating custom reports. However, it has some limitations, which we will discuss in the following section.
Report generator limitations and an alternative
The report builder is a powerful tool for creating reports based on predefined report sources. At the time of writing, the number of report sources available is rather small, but it is expected that this limitation will change in the very near future. Moodle Workplace (docs.moodle.org/en/Report_builder) already contains significantly more report sources than Moodle, so watch out for new sources being added soon.
We mentioned earlier that the report creator’s main advantage is that you don’t have to be familiar with Moodle’s underlying database schema. However, some administrators find the concept of report sources too restrictive and wish to create more flexible reports. Configurable reports (moodle.org/plugins/block_configurable_reports) is a popular third-party plugin for Moodle, which appears as a block once installed. The plugin supports the following five types of reports:
- Course reports: Reports that use course data
- Category reports: Reports that use category data plus optional embedded course reports
- User reports: Reports that use user data and their course activities
- Timeline reports: Reports across time for courses, users, and their activities
- SQL reports: Any valid SQL statement can be used to query the Moodle database
Depending on what type of report has been chosen, different selection criteria (fields, conditions, ordering, and calculations) are offered. Additionally, filters for drill-down can be specified, the layout can be created, and permissions for who is allowed to run the report can be set. Furthermore, the plugin can plot different types of graphs.
The unique feature of Configurable reports is that you can create reports based on Custom SQL. If you are familiar with the SQL language and the underlying Moodle database schema, you can add queries, such as the one shown in the following screenshot arrangement:

Figure 12.13 – Configurable reports sample
In the preceding screenshot, you can also see a link to List of SQL Contributed reports, which is a very good starting point for creating reports (this is where I got the SQL query of the sample report).
This concludes this section on custom reporting based on Moodle’s report builder, where we covered the tool’s workflow, the available data sources, and configuration. In addition to creating flexible custom reports, Moodle ships with several predefined reports that make use of the logging framework, mentioned in this chapter’s introduction.
Understanding Moodle’s logging framework
Moodle has a powerful built-in logging framework that is, as expected, fully customizable and extensible. The idea behind the logging mechanism is as follows:
- A user performs an action that triggers an Event. An example is a student who posts a reply on a forum.
- The Log manager entity monitors the event and decides whether it will be logged or ignored. Site-wide log manager settings determine this behavior.
- The log manager sends the data to the active Log store plugin, which filters or enriches the information. The passed-on data might be augmented with an IP address and a timestamp.
- The data is then written to the configured Log store.
The top half of the diagram shows this logging workflow:
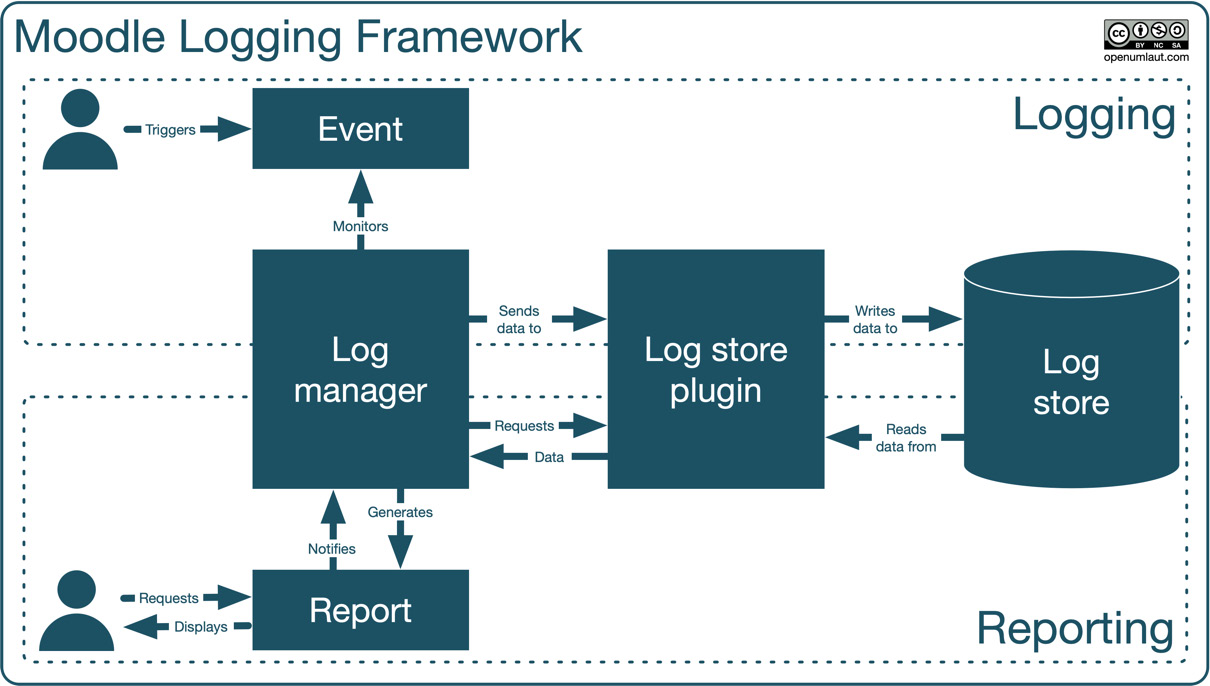
Figure 12.14 – From events to reports
Now, let’s take a look at what happens when a user requests a report, which is represented in the bottom half of the diagram:
- The reporting module notifies the log manager, who passes on the request to the log store plugin. If more than one log store has been set up, the user must select one.
- The log store plugin reads the relevant data from the log store and passes it back to the log manager.
- The report module generates the report, which is then displayed to the user.
Now, let’s look at the individual components of Moodle’s logging framework in more detail, starting with events.
Understanding events
Two closely related elements deal with events in Moodle – the events list and event monitoring rules:
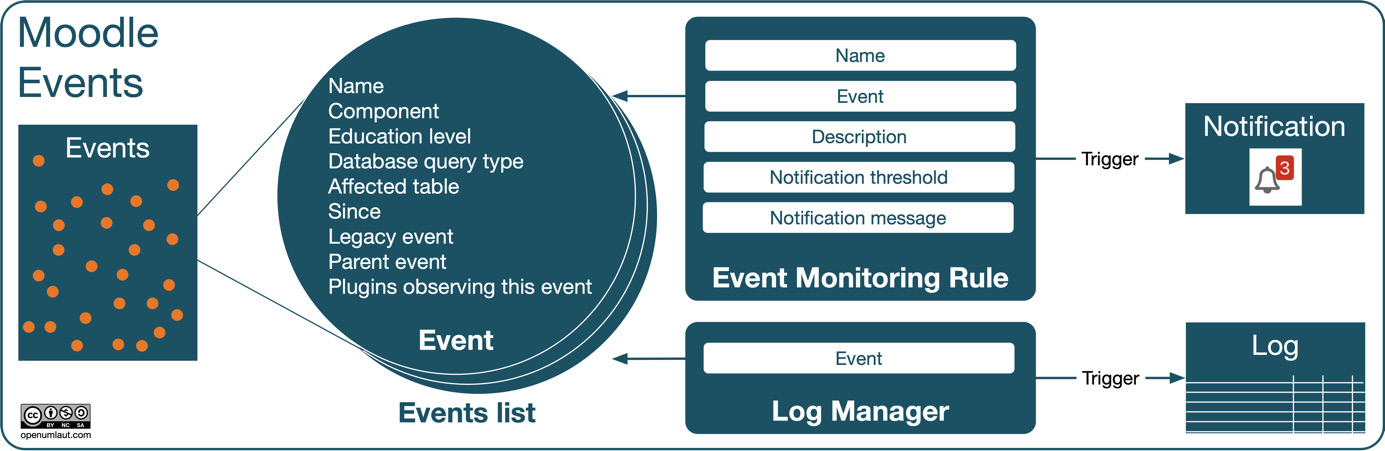
Figure 12.15 – Events, events list, and event monitoring rules
These concepts have been illustrated in the preceding diagram and will be described in detail in the remainder of this subsection, starting with the events list.
Events list
Most actions in Moodle trigger an event. You can look at the list of all the available events by going to Site administration | Reports | Events list. This list will grow over time, with internal and external events being added. Each event comprises the following elements:
- Event name: The name of the event and a unique internal identifier
- Component: The Moodle component that the event belongs to; for instance, Core, a course module, or some other part, such as statistics or logs
- Education level: There are three levels: Participating, Teaching, and Other
- Database query type: Four query types can occur, namely create, read, update, and delete (CRUD)
- Affected table: The database table that is being affected
- Since: The Moodle version when the event was introduced
- Legacy event: The event that was triggered in the legacy log store (this only contains events from version 2.6, when events were introduced)
The following screenshot shows some events filtered by user:
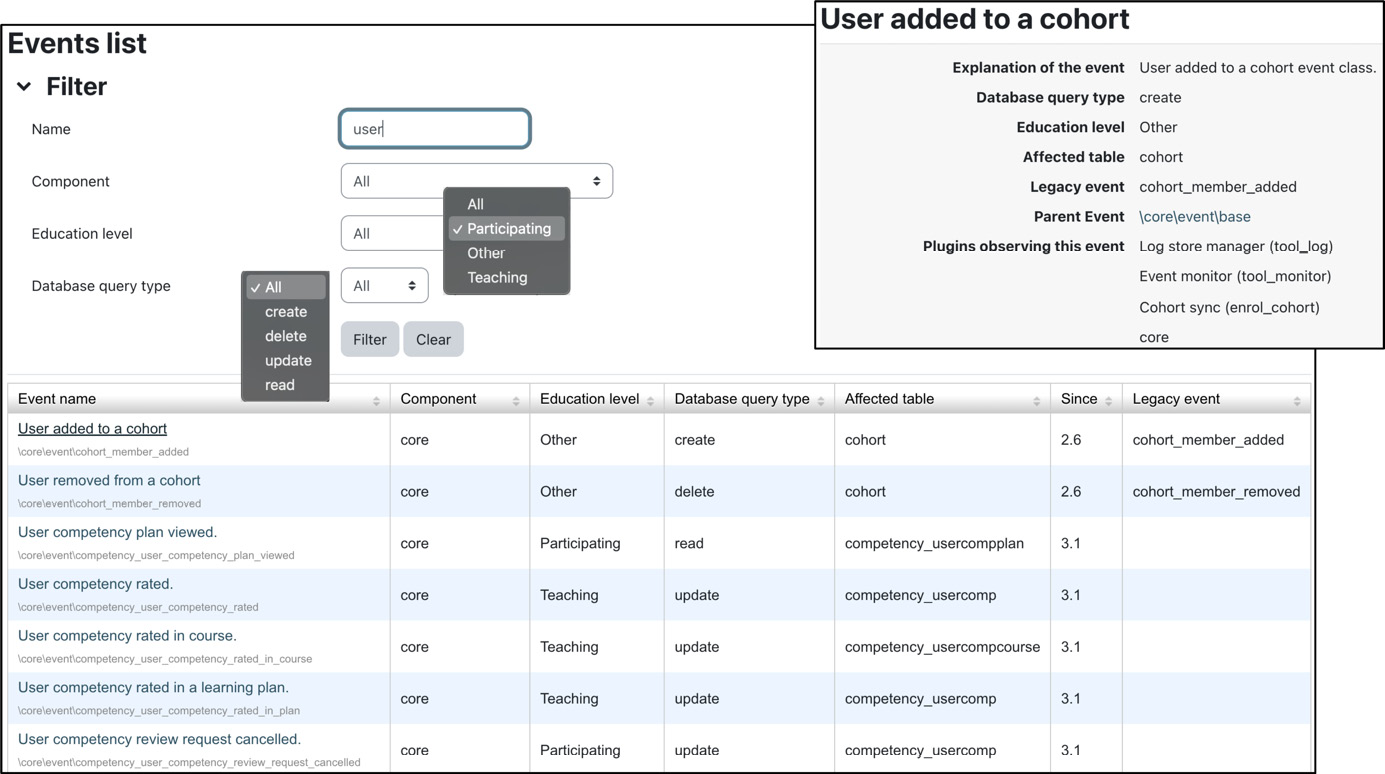
Figure 12.16 – Events list (filtered by user)
You can filter the list by Name, Component, Education level, and Database query type. You will see a more detailed presentation of the same information by clicking on an event name. In the screenshot arrangement, we have selected the User added to cohort event. In addition to fields already familiar from the events list, the screenshot shows two additional items of information:
- Parent Event: Internally, events are organized hierarchically, but the information is relevant mainly to developers.
- Plugins observing this event: These are the plugins that monitor the event. Here, we have a log store manager (tool_log); the event monitor itself; the Cohort sync module, which ensures that every time a user is added to a cohort, they will also be enrolled in linked courses; and the core system itself.
The information about events is for administrators, mostly for information purposes. However, it is relevant when setting up event monitoring rules.
Event monitoring rules
Administrators (and users with the tool/monitor:managerules capability) can define events that you can subscribe to. These patterns of activities are represented as rules that contain an event as well as a frequency. Once such a pattern has been detected, an event will be triggered, sending a message to all subscribers.
While users with editing teacher rights can set up their own rules at the course level, you, as the administrator, are more likely to define a set of required rules to which educators will subscribe.
First, you must enable event monitoring by navigating to Site administration | Reports | Event monitoring rules.
Let’s add our first event rule via the Add a new rule button. Once you have entered Rule name, select Area to monitor. The values in the list are identical to those you came across in the Component dropdown, as seen in the preceding events list. Once chosen, the Event list will be populated with all the available events that the component supports. The description is optional, but it is recommended that you provide this for potential subscribers. The Notification threshold … in minutes combo specifies the number of events within a specified period that are required for the Notification message property to be sent. The body of this message can include any or all of the placeholders explained in the sample message text shown in the following screenshots:

Figure 12.17 – Events monitoring rules and subscriptions
Any user with the tool/monitor:subscribe capability can subscribe to event rules via the Event monitoring link in the Miscellaneous section under Preferences. Once an event rule has subscriptions, rules editing is limited.
Before subscribing to a course, you must Select a course that is monitored (Site covers all courses). From now on, a notification message will be sent when the subscribed rule is triggered.
Now that we have covered events in detail, let’s have a look at the logging components of our diagram.
Logging and log stores
Logging involves three components: the log manager, log store plugins, and physical log stores.
The log manager is an internal component that monitors events and passes data to all enabled log store plugins. Moodle comes with a predefined log manager; however, this may be replaced by other log manager plugins in the future. For now, as an administrator, you have no means of configuring the log manager itself.
A log store plugin is associated with a physical log store and determines what data is stored and read. Navigate to Site administration | Plugins | Logging | Manage log stores to see Moodle’s three core log store plugins: Standard log, External database log, and Legacy log. We will ignore legacy logs as they will be discontinued over time.
The standard log store has replaced the legacy log; it supports all new logging concepts and provides better performance. In its Settings, you can specify whether to Log guest access, whether to store in JSON format (instead of serialized PHP), how long to Keep logs for, and its Write buffer size.
You can configure an external database log store if you wish to write logging information to a database separate from Moodle. This additional data storage is useful if you wish to collect data for more detailed analysis or data warehousing operations. This is shown in the following screenshot:
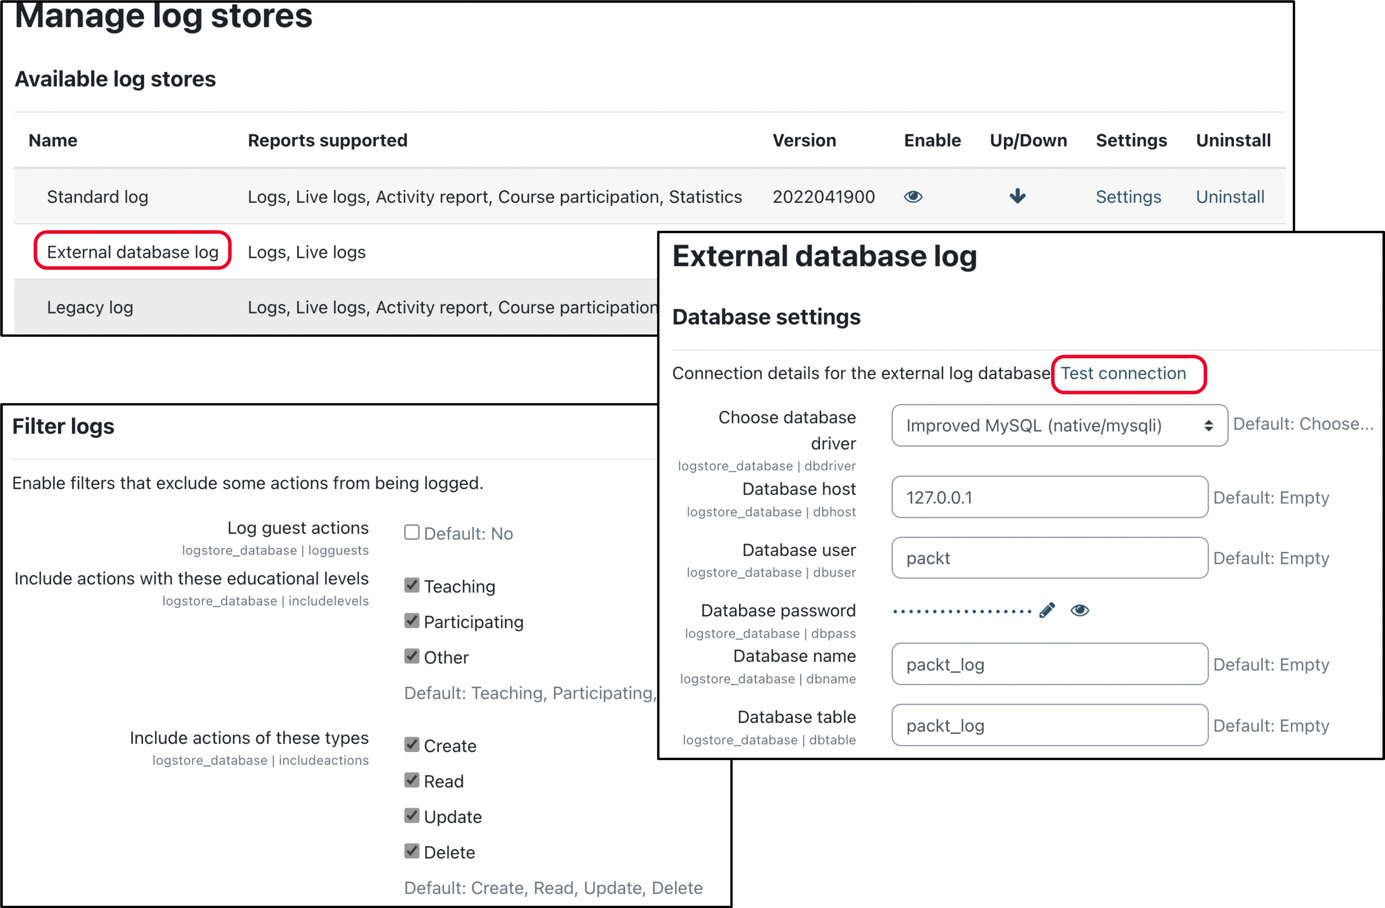
Figure 12.18 – Configuring the external database log store
By default, the same databases are supported as when we installed Moodle. The database host, user, password, and name settings are identical to the ones we covered in Chapter 1, Installing Moodle. Additionally, you have to specify a Database table, the structure of which has to be identical to the one stored in mdl_logstore_standard_log. Ensure you test the connection (the link is at the top of the screen); if successful, the check will display the columns that the external table contains. You can also specify various settings for a persistent database connection if you have a lot of logging traffic on your site and performance is an issue.
Now comes the exciting part of the external log store plugin. You can specify filters, which will then be applied when storing the data:
- Log guest actions: This tells you whether guest actions are stored or not. Usually, this is not required unless you wish to log all users’ traffic.
- Educational levels: These are the three types that we came across in the events section, namely Teaching, Participating, and Other.
- Database query types: These are the four CRUD types we came across in the events section, namely Create, Read, Update, and Delete.
Filtering logs is useful when privacy regulations do not allow you to store actions of certain users or types (refer to Chapter 14, Complying with Data Protection Regulations) and when reporting from the log store does not require specific actions; this will also have a beneficial impact on performance.
Important note
External database logs supplement the standard log, not replace them. Disabling the standard log will cause log-based system reports to malfunction.
You can add additional log stores from moodle.org/plugins/?q=type:logstore. An interesting option is Logstore xAPI, which emits xAPI statements (also known as Tin Can) to an LRS of your choice.
This concludes this subsection on logging components, which covered the log store manager, log store plugins, and the log store itself. The last element in our process diagram covers log-based reports, which we will cover next.
Interacting with log-based reports
There are two types of built-in reports in Moodle: ones supplied with data from a log store and others generated on the fly without log store input. You can view the list of reports by going to Site administration | Plugins | Reports | Manage reports, as shown in the following annotated screenshot (the icons on the left indicate whether it is a course, system, or another type of report):
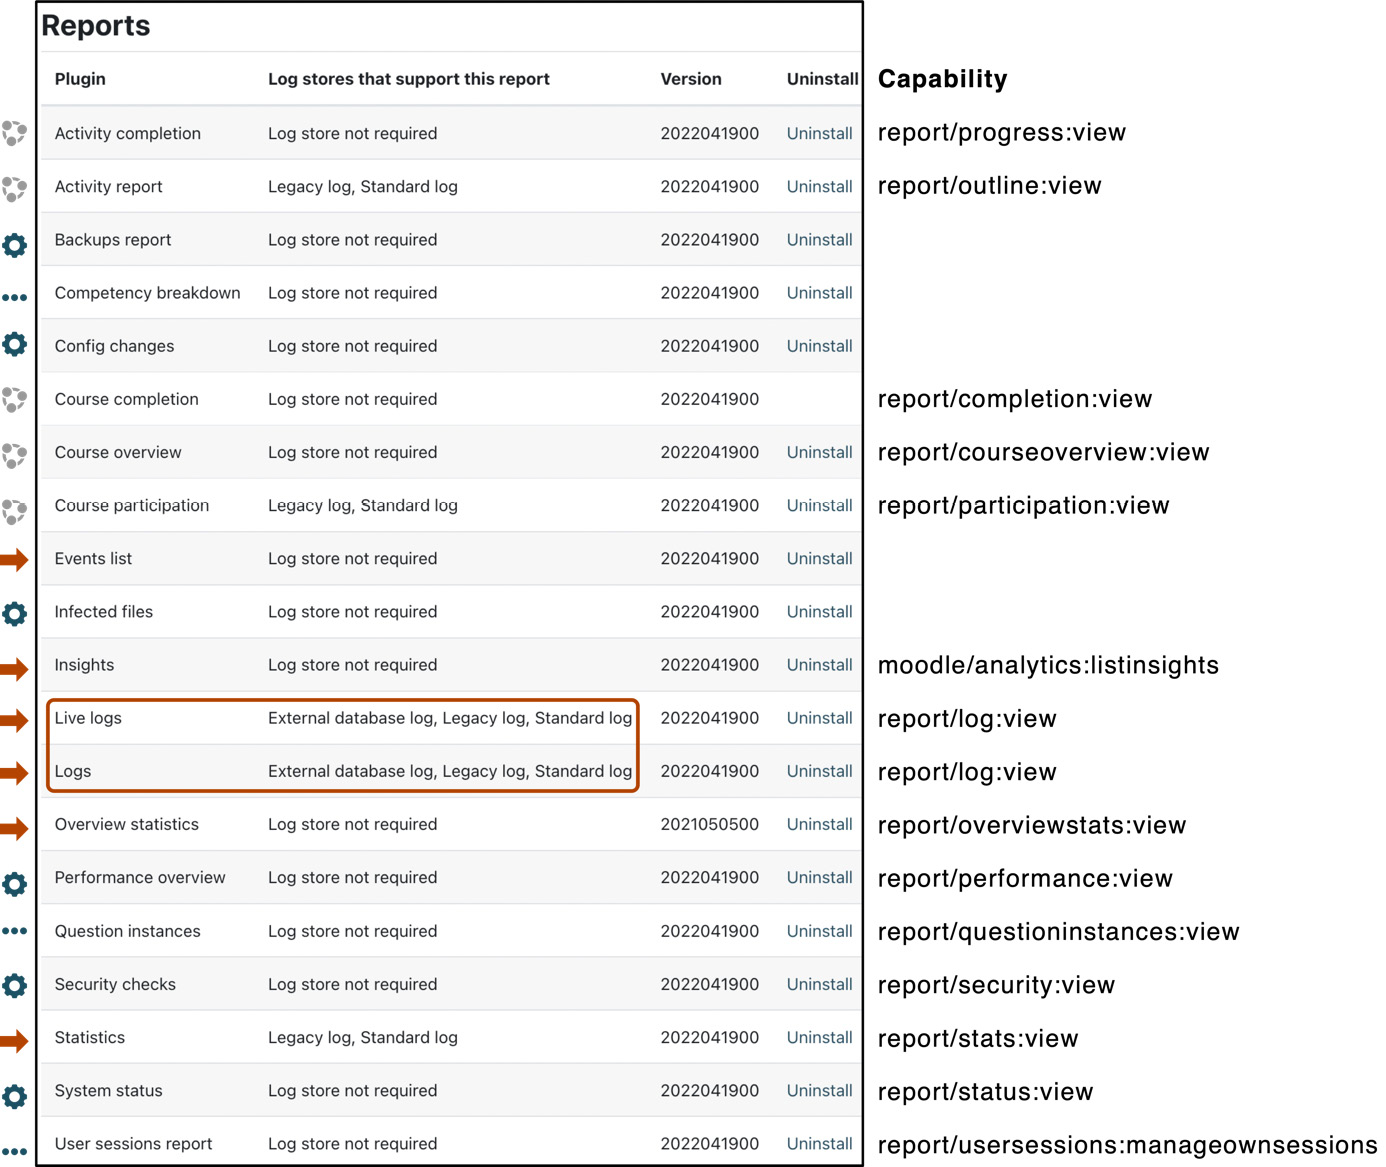
Figure 12.19 – System reports
Here, you can see when a report requires a log store and, if so, which ones are supported. We will focus on (live) logs since they form the basis for log-based reporting, before moving on to statistics and analytics.
Remember that most information you retrieve from log-based reporting is also available to teachers at the course level. While educators use this information mainly in a pedagogical context (to monitor progress and measure performance), your role as an administrator is to view this data in a site-wide context. Furthermore, you are the one who is likely to be approached if any claims, problems, or other anomalies occur, for example, if a student insists on having submitted an assignment that is not on the system or a teacher is unable to log in from home. Given the sensitivity of such data and your organization’s policies, access to some operations has to be deactivated via roles and capabilities (added to the right of each report, if available).
Depending on your setup and configuration, Moodle records a detailed log of each action that users perform. By default, each record (or hit) in the standard log contains data about the following:
- Who (user)
- What (action)
- When (date and time)
- Where (IP address)
Site-wide logs can be accessed by going to Site administration | Reports | Logs. At the top of the page, you can interactively drill down to the data via filters, which is useful if you need to locate data about an individual, an activity, or a course. For example, if pupils claim that they have submitted an assignment, which cannot be located, the tracking log will be able to shed light on this. The available filters are as follows:
- Courses: Select a specific course or the entire Moodle site (site logs).
- Groups: Select a specific group or All groups. This filter is only displayed if group mode is enabled in the selected course.
- Participants: Select a specific user or All participants.
- Date: Specify a particular day or all days of activity. Unfortunately, it is not (yet) possible to specify date ranges.
- Activities: Select whether you wish to run a report of All activities or Site errors – this list changes when a course has been selected.
- Actions: You can choose among All actions, Create, View, Update, Delete, and All changes.
- Educational levels: You can choose from All events, Teaching, Participating, and Other. We came across the latter three options when looking at events.
- Log store: If more than one log store has been set up, you must select the one from which the data is being read.
Once you have selected a course and clicked on the Get these logs button, the content in each dropdown menu changes context-sensitively. For example, the Participants menu contains all the names of users who have a role in the course, and the Activities menu is populated with activities and resources. If you watch Moodle’s submenu, you will see what happens internally. Moodle temporarily redirects the reporting tool inside the selected course where the course log viewer is called, which is identical in appearance. Once you have selected your filtering criteria, a report is displayed, as follows:

Figure 12.20 – Log data
This tabular information is displayed in the reverse order of a user’s access date and time; that is, the last hit is displayed first. The columns of the table represent the following information:
- Time: Date and time of the hit.
- User full name: Name of the user – if a particular user is selected, the same value will be displayed in each row.
- Affected user: This will display if the action impacts another user.
- Event context: The context in which the event has been triggered. A link directs you to the context, for instance, a course.
- Component: The event component (refer to the Events section earlier in this chapter).
- Event name: The event that has been triggered. When selected, a pop-up window containing the event will open.
- Description: A short description of what the user has been doing – this is very useful for seeing what resources are being accessed or checking whether an individual has viewed a course. Internal IDs are used, such as user ID, course ID, or forum ID.
- Origin: Indicates whether the hit came from a CLI script (cli), a restore operation (restore), Moodle itself (web), a web service (ws), or any other origin (other).
- IP address: The (unresolved) IP address; this is useful for identifying where the user accessed the page (for example, from home or within the organization).
At the bottom of the results page, you can download table data in several formats (CSV, XLSX, HTML, JSON, ODS, or PDF). You can reduce or rearrange the options in that list by going to Site administration | Plugins | Data formats | Manage data formats.
When you click on the IP address in the log, a new page will open that displays the registered location of the user’s IP as a pin on the world map (this is not the case for local or private IP addresses), as shown in the following figure:

Figure 12.21 – Geographical location of an IP address
The default lookup tool that’s used is called NetGeo (www.geoplugin.com). For more accurate results, you will need to install a local copy of the MaxMind GeoLite database (dev.maxmind.com) or specify a Google Maps API key. Both settings can be found in the IP address lookup section at Site administration | General | Location | Location settings.
Moodle provides live logs of activities in the last hour, which can be accessed by navigating to Site administration | Reports | Live logs. It is a prepared report that shows activities that took place in the previous 60 minutes; it is updated automatically every 60 seconds. You can Pause live updates via the button beside the log reader selector. Live logs are helpful if you have changed the configuration, for instance, an authentication or enrolment plugin, and want to ensure that it is working correctly. Alternatively, you can just sit back and watch what is happening on your site. The format of the screen is identical to the preceding standard log. Note that the first entry in the live log is you looking at the live log!
When selecting site errors from the activities dropdown menu, all the errors (mainly failed logins) are displayed. For example, the report that is shown in the following screenshot displays two invalid logins, as well as two failed attempts to send an email to users:
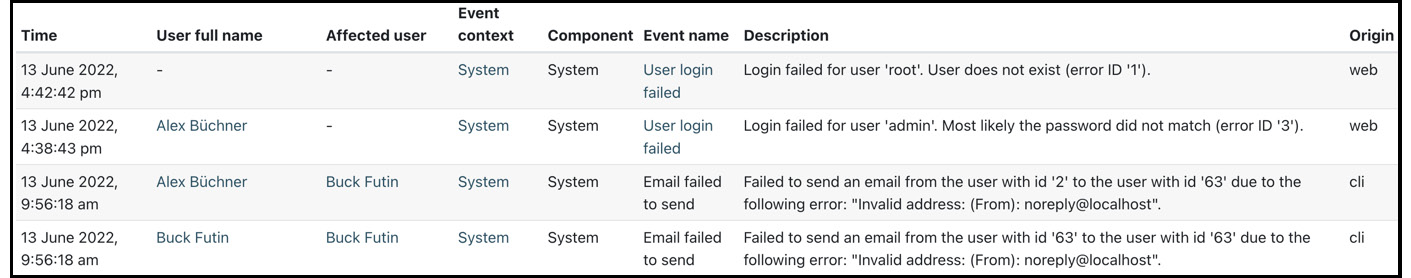
Figure 12.22 – Error log
It is a good practice to check the error logs regularly to identify problems on your site and potential unauthorized access attempts. These reports can also be set up to be sent by email to the site administrator (refer to Chapter 13, Ensuring Moodle Security).
You should now be equipped to interact with Moodle logs fully. Statistics has been mentioned a few times in this section; we’ll look at what statistical analysis Moodle supports and how we can benefit from it in the next section.
Gathering statistics
This section will teach you how to set up and interpret Moodle statistics.
Moodle has a built-in Statistics module, which is deactivated by default because the component is very resource-hungry in terms of disk space usage and, more importantly, memory usage.
Important note
Only use the Statistics module if you require the information and can accept some potentially significant performance reduction.
Select Enable statistics under Site administration | General | Advanced features and configure it by navigating to Site administration | Server | Statistics, where the following parameters are available:
- Maximum processing interval: After enabling the Statistics module, Moodle utilizes the logs to derive statistical information. Here, you need to specify the time that Moodle should go back by to gather the stats. Be aware that this is quite a resource-intensive operation.
- Maximum runtime: You can limit the time the statistics gathering process is allowed to run; this is another mechanism that helps you avoid putting too much burden on the system.
- Days to process: The number of days that will be processed in each statistics execution.
- User threshold: Here, the Statistics module can be instructed to ignore courses with less than a certain number of enrolled users.
Statistics calculations take place in the background via the core askstats_cron_task scheduled task. It is highly recommended that its execution time does not clash with the site backup as both operations are potentially very resource-intensive.
Let’s look at some statistics by going to Site administration | Reports | Statistics. Once you have selected Course, Report type (views, posts, logins, or all of these), and Time period, a graph and some tabular information will be displayed. The data that’s shown represents the number of hits on a particular day, broken down by roles:
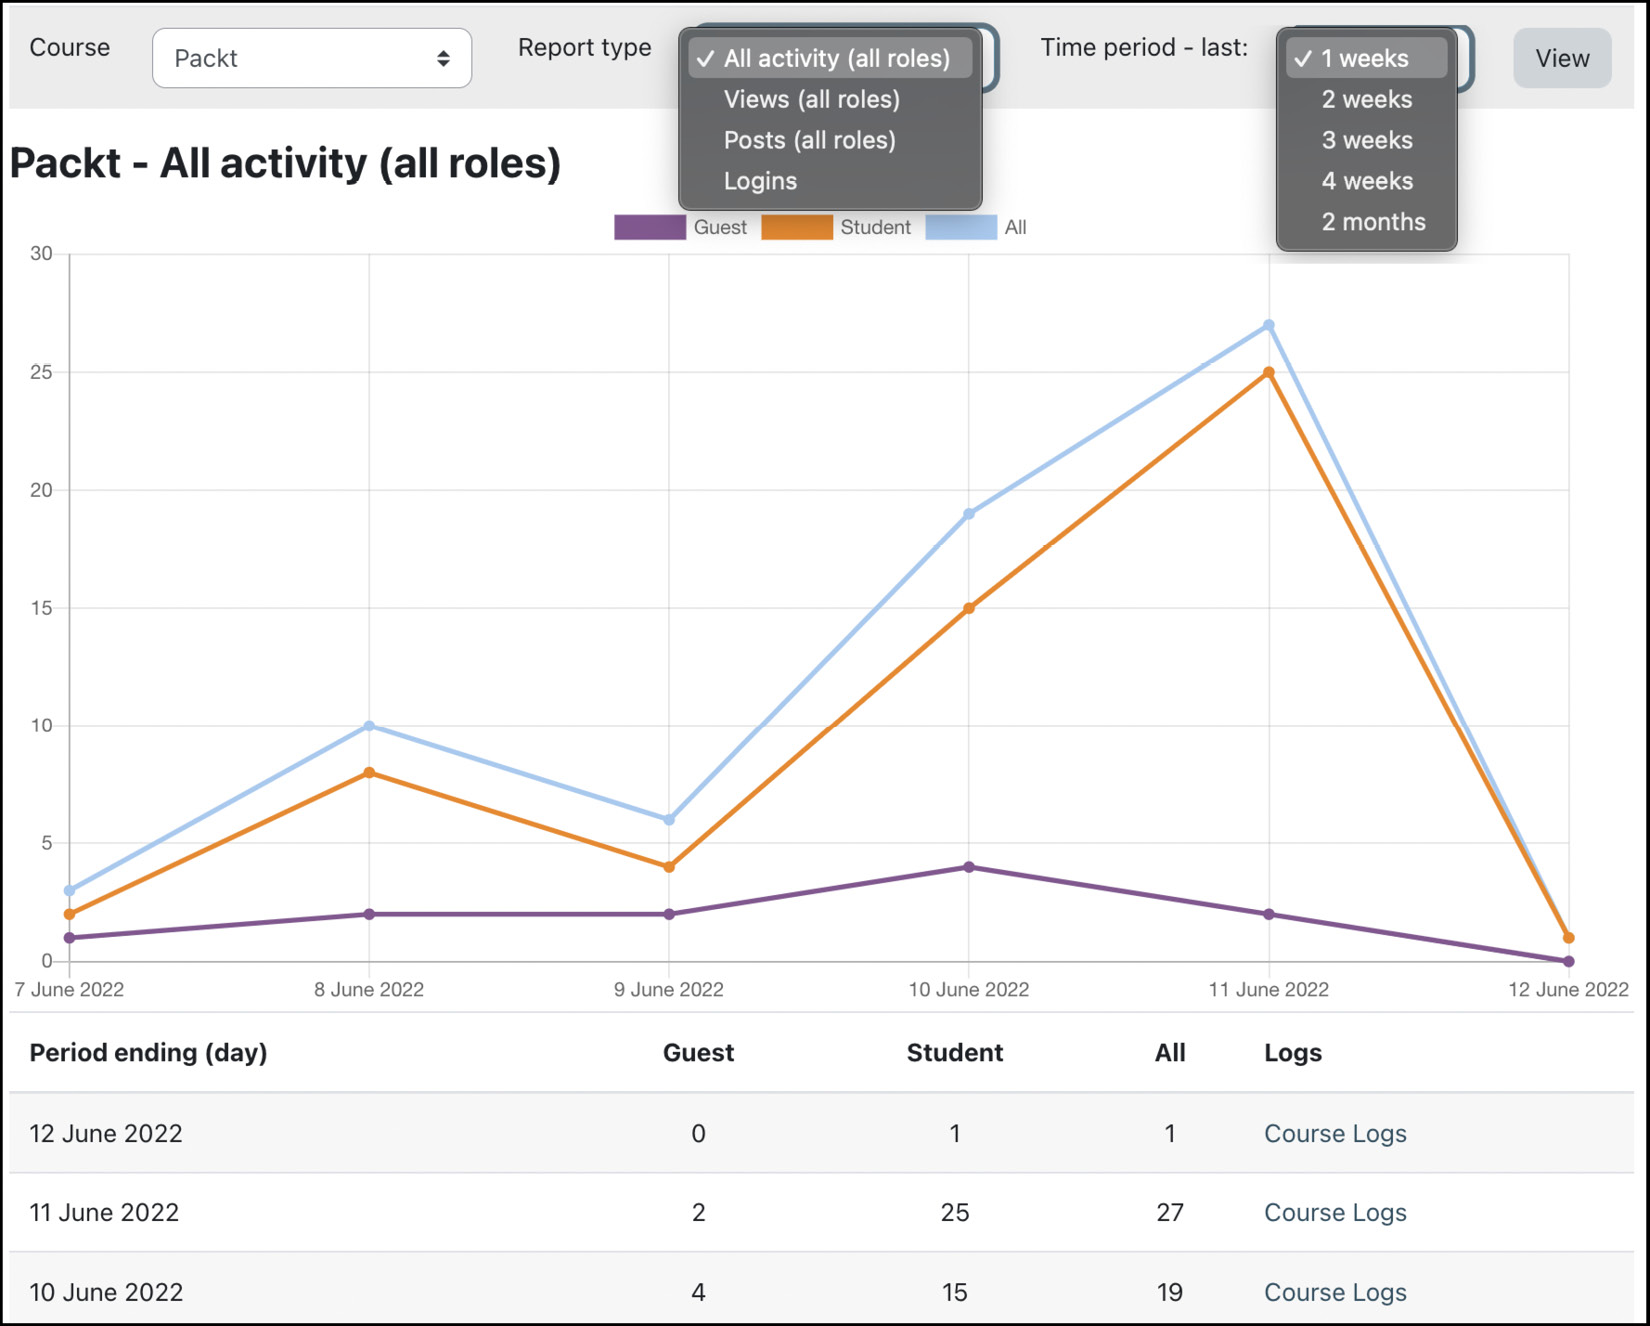
Figure 12.23 – Statistics report
If no data is displayed, you might have to readjust the settings of your statistics. Also, while statistics gathering is in progress, a message might be displayed stating that the module is in catch-up mode. If this is the case, you must wait until the processing has been completed.
A report that shows some basic statistics on courses over a period of interest that make use of the statistics data is located at Site administration | Reports | Course overview. The options are as follows (you can find the report measure calculations at docs.moodle.org/en/Course_overview_report):
- Most active courses
- Most active courses (weighted)
- Most participatory courses (enrolments)
- Most participatory courses (views/posts)
Each report shows a table, and a graph visualizes the course data.
I don’t know about you, but the information provided by these two Statistics reports is highly unsatisfactory. Given the module’s burden on our system and the amount of available data, this seems like a very simplistic – some would say useless – way to display statistics.
An extension to the Statistics module is a plugin called Overview Statistics (moodle.org/plugins/report_overviewstats), which provides you with more analyses on users who are logging in, user countries, preferred languages, and some course stats. While this is an improvement over the Statistics facility, it is still far from ideal.
If the described statistics facilities do not satisfy your hunger for usage data, you might consider using tools such as Matamo, Piwik (both privacy-focused and open source), and Google Analytics. These web log analyzers are feature-rich services that track any traffic to your Moodle site and offer an abundance of statistics on visitors, traffic sources, content, user-defined goals, and much more.
You have two options for adding web traffic analysis support to your Moodle system:
- A dedicated plugin that supports any or all of the tools mentioned previously, for example, Web Analytics (moodle.org/plugins/tool_webanalytics).
- A theme that supports web log analyzers. The two most popular third-party themes, which were mentioned in Chapter 7, Enhancing Moodle’s Look and Feel, provide different levels of integration: while Moove only supports your Google Analytics V4 code, Adaptable has a dedicated Analytics tab where you can customize your Google Analytics, Matamo, and Piwik settings, respectively.
Piwik, Matomo, and Google Analytics run sophisticated statistics against historical browsing data. Moodle Analytics, on the other hand, applies machine learning techniques and models to make predictions of future outcomes, which is the topic of the final section of this chapter.
Making predictions with Moodle Analytics
In this section, you will learn about Moodle Analytics, including how to create learning analytics models.
Custom and log-based reports are descriptive; they tell viewers what happened but not why, and don’t predict outcomes or advise users on how to improve. While reporting tells us about who, what, when, and where, learning analytics aims to explain why and how well.
Important note
Moodle Analytics predicts or detects unknown aspects of learning based on (historical) log data and current behavior.
There are two types of models that Moodle Analytics supports:
- Machine learning-based models: Sophisticated models use mathematical tools to make predictions; for instance, students with a high likelihood of failing a course
- Static models: Simple models are based on assumptions and do not require sophisticated analyses; for example, students who have not enrolled in a course
The following diagram illustrates the key components of the Moodle Analytics workflow (adapted from docs.moodle.org/dev/Analytics_API):
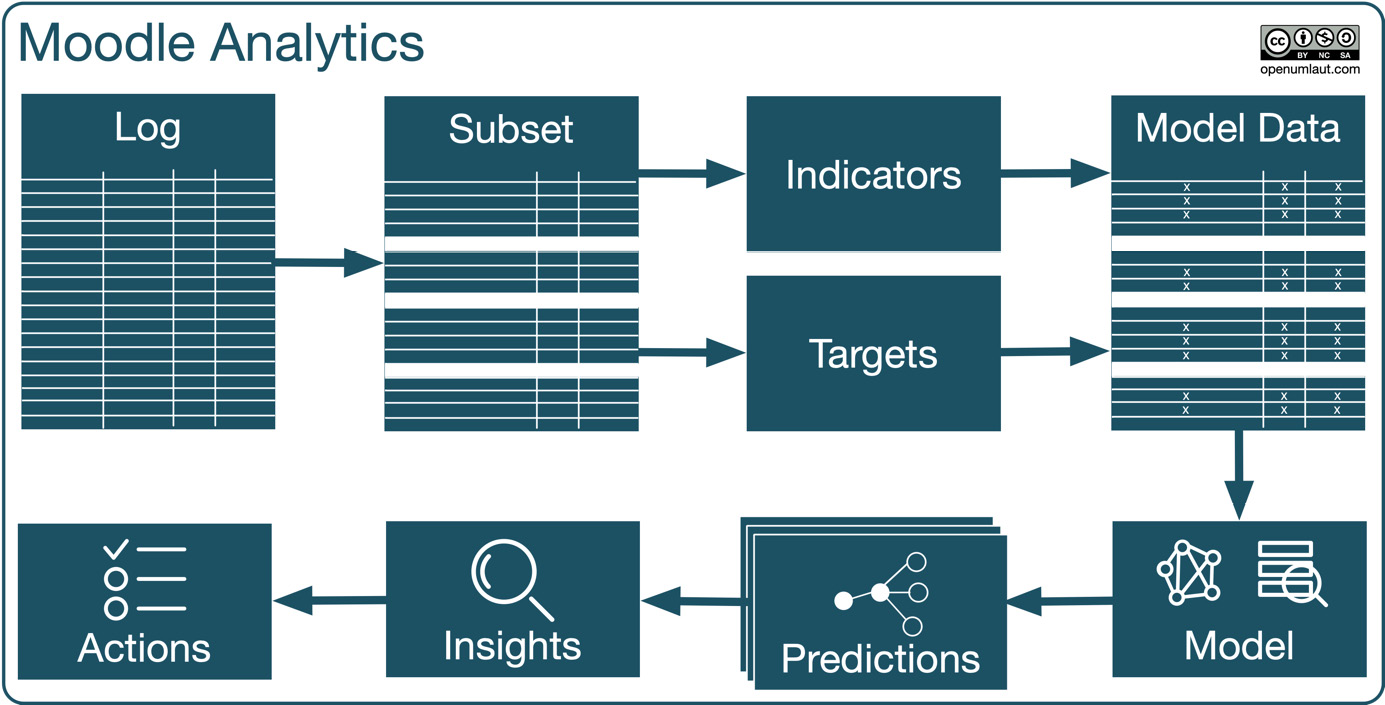
Figure 12.24 – Moodle Analytics components and workflow
Let’s circle through the workflow, starting from the top left:
- Log is the selected log file we covered earlier. A Subset of the log will be created based on the analytics model and the selected analysis interval.
- Indicators, also known as predictors or features, are what you think will lead to an accurate target prediction. An indicator might be forum participation or teacher availability. Targets, also known as classes, represent the event the model is attempting to predict. A popular target is “students at risk of dropping out.”
- The filtering and augmentation outcome from the first three steps results in Model Data, which is used for the prediction model at hand.
- The Model itself is created using machine learning (ML) algorithms that carry out all the heavy computation behind the scenes. We can treat this element as a black box and rely on the of the machine learning backend working correctly.
- Predictions are patterns found in data – the bigger and more diverse the model data, the more accurate the predictions. A prediction might be in the form of a rule such as “if forum participation is low and teacher availability is low, then students at risk of dropping out is high.”
- Insights are generated by predictions when certain thresholds are met (a particular student is at risk of dropping out). Based on the insights, Actions should then be taken.
One of the most popular machine learning techniques is classification. The objective of classification is to predict a target by building a model based on a training dataset and then utilizing that model to predict the target in the test data. In our learning analytics context, a typical target is a prediction of whether students will pass or fail, or whether they are likely to drop out.
This type of learning is known as supervised learning because the learning process is guided toward the targets while building the model. Staying with the pass-fail scenario, the modeler (you!) would decide which data should be considered as indicators; for instance, course progress, grades, and participation levels.
Some typical classification applications include loan approval, churn prediction, medical diagnoses, and spam detection. Learning analytics usually deals with classification problems with one target (for example, pass or fail) to be predicted. Moodle Analytics currently only supports this type of binary classification.
We have only touched upon the very basics of the inner workings of Moodle Analytics. If you wish to dive deeper into this fascinating topic, some excellent resources are available online, such as docs.moodle.org/en/Using_analytics and docs.moodle.org/dev/Analytics_API.
OK, enough of all the abstract machine learning and learning analytics theory. However, before we can create our first Moodle analytics model, some initial configuration is required, which we are going to cover first.
Setting up Moodle Analytics
First, ensure that the Analytics option under Site administration | General | Advanced features is turned on. Setting up Moodle Analytics requires configuring two types of settings: educational domain knowledge and some technical parameters.
Under Site administration | General | Analytics | Site information, you should provide information about how most educators and learners use your Moodle site. This educational domain knowledge can be taken into account by machine learning algorithms. The self-explanatory fields to be configured are shown in the following screenshot:
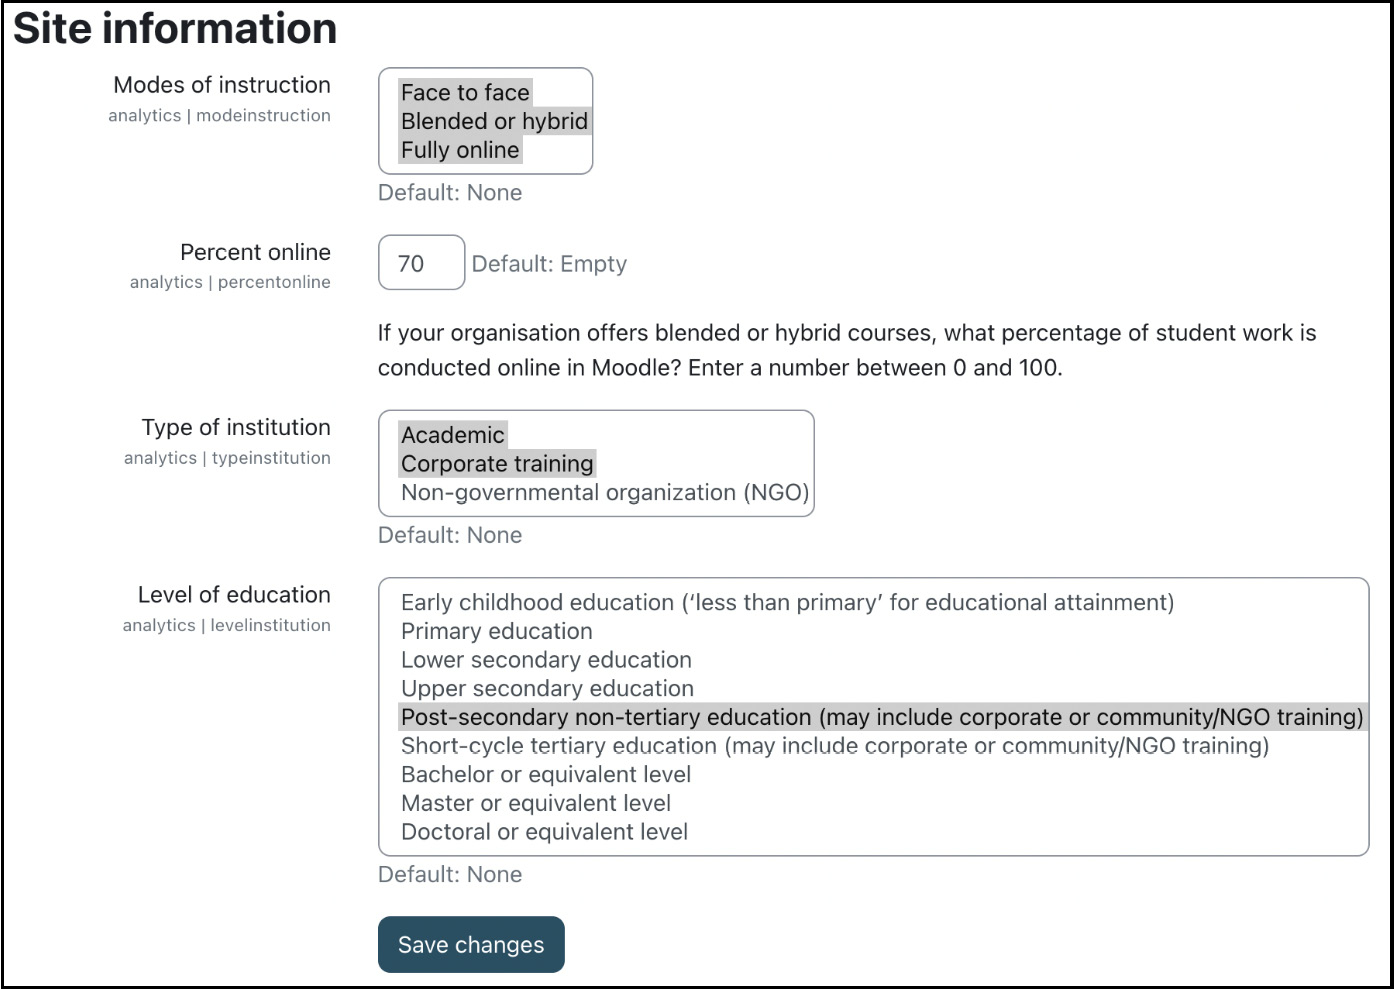
Figure 12.25 – Analytics site information
You can find the technical configuration by going to Site administration | General | Analytics | Analytics settings, where the parameters have been explained in detail:
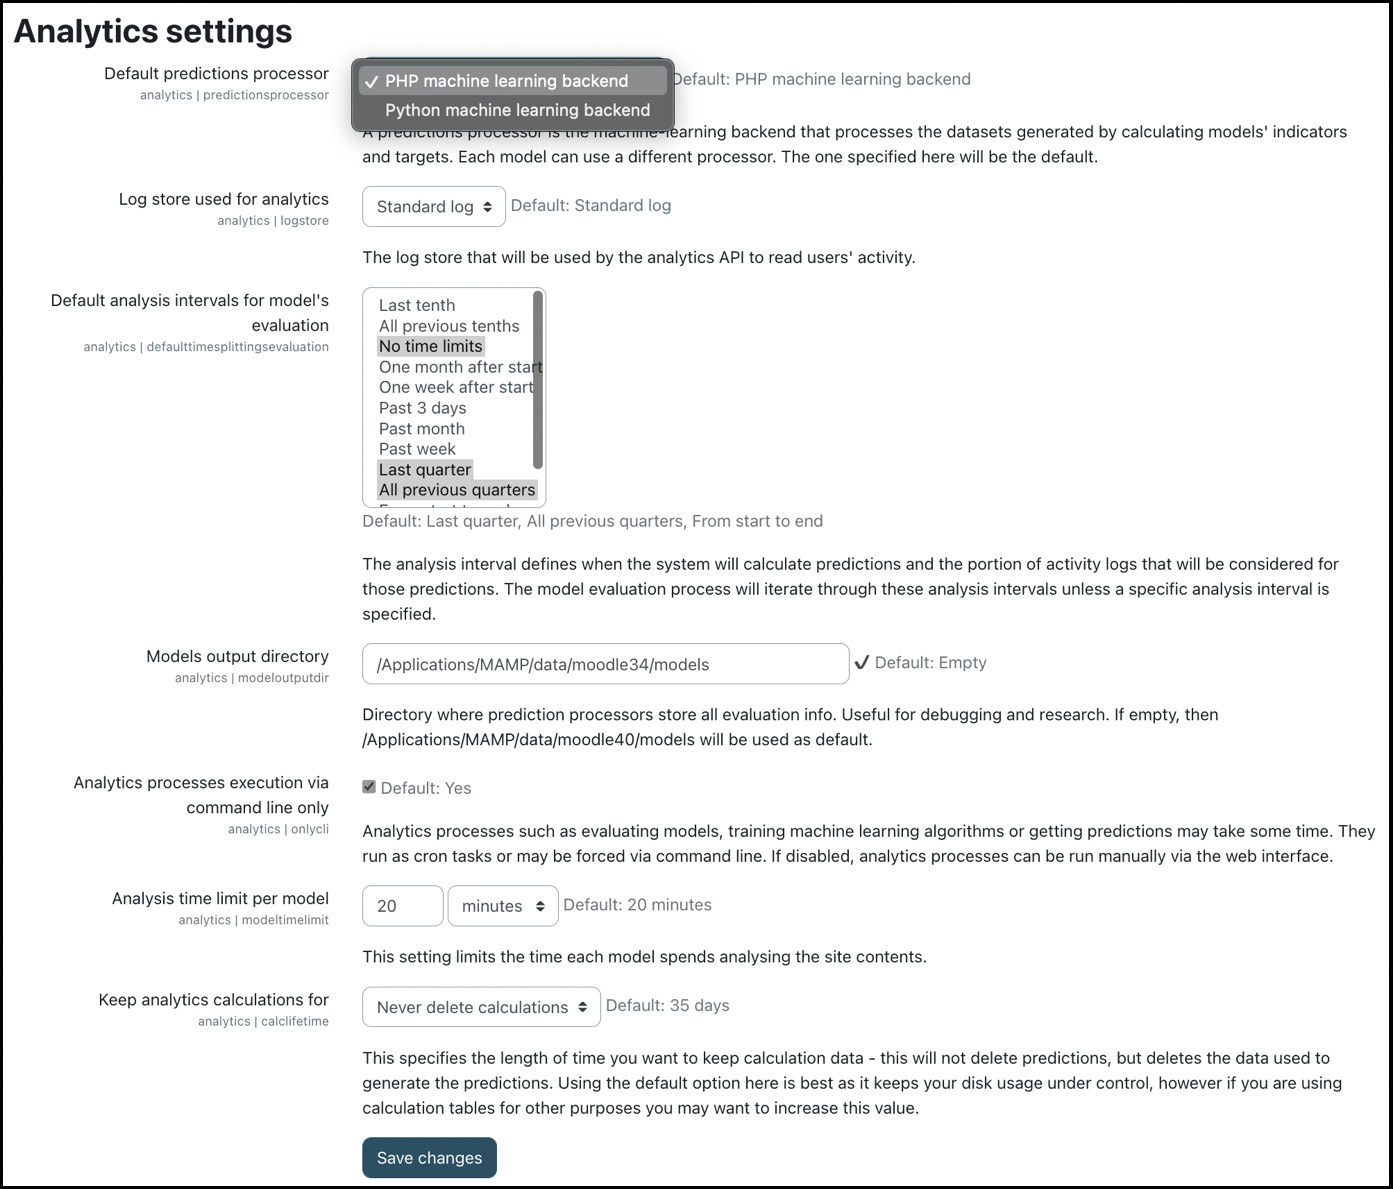
Figure 12.26 – Analytics settings
Most of these settings can easily be mapped onto the Moodle Analytics workflow presented earlier. Two scheduled tasks ( ool_analytics ask rain_models and ool_analytics askpredict_models) iterate through enabled models to train models and generate predictions, respectively. While you can allow these processes to be executed manually by disabling the Analytics processes execution via command line only setting, this is only recommended for testing purposes and not in production environments.
Once the domain and technical setup has been completed, we can create analytics models.
Creating analytics models
Analytics models are managed under Site administration | General | Analytics | Analytics models, as shown in the following screenshot:
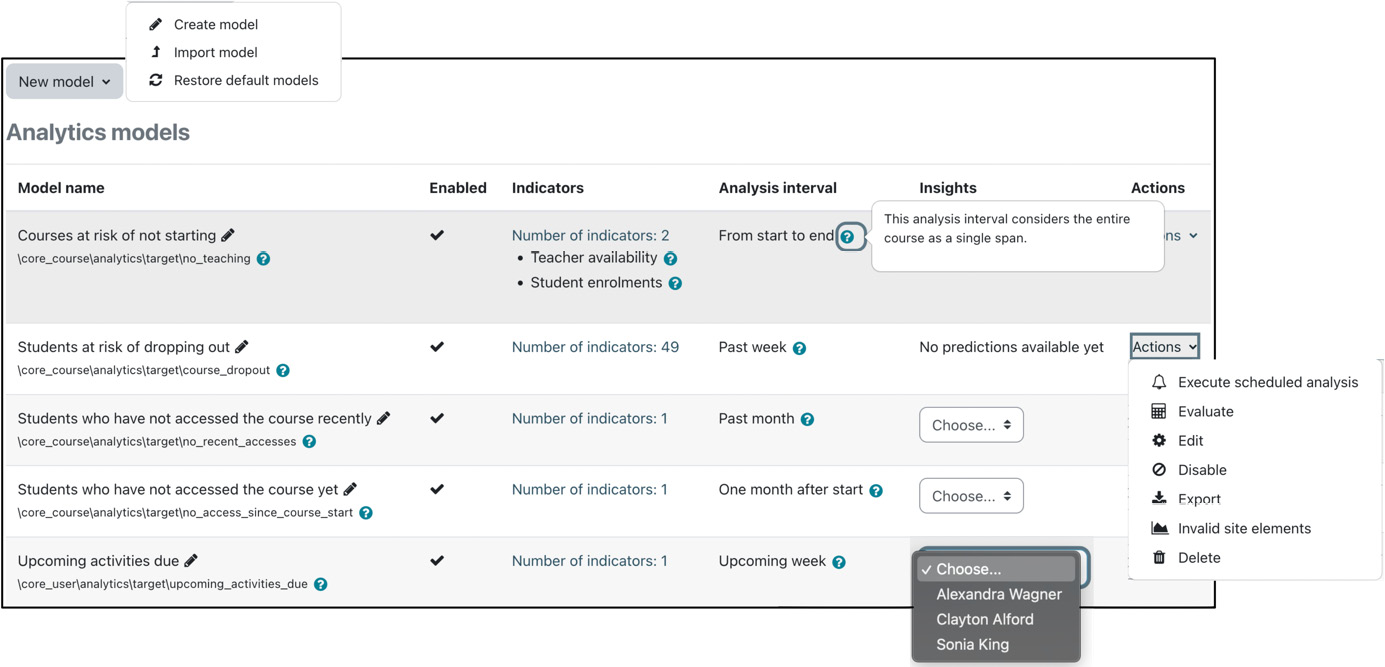
Figure 12.27 – Analytics models
For each model, the three relevant fields are Indicators, Analysis interval, and Insights:
- Indicators: There are nearly 60 predefined indicators available, based on an empirical model of student engagement among many Moodle instances and some Moodle Partner sites. These indicators are divided into two types: cognitive depth and social breadth. You can find more details on Moodle Analytics indicators at docs.moodle.org/en/Learning_analytics_indicators.
- Analysis interval: This time-splitting method defines when Moodle will calculate predictions and the portion of logs that will be considered for those predictions.
- Insights: These are the “interesting” prediction outcomes. The selection depends on the model type, for instance, users who are at risk of dropping out. These insights also trigger events, for example, notifications to course teachers or messages to students. Here is an Insights sample provided to course teachers, where they can also provide feedback, which will then be taken into account during the subsequent analysis:
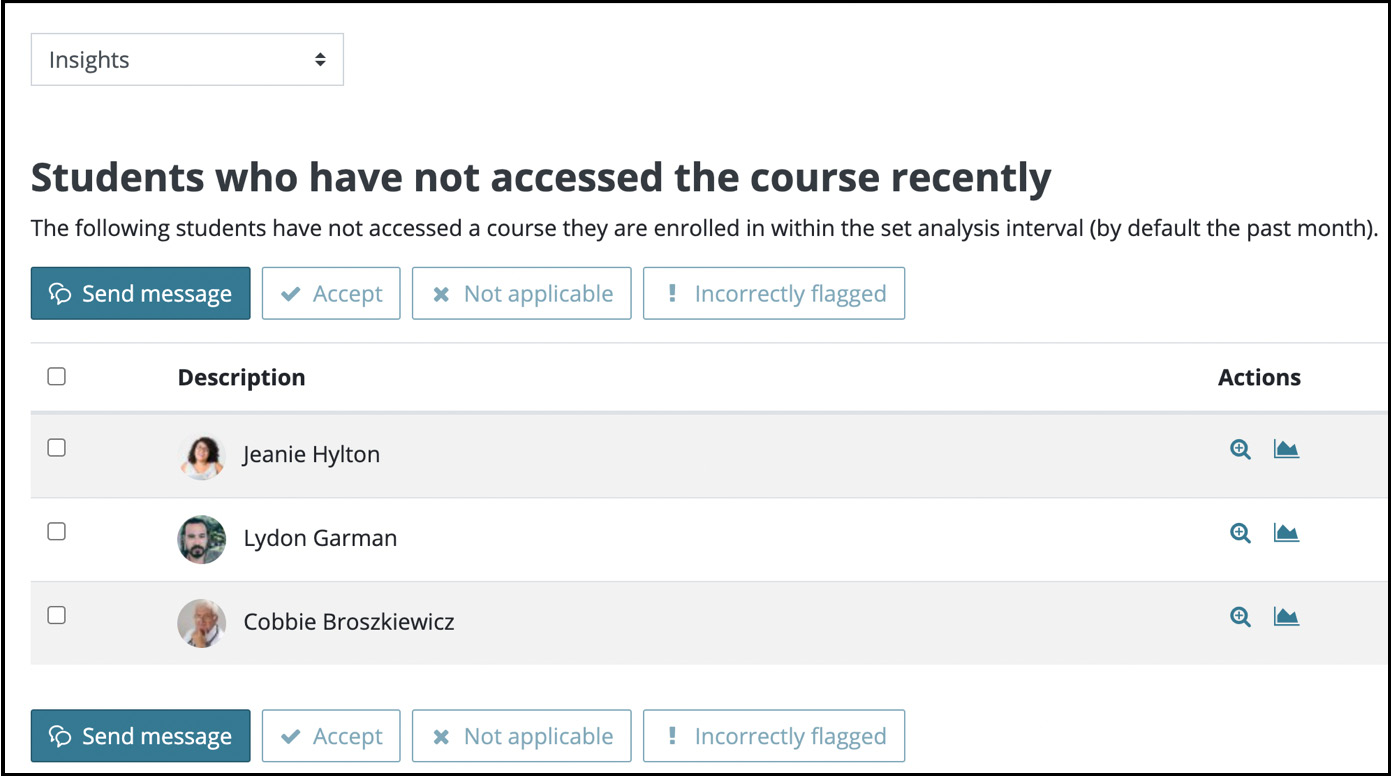
Figure 12.28 – Insights example
To adjust the settings of a model, select the standard Edit option in the Action menu. Here is an example of the Students at risk of dropping out model:
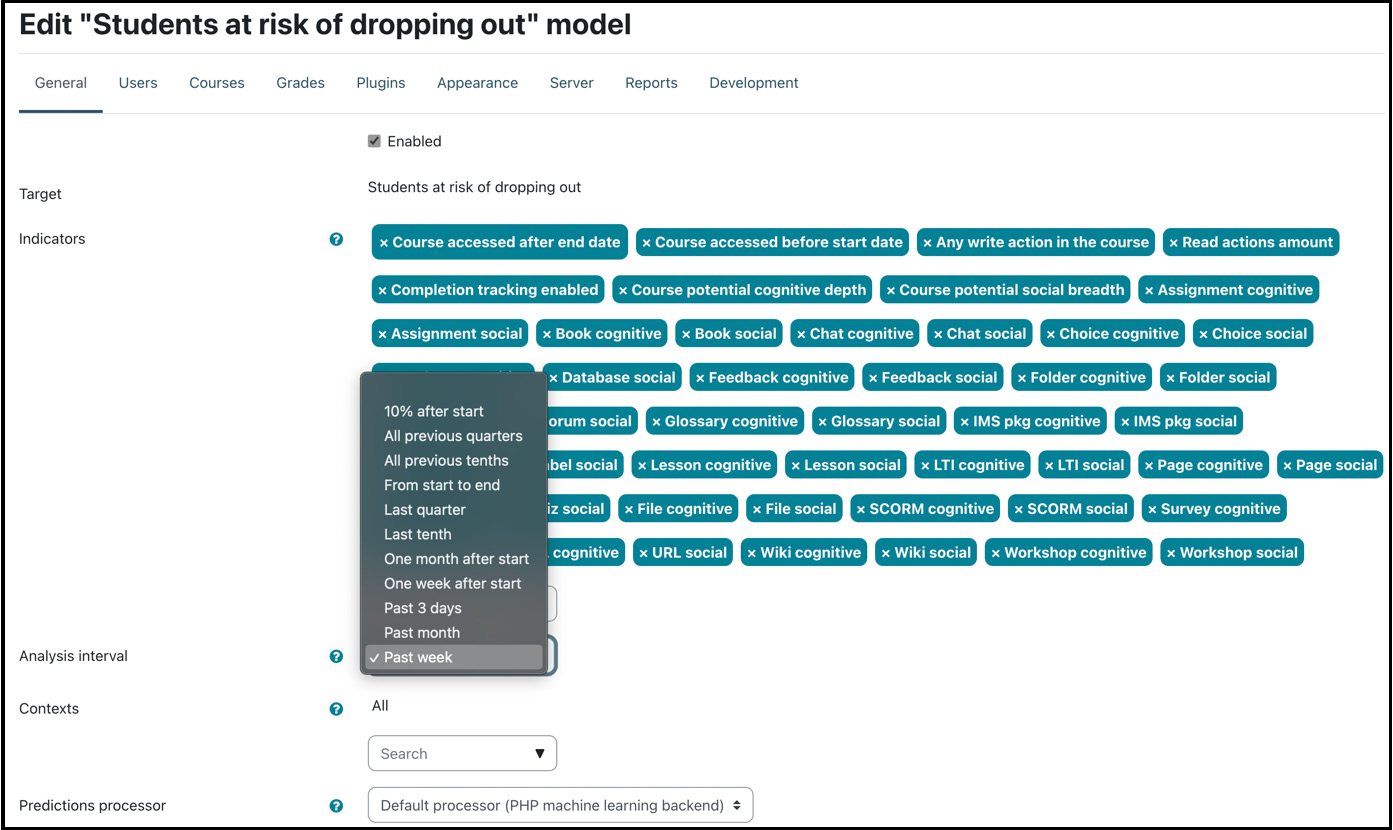
Figure 12.29 – Analytics model details
You can modify the list of Indicators and Analysis interval. Additionally, you can restrict the model-building to Contexts – that is, selected course categories and courses.
Important note
When a model is modified, all previous predictions will be deleted.
You must configure the same parameters when creating a new model after selecting the target. The following targets (what the model will predict) are available in Moodle:
- Students at risk of not achieving the competencies assigned to a course (ML)
- Students at risk of not meeting the course completion conditions (ML)
- Students at risk of dropping out (ML)
- Students at risk of not achieving the minimum grades to pass the course (ML)
- Courses at risk of not starting (static)
- Students who have not accessed the course recently (static)
- Students who have not accessed the course yet (static)
- Upcoming activities due (static)
At the beginning of this section, we mentioned that Moodle Analytics supports machine learning-based and static models. In static models, the indicators are fixed; you cannot modify these as you can in machine learning-based models.
There are several other analytics-specific commands in the Actions menu (some of those options only appear if the Analytics processes execution via command line only setting under Site administration | General | Analytics | Analytics settings is disabled):
- Execute scheduled analysis: Train machine learning algorithms with the new data available on the system and get predictions for ongoing courses
- Insights report: Depending on the model, report insights will be shown about what insights have been found and information about the individual targets
- Export: Moodle Analytics models can be exported in JSON format and imported via the Import model option upon selecting the New model button
- Invalid site elements: A list of the elements that cannot be analyzed by this model
- Clear predictions: Clears all the model predictions and training data
Moodle Analytics is one of the most powerful tools in Moodle but also one of the least utilized. Whether it is due to its complexity or lack of trust in machine learning algorithms, I don’t know. Hopefully, we have shed some light on this topic and have equipped you with the skills to offer Moodle Analytics to your learners and educators.
Summary
Moodle offers a wide range of reporting facilities for teachers and administrators. In this chapter, we focused on reporting tools admins interact with or have to configure and provide to users. Even if you are not a data nerd, I hope the reporting facilities presented are helpful in your day-to-day administrative work.
The newly introduced report generator is a versatile tool for creating flexible and interactive custom reports. You got to know the report generator, including data sources, report building, audiences, and schedules. The more report sources that are made available in the future, the less likely you will need third-party tools, such as Configurable reports, which we briefly dealt with.
In the second part of this chapter, you learned everything about Moodle’s logging framework in terms of its components, events, and log stores. You also interacted with Moodle logs, one of the most often used tools in the administrator’s day-to-day job.
The logging framework provides the foundation for statistics and learning analytics, which we covered in dedicated sections.
Moodle reporting, particularly the newly introduced report generator, has recently undergone a significant makeover. Expect more features to be introduced shortly. Another constantly improved topic is Moodle’s security, which is the next chapter’s topic.