
15
Optimizing Moodle Performance
The performance of web-based systems is a critical issue, and it is the key responsibility of an administrator to configure, monitor, and fine-tune the LMS for maximum speed. While Moodle has the potential to scale to tens of thousands of simultaneous users, good performance management is required to guarantee adequate scalability.
After providing an overview of the subject, we will cover the most relevant topics related to Moodle’s performance and optimization:
- Optimizing Moodle feature performance: We will look at performance issues in Moodle functions and Moodle activities. Optimizing their performance is often a trade-off between improved speed and potentially reduced functionality, which is discussed.
- Moodle Universal Cache (MUC): We cover the different elements of the powerful MUC, namely cache types, cache stores, and cache definitions. We will then run you through some MUC performance testing and various caching options.
- Optimizing Moodle system performance: A range of system-related performance settings are dealt with, namely session handling, cron management and scheduled tasks, configuring global search, and setting system paths.
We will conclude the chapter with a short Moodle performance profiling and monitoring section.
Understanding Moodle performance
Web applications in general, and Moodle in particular, have very distinct application layers consisting of an operating system, web server, database server, and an application developed in a programming language. Each layer has its idiosyncrasies when it comes to optimization. We will exclusively focus on the application layer, which is the focus of this book, as shown in the following diagram:
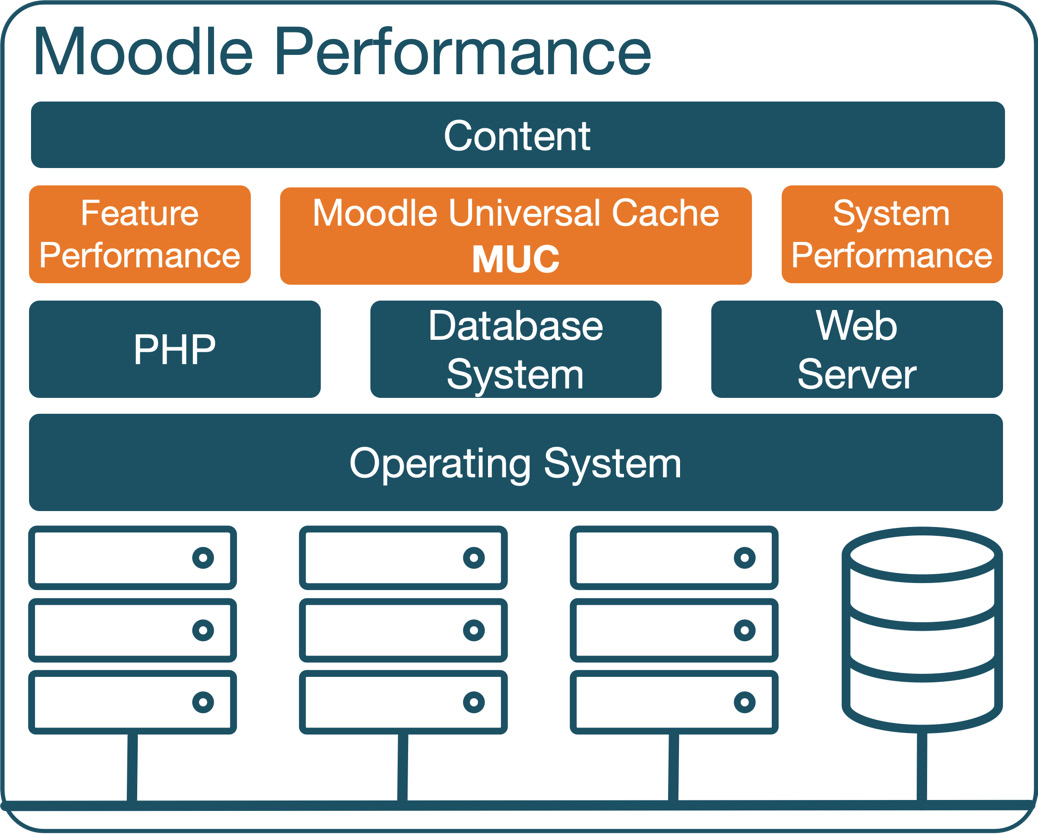
Figure 15.1 – Moodle performance
The following areas are NOT dealt with in any detail, and it is necessary to refer to the respective documentation with regard to performance and optimization issues:
- Operating system performance: The choice of operating system and configuration will significantly impact how Moodle performs. In principle, Linux or any other Unix derivative performs better than any other operating system. PHP applications, such as Moodle, run significantly slower in a Windows environment than on Linux. Some aspects of this were covered in Chapter 1, Installing Moodle, when we dealt with the installation of Moodle.
- Database performance: The database is a major bottleneck since it requires disk access, which is slower than memory access. Entire books and conferences have been dedicated to database optimization, with indexing, caching, buffering, querying, and connection handling as the primary candidates for discussion. The two techniques that significantly impact database performance are enabling query caching and increasing buffer sizes. You should consider running the database on a dedicated server or a cluster. The former is relatively straightforward: once set up, all you need to do is to change the $CFG->dbhost entry in config.php from localhost to the IP address of your database. The latter is significantly more complex and requires strong database administration skills.
There is also much debate about which database is best suited for Moodle. While the open source camp is divided between MySQL, MariaDB, and PostgreSQL, corporates are split between MS SQL Server and Oracle. Whichever your choice of system, a well-set-up and tuned database will always perform better than one used with out-of-the-box settings—“The best database system is the one you know.”
- Web server performance: Each web server (Apache, Internet Information Services (IIS), nginx, and so on) offers an array of optimization settings that include memory handling, caching, process management, and other minor tweaks.
- PHP performance: There are several ways in which PHP can be forced to execute code significantly faster. The key to doing this is using a PHP accelerator in combination with good memory management and caching techniques. Moodle supports Zend OPcache, which is precompiled by default. Zend OPcache speeds up PHP execution by opcode caching and optimization. It stores precompiled script byte code in shared memory. You can check whether OPcache is working correctly by going to Site administration | Server | Environment, as illustrated in the following screenshot:
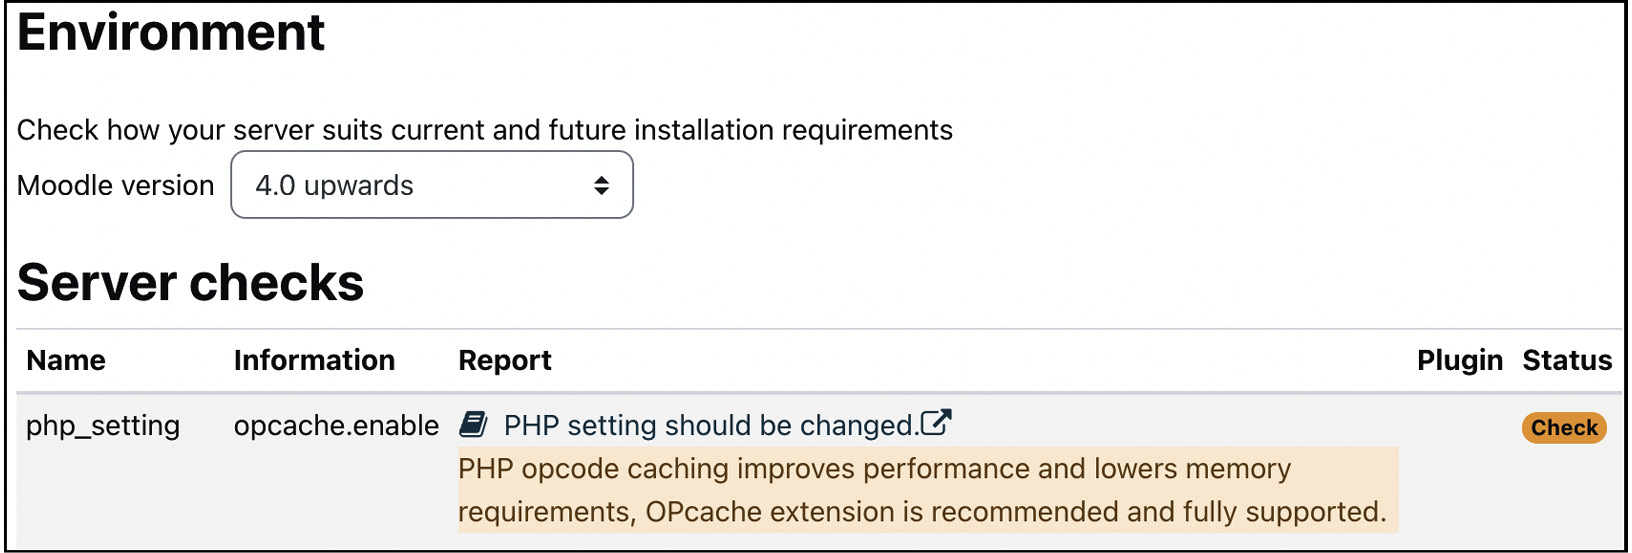
Figure 15.2 – Zend OPcache check
Your php.ini file is likely to contain the following entries (for details, refer to docs.moodle.org/en/OPcache):
[OPcache]
opcache.enable = 1
opcache.memory_consumption=128
opcache.interned_strings_buffer=8
opcache.max_accelerated_files=8000
opcache.revalidate_freq=60
opcache.fast_shutdown=1
opcache.enable_cli=1
; Required for Moodle
opcache.use_cwd = 1
opcache.validate_timestamps = 1
opcache.save_comments = 1
opcache.enable_file_override = 0
There is a handy plugin available at moodle.org/plugins/tool_opcache, adding a PHP OPcache management GUI to Moodle, a CLI tool to reset PHP OPcache, and a Nagios check for PHP OPcache.
- Hardware performance: We already mentioned in Chapter 1, Installing Moodle, that there is no one-size-fits-all approach to the ideal hardware setup. For single-server systems, the key is RAM: the more, the better. It’s as simple as that. Once the level of concurrency increases above a certain level, it is inevitable to use multiple web servers in a load-balanced environment.
- Network performance: Networks are the backbone of most IT infrastructures and thus a potential performance bottleneck. Your topology, software, and hardware must be configured correctly to ensure a well-performing network without typical issues such as packet losses.
- Content performance: The content that is created and uploaded by your course creators or home page designers will have an impact on the performance of your system. While you cannot dictate which learning sources are added to Moodle, you might want to recommend two main strategies to reduce the load content has on your system: First, the content volume in courses and the home page should be kept to a manageable size, avoiding the infamous scroll of death. Second, content should be optimized, especially office docs (for instance, PDFs instead of Word files), images (resolution and color depth), and audio/video (sample rate and resolution).
While all the preceding criteria apply, some elements can be changed on the fly. For example, during exam week, you might consider increasing the memory available for Moodle, while during the summer break, you can reduce the number of servers to carry out maintenance. More sophisticated setups let you specify load and usage thresholds, which dynamically trigger resource allocation.
For each area mentioned, profile tools, monitoring systems, benchmarks, and stress tests are available to help you gauge which performance bottlenecks are present and whether they have been reduced after optimization has been carried out.
An entire area has been dedicated to performance and optimization in the Moodle docs. You can find most of the relevant information and links to relevant sites at docs.moodle.org/en/Performance.
You should remember that Moodle’s performance cannot be viewed independently. For example, improving security comes at a price in terms of performance reduction; running your entire site over HTTPS is highly recommended, but it slows down certain operations. Some typical trade-offs are shown in the seesaw depicted here:

Figure 15.3 – Performance versus the rest of the world
Another trade-off you will face regularly is performance versus functionality, where certain features harm how speedily your system performs. Moodle comes with an elementary performance report (Site administration | Reports | Performance overview), showing some of those trade-offs.
We will kick off the list of performance optimizations by looking at some of those Moodle features that can be optimized but will impact some or all of your users.
Optimizing Moodle feature performance
The title of this section is slightly misleading because optimizing Moodle features effectively means limiting its functionality. Suggestions in this section have a positive impact on performance but a potentially negative impact on user functionality. While some features might be dispensable (for instance, statistics), others should be non-negotiable, such as backups.
We have grouped Moodle features in the performance optimization context into Moodle functions and Moodle activities.
Optimizing Moodle functions
In this subsection, we have collected some Moodle tools that impact the performance of your LMS. Most of the following functions have been dealt with elsewhere in this book, and we provide links to the respective chapters:
- Course backups: As you will learn in the next chapter, course backups hurt performance during execution, especially on larger systems. If possible, schedule the backup procedure when the load on the overall system is low. If you turn off site-wide course backups and use system-level backups instead, you reduce performance problems but lose the ability to recover individual items. A compromise is to include only essential data and leave out less relevant information, such as log files. All this will be dealt with in Chapter 16, Avoiding Sleepless Nights – Moodle Backup and Restore.
- Log files: In Chapter 12, Gaining Insights through Moodle Reporting and Analytics, we looked at Moodle logging, reporting, and analytics. Keeping track of user behavior can potentially harm your server performance, as logs must be created and kept up to date. The recommended approach is only to log data that will be analyzed and reported on. Three parameters determine the volume of logs: the number of log stores, the number of fields stored, and the time logs are being kept.
- Statistics: If you have enabled the statistics functionality, be aware that it is likely to have a profound impact on the performance of your system whenever statistical information is updated. Go back to the Gathering statistics section in Chapter 12, Gaining Insights through Moodle Reporting and Analytics, and ensure that the configuration has minimum impact on your system.
- Home page courses: The home page is likely to be accessed frequently by all users. On sites with many courses, displaying all of them every time the home page is called is unlikely to be a pleasant user experience. You can limit the Maximum number of courses and Maximum category depth parameters by going to Site administration | General | Site home | Site home settings.
- Roles and users: We dedicated an entire chapter to roles (Chapter 6, Managing Permissions, Roles, and Capabilities). The robust flexibility of Moodle’s roles system comes at a price, which is a minor drop in performance if a lot of lookups are required in the context hierarchy (avoid global roles) and the override mechanism is applied frequently.
- User selector: The user selector is displayed in various places throughout Moodle. If you experience speed problems in courses with a large number of users, adjust the Maximum number of users per page settings by navigating to Site administration | Users | Permissions | User policies.
Next up are Moodle activities, which offer some performance tweaking settings.
Optimizing Moodle activities
While optimizing Moodle activities will positively impact performance, they should only be implemented if the loss of functionality is acceptable to your users. The following are some modules that can be tweaked:
- Gradebook optimization
Due to the complexity of the gradebook, some settings in the Grades menu will impact performance. In general, when more aggregation and other calculations have to be carried out, the population of the gradebook data store becomes slow. For example, the Aggregate including subcategories parameter in Site administration | Grades | Grade category settings will add minor overhead to calculating grades.
A second gradebook-related area that impacts performance is the gradebook history, which forces Moodle to keep track of any changes in grades. Go to Site administration | Server | Cleanup, and you will see two gradebook history settings at the bottom:
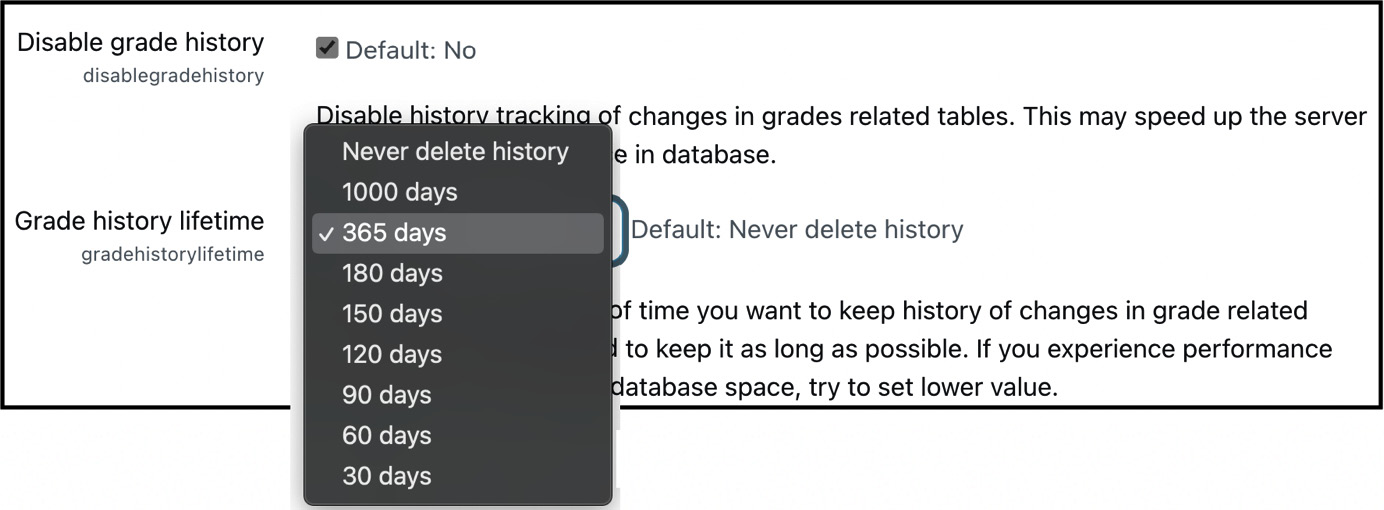
Figure 15.4 – Gradebook history settings
The gradebook history is turned on by default, and values are kept forever. You can either turn the facility off entirely or limit the time you wish to keep the grade entries.
You will find more details on the gradebook in the Configuring grades and the gradebook section of Chapter 9, Configuring Educational Features.
- Chat optimization
By default, Moodle chat uses the AJAX method, which, like the Normal method, contacts all participating clients regularly. The upside of both approaches is that they require no configuration and work on any system; the downside is that they have a significant performance impact on the server, especially when the chat activity is used regularly. A solution is to use the Chat server daemon, which ensures a scalable chat environment. However, the daemon, a small system-level program that runs in the background, has to be installed on the operating system level and only works on Unix (check your administration guide for how to do this).
To change the chat method Moodle uses and to configure some performance parameters, go to Site administration | Plugins | Activity modules | Chat. We dealt with these in the Synchronous communication section of Chapter 10, Configuring Technical Features.
The following table lists the performance-related settings and the methods to which they apply:
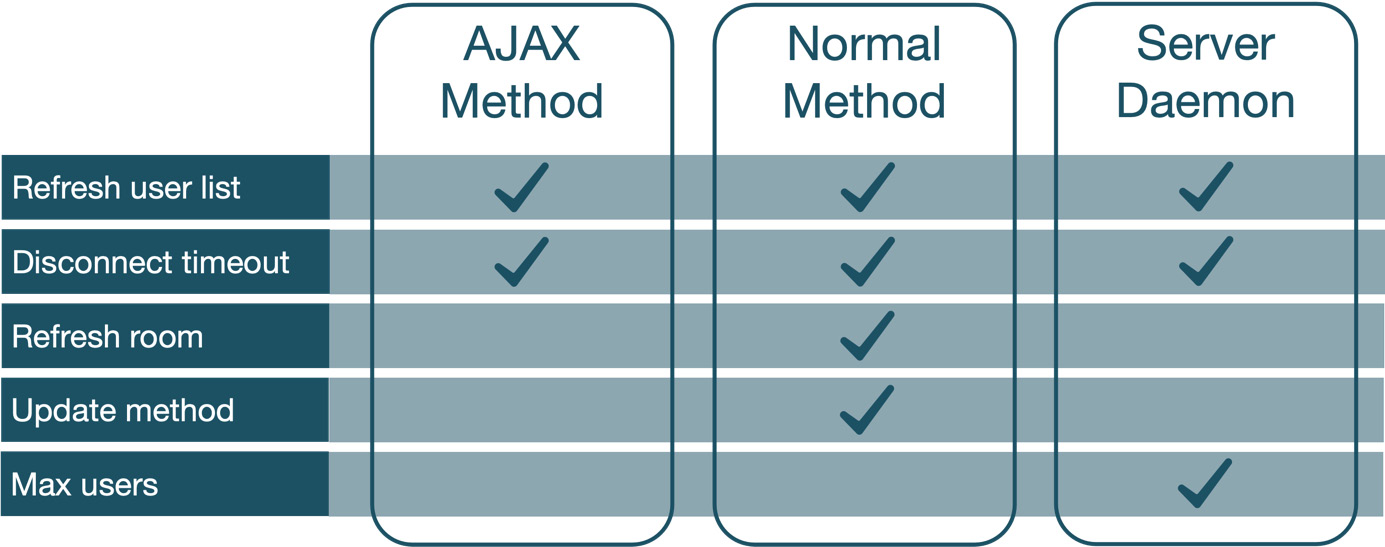
Figure 15.5 – Chat performance settings
- Forum optimization
On systems with large forums, tracking unread posts can slow down the activity. Though the impact is relatively minor, the tracking can be turned off by going to Site administration | Plugins | Activity modules | Forum, where you will find the Track unread posts and Allow forced read tracking parameters.
- Moodle’s filter settings
We focused on filter functionality when we looked at the feature in Chapter 9, Configuring Educational Features. Now, let’s look at filters again, highlighting some performance issues. The following is a list ordered by priority when setting up filters by going to Site administration | Plugins | Filters | Manage filters:
- Activate all the filters that course creators need but not more than those. Too many active Moodle filters affect the server load, especially on lower-end systems. The number of active filters will increase the time it takes to scan each page since filters are applied sequentially, not in parallel.
- Configure as many active filters as possible using the Off, but available setting. They can then be activated locally at any course or activity level.
- Place the filters used most often (usually multimedia plugins) at the top of the list, as filters are applied on a first-come-first-serve basis.
- Caching is applied to pages that use text filters, a topic discussed later in the MUC section. Additionally, you should optimize the generic filter settings in Site administration | Plugins | Filters | Common filter settings: only turn on Filter uploaded files if required. Also, change Filter match once per page, Filter match once per text, and Filter navigation within system context to On if the resulting behaviors are acceptable. We have discussed these parameters in the Configuring filters section of Chapter 9, Configuring Educational Features.
There are other minor tweaks in Moodle activities and modules—for example, timeout values—and you’ll need to adjust those when and if you encounter any performance issues.
A bigger problem than feature performance is scalability, caused by concurrent users. We will spend the rest of the chapter dealing with this issue, starting with exploring the powerful MUC.
Moodle Universal Cache (MUC)
Caching stores frequently accessed data in transient storage and expedites its access using a cached copy instead of prefetched (from disk) or recomputed (in memory) data.
Note
Caching has proven to be one of the most efficient performance optimization techniques, and Moodle is no exception.
Moodle contains a powerful caching framework called MUC, which allows certain functions to take advantage of different configured caching services (docs.moodle.org/en/Caching).
Understanding MUC
Before we look at how MUC works, let’s explore some basic concepts: cache types (modes), cache stores, and cache definitions. The following diagram shows all three concepts and how they work together in MUC:
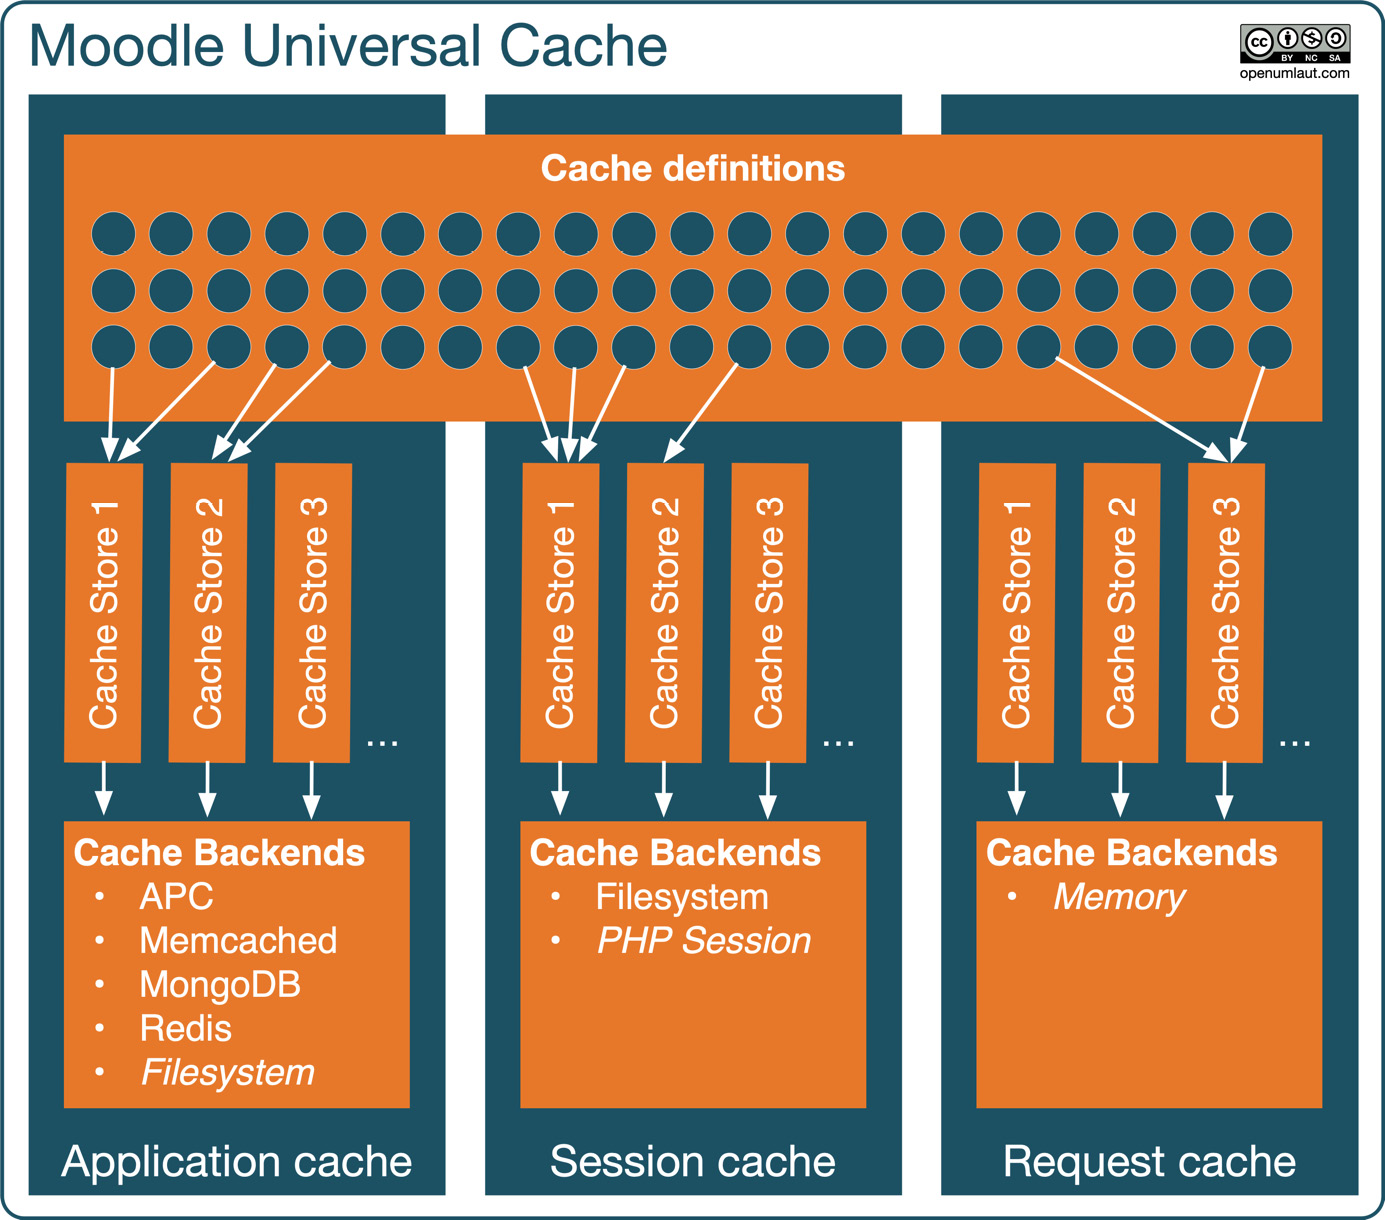
Figure 15.6 – Moodle Universal Cache
Moodle has nearly 100 cache definitions—for example, fetching of language strings, config settings, or processed CSS. Cache definitions are mapped onto cache stores, which act as connectors to the cache backend for different cache types. This all will make more sense by the end of this section.
Let’s go through each component, starting with cache types.
Cache types
There are three different cache types in Moodle, often referred to as cache modes:
- Application cache: The application cache deals with Moodle-specific operations—for example, caching of language strings or configuration settings. This is the most commonly used cache as it has the highest impact on Moodle performance.
- Session cache: This is basically the same as your PHP session cache. It is only used in very few scenarios; we do not need to cover this in further detail.
- Request cache: As the name suggests, this type of caching is only stored for the lifetime of a request and allows developers to optimize code. Again, this is not a cache type we, as administrators, must worry about.
Here’s an overview of the different cache types:
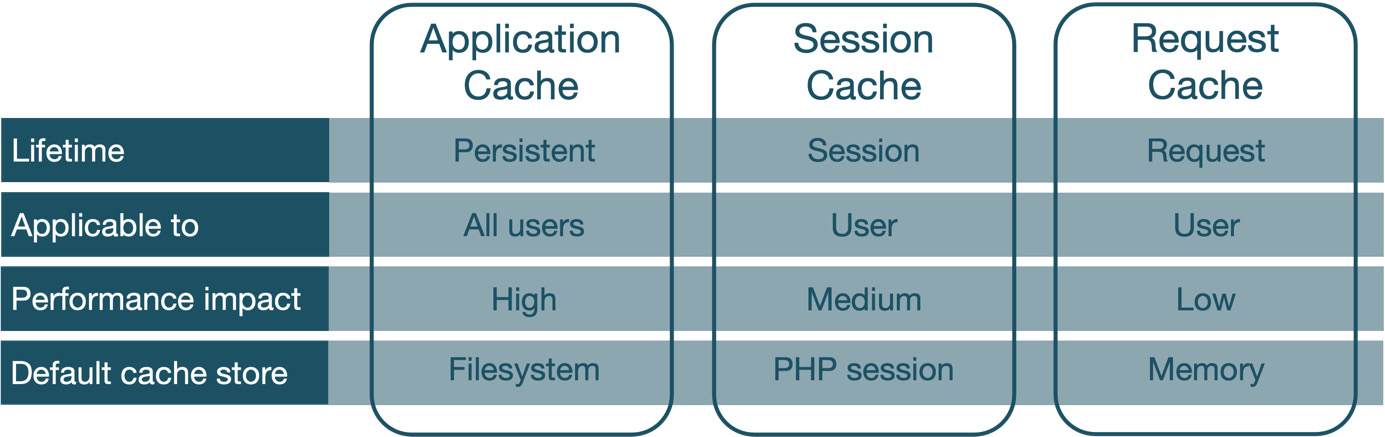
Figure 15.7 – Cache types (modes)
The last entry in Figure 15.7 describes the default cache stores. What these are and why they are critical in Moodle are covered in the following subsection.
Cache stores
In Moodle, cache stores are plugins that talk to MUC’s backend.
Important note
A cache store connects Moodle to physical storage, where the cached data gets stored.
As mentioned previously, the default cache stores are in the form of a filesystem (for application caches), a PHP session (session caches), and memory (request caches). For most setups, these are sufficient, but for larger sites, it is beneficial to consider a dedicated application cache store.
Moodle ships with the following four application cache store plugins (the descriptions have mostly been taken from their respective websites, not some techie buzzword-bingo):
- APC user cache (APCu): The alternative PHP cache is an in-memory key-value store for PHP
- Memcached: An in-memory key-value store for small chunks of data from results of database calls, API calls, or page rendering
- MongoDB: A NoSQL database system that can be configured to run like an in-memory database
- Redis: An in-memory data structure store, used as a distributed, in-memory, key-value database, cache, and message broker, with optional durability.
Plugins for other cache backends can be found in the Cache Stores section at moodle.org/plugins/?q=type:cachestore.
All the supported cache stores can be found at Site administration | Plugins | Caching | Configuration. On our system, all cache stores have been installed and configured at the system level except APCu, hence the ticks in the Ready column. The Supports column indicates which features are supported by the cache store; the options are ttl (time-to-live), data guarantee, key awareness, multiple identifiers, and searching by key, as illustrated in the following screenshot:
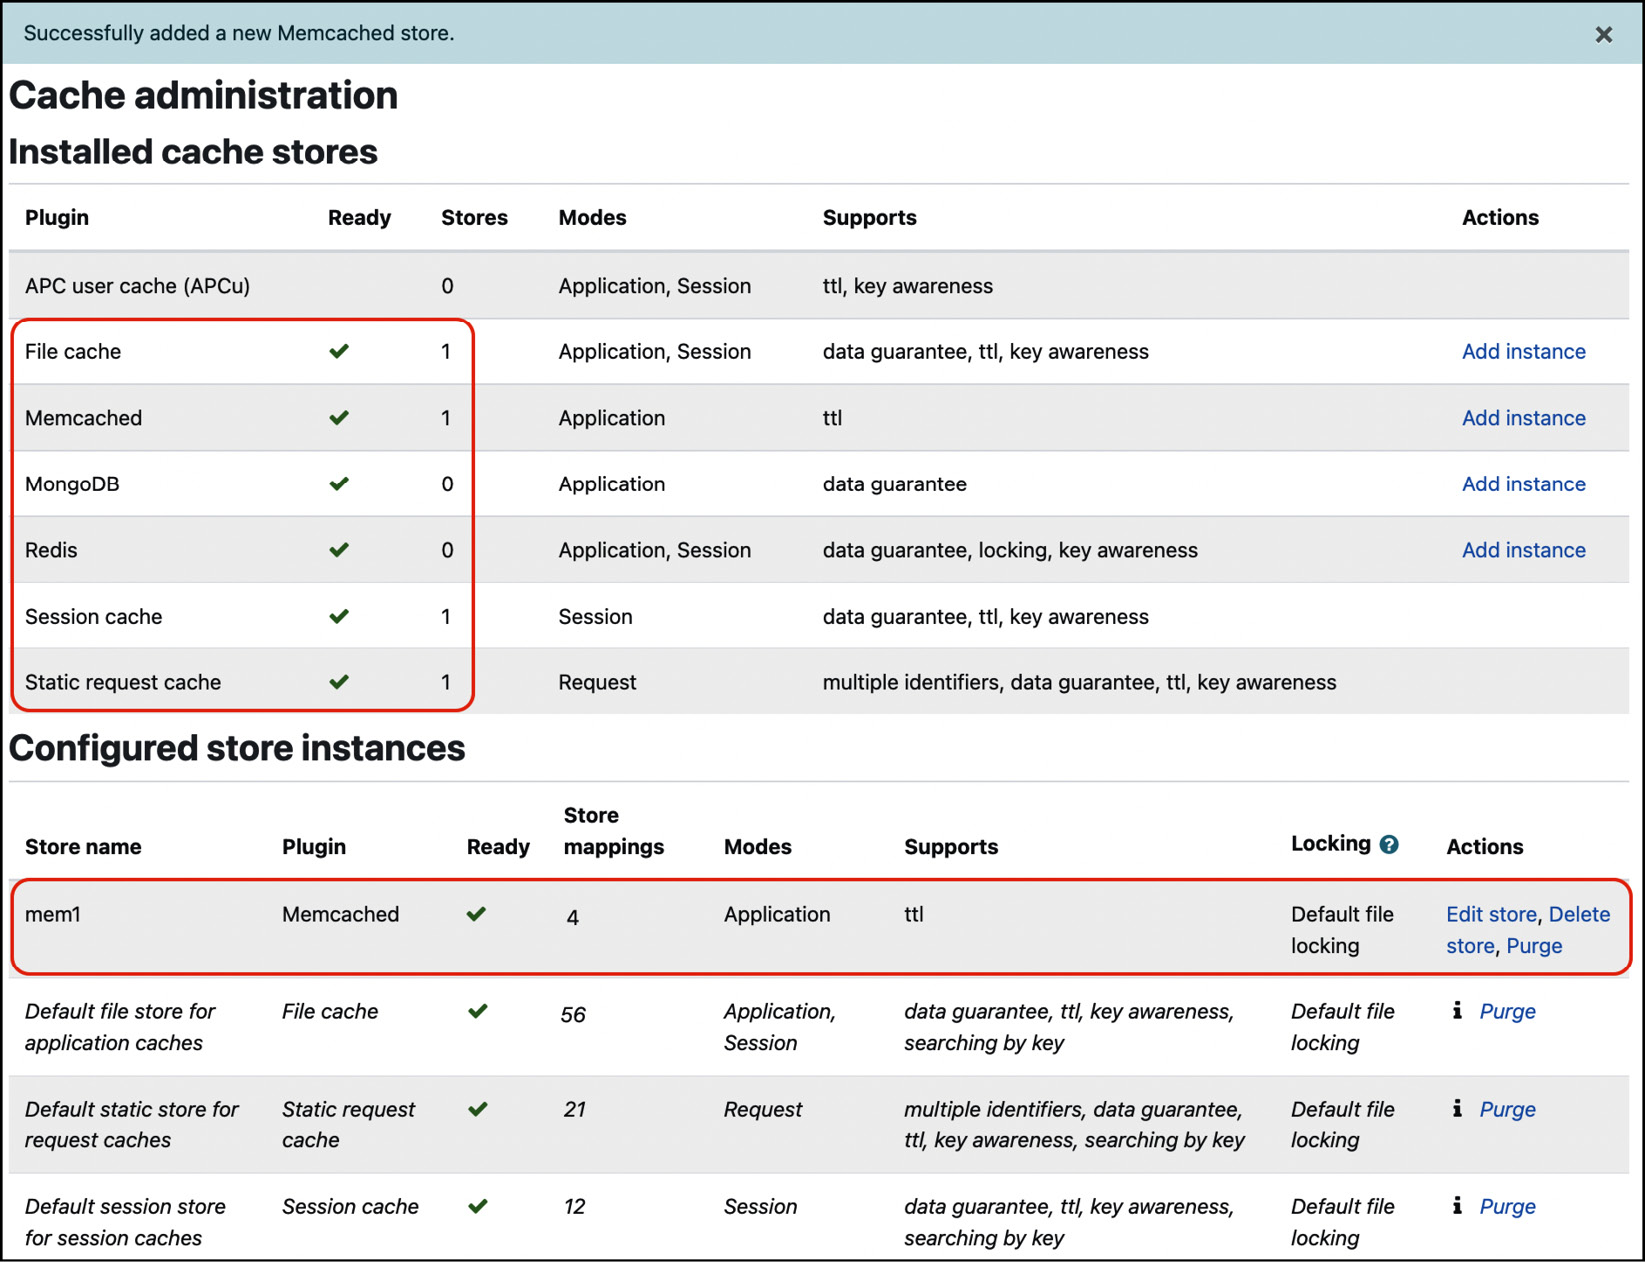
Figure 15.8 – Cache stores
For each configured cache type, you can add instances via the respective link in the Actions column. Each cache store has different settings, depending on the cache backend’s supported features. Here are the parameters of the popular Memcached store, which are documented at docs.moodle.org/en/Caching#Memcached:
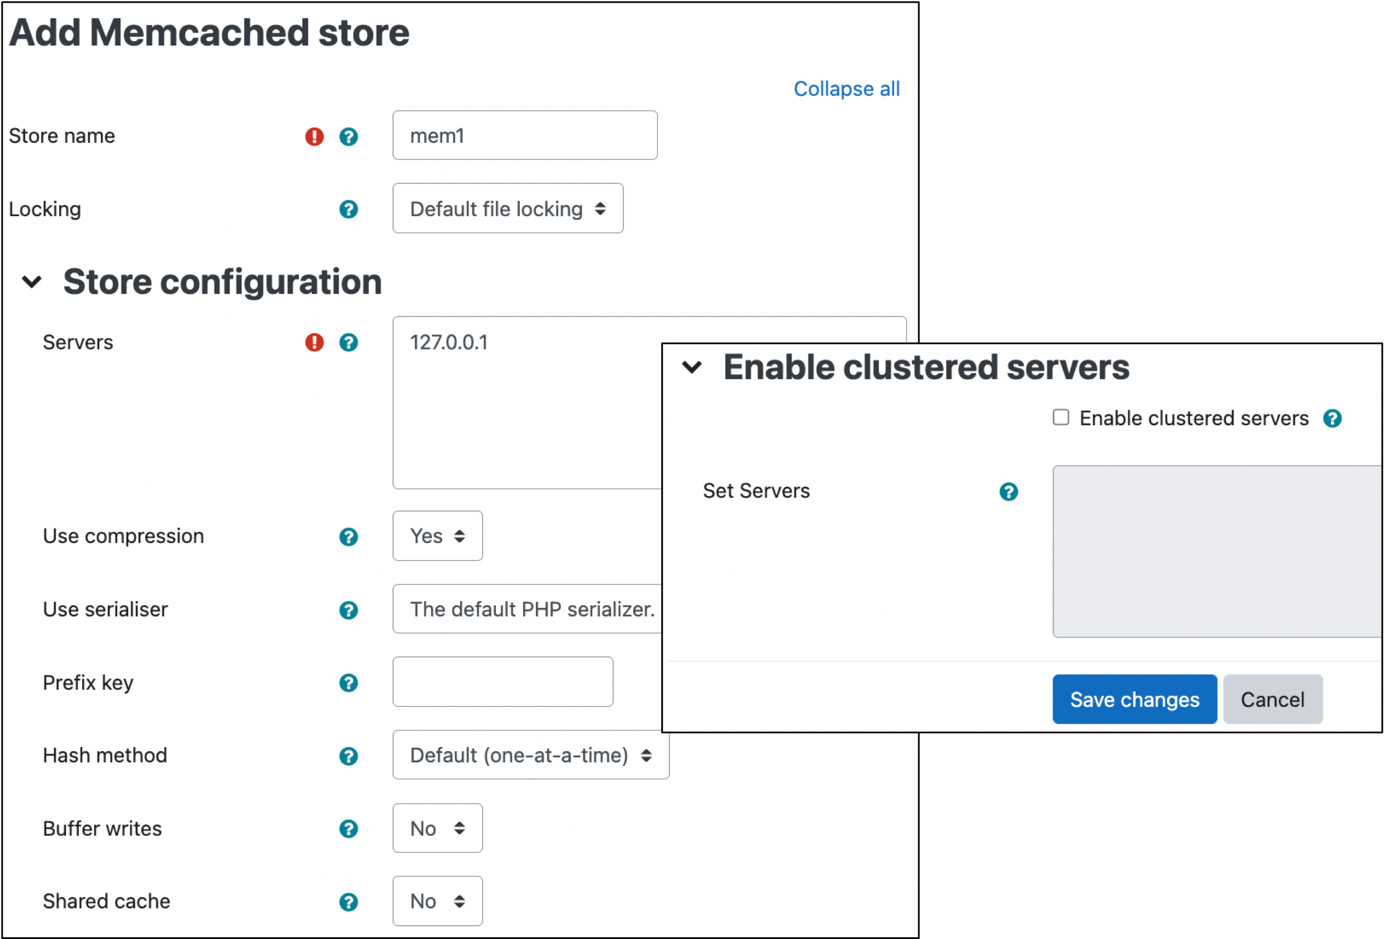
Figure 15.9 – Adding Memcached cache store
Once you have set up your cache store and cache instance(s), you must add store mappings, which are part of the cache definitions we will cover next.
Cache definitions
Different features in Moodle support caching. Years ago, there was a single monolithic cache that was either harnessed by a feature or wasn’t. Now, via MUC, each feature is represented via cache definitions, which can be configured individually. At the time of writing, over 90 cache definitions are available, and it is expected that this number will increase with each version. For each definition, the following information is available:
- Definition: Name of the feature that is being cached.
- Mode: Cache types (Application, Session, or Request).
- Component: The Moodle component that the definition belongs to (core or module).
- Area: The section the feature belongs to—only relevant to developers.
- Store mappings: If no customization has taken place, this will be the default cache store of the cache mode; otherwise, the newly set value.
- Sharing: By default, this will be Site identifier. When modified, the possible values are Everyone, Version, and Custom key (see next bullet list).
- Can use local store: Only relevant on multi-server systems.
In the Actions column, you have Edit mappings and Edit sharing options, as well as a Purge option to purge the cache for this specific definition.
Edit mappings lets you specify which cache store is being used as the primary store and, for some definitions, as the final store. This is where you specify which store is used for a particular feature (cache definition).
By default, each cache definition is shared across the instance of the site. However, there are scenarios where you might want to change this to any of the following sharing options:
- Everyone: Every user in the system.
- Site with the same ID: If you run a single version of Moodle on a single server, this is identical to the preceding point. If you run Moodle on a multi-server setup, all systems will be included.
- Sites running the same version: If you run multiple Moodle instances from one wwwroot, only sites with identical version numbers will be included.
- Custom key: If you run multiple Moodle instances from one wwwroot, you can group them via a custom key. For example, you might want to cache all the instances of one country in one store.
To clear the cache of a specific definition, simply select the Purge option. The following screenshot shows some cache definitions and the described values:
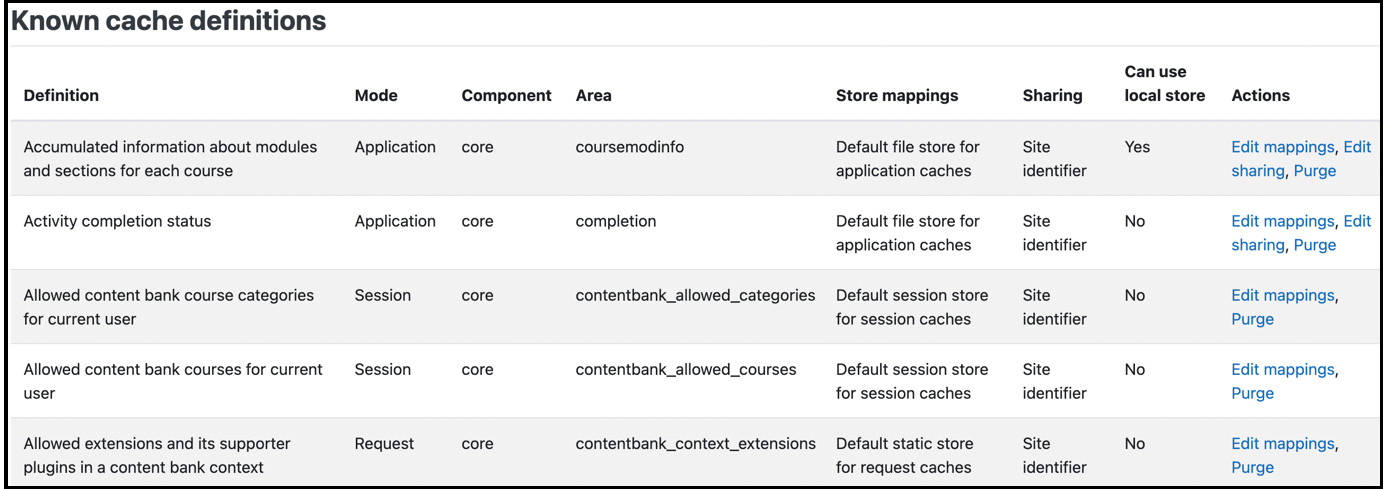
Figure 15.10 – Cache definitions and mappings
There are two more elements on the Site administration | Plugins | Caching | Configuration page we haven’t covered yet:
- Summary of cache lock instances: There are different locking mechanisms in shared environments, caches being no exception. By default, Moodle ships with a default file locking mechanism, and it would be possible to install additional lock instances. However, at the time of print, no such plugins are present for Moodle 4.x at moodle.org/plugins.
- Stores used when no mapping is present: You can specify which default mappings will be used for which cache type.
Now that we have covered all the relevant concepts of MUC, let’s look at the items to consider when optimizing your Moodle site.
Configuring and testing MUC
We have already explored the complexity of MUC. While this provides enormous flexibility in terms of granular optimization, it makes it impossible to come up with a one-size-fits-all configuration. Somebody in the Moodle community once compared the MUC control panel with a big mixing desk at a concert: it gives you a lot of knobs to play with, but unless you know what each of them does and how they work together, you are unlikely to get good results.
Several factors impact the configuration of MUC:
- Usage of the system (volume, diversity, functions, and type)
- Underlying infrastructure (single server, multiple servers, virtualization, and so on)
- Types of cache stores used
In particular, when talking about the usage of the system, it is almost impossible to quantify this since it’s constantly changing. During the summer break, there will be minimal usage; during exam time, the load on the system is likely to rise, and so on.
Performance optimization is an ongoing exercise that is accompanied by regular performance testing. Moodle provides a basic performance test for different cache types (Site administration | Plugins | Caches | Test performance). Here is an example where you can see the results of 100,000 unique requests; the file cache is significantly slower than the session cache, a behavior that is not unexpected:
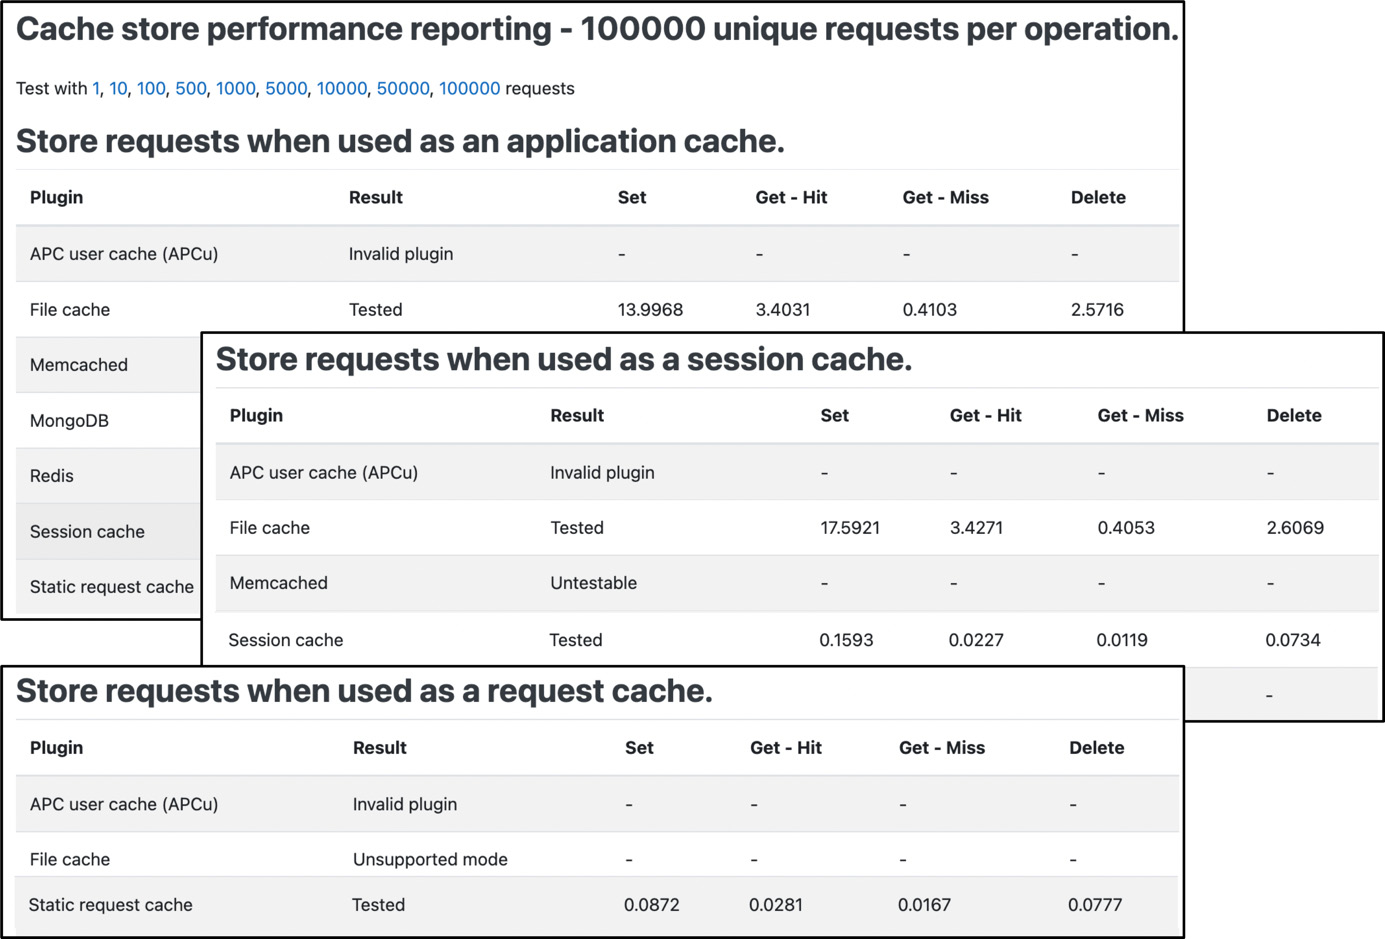
Figure 15.11 – Cache store performance testing
While it is nice to have a built-in performance test tool in Moodle, it has two significant shortcomings: first, some plugins are classed as Untestable, for instance, Redis and Memcached; second, the test runs only mimic some unique requests but do not mirror their behavior if users are on your system. To overcome these drawbacks, proper profiling and monitoring are required, which will be dealt with at the end of this chapter.
There are several caching-related settings spread across the administration area, which you should tailor to your requirements:
- Language caching: We dealt with localization in detail in Chapter 10, Configuring Technical Features, where we covered the configuration of Moodle’s ability to handle multiple languages. In addition to keeping the number of languages to a minimum, language caching should be utilized.
Language packs are cached to speed up the retrieval of language strings. You will find the Cache language menu and Cache all language strings parameters by going to Site administration | Languages | Language settings. Unless you modify a language pack, it is highly recommended that you leave both settings enabled as they cache all the language strings rather than load them dynamically.
- Theme caching: Moodle caches the images and style sheets of themes either locally in a web browser or on a server. Unless you are in the process of designing or modifying a theme, which you shouldn’t be doing on a live system anyway, the Theme designer mode setting, at Site administration | Appearance | Themes | Theme settings, should remain off.
You can clear the theme cache using the Clear theme caches button by going to Site administration | Appearance | Themes | Theme selector.
- JavaScript caching: Moodle makes use of JavaScript and AJAX. The Cache JavaScript setting at Site administration | Appearance | AJAX and Javascript should be kept on unless you are a developer. The same applies to YUI Combo loading on the same page.
- RSS caching: RSS feeds are cached locally. You can modify the time after the cache is refreshed by changing the Timeout parameter at Site administration | Plugins | Blocks | Remote RSS feeds.
- Networking caching: Moodle uses cURL to fetch data from remote sites. The cURL cache TTL setting can be modified by going to Site administration | Server | Performance. The larger the time-to-live value, the better the performance. More on networking in Chapter 19, Setting Up Moodle Networking.
- Repository caching: When browsing external repositories, such as Nextcloud or Google Drive, the file listing is kept in a local cache. The amount of time the listing is kept can be changed via the Cache expire parameter by going to Site administration | Plugins | Repositories | Common repository settings. We covered repositories in Chapter 10, Configuring Technical Features.
You can purge all these caches in a single operation by pressing the Purge all caches button when you navigate to Site administration | Development | Purge caches. Effectively, this clears out all the defined cache stores—for instance, the directories in $CFG->dataroot/cache for the file cache. While this feature is more relevant to developers, it is recommended after installing updates or when your system behaves oddly. You can see an illustration of this in the following screenshot:
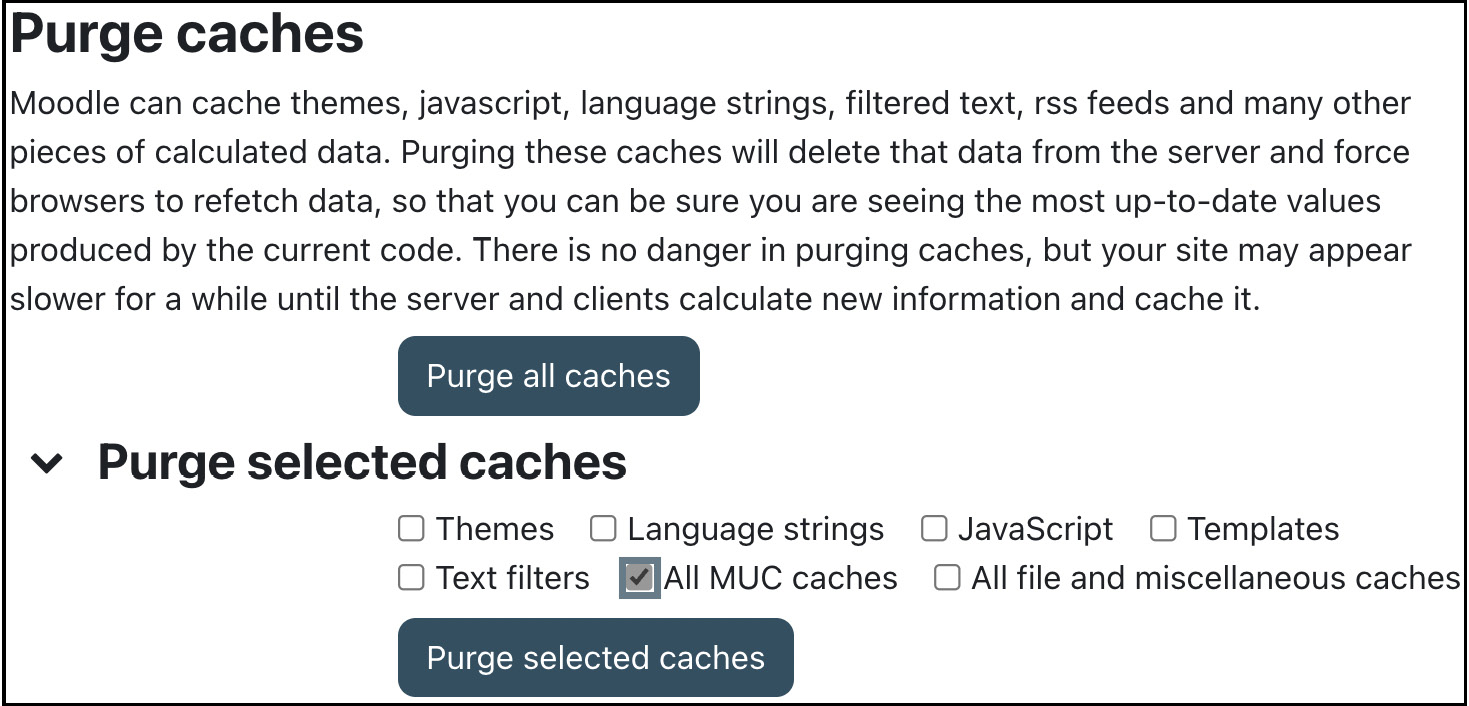
Figure 15.12 – Purging caches
There is also a CLI script to purge caches: php admin/cli/purge_caches.php.
Once you have set up cache stores and configured all available caching options correctly, you should then move on to check that performance-related system settings have been configured properly.
Optimizing Moodle system performance
In this section, we have grouped settings that potentially impact performance without compromising any Moodle features. The topics covered are session handling, cron management and scheduled tasks, global search, and system paths.
Handling sessions
A session is initiated for each user that authenticates against Moodle, which also applies to guests. There are several well-explained settings relevant in a performance optimization context, which can be found by going to Site administration | Server | Session handling:
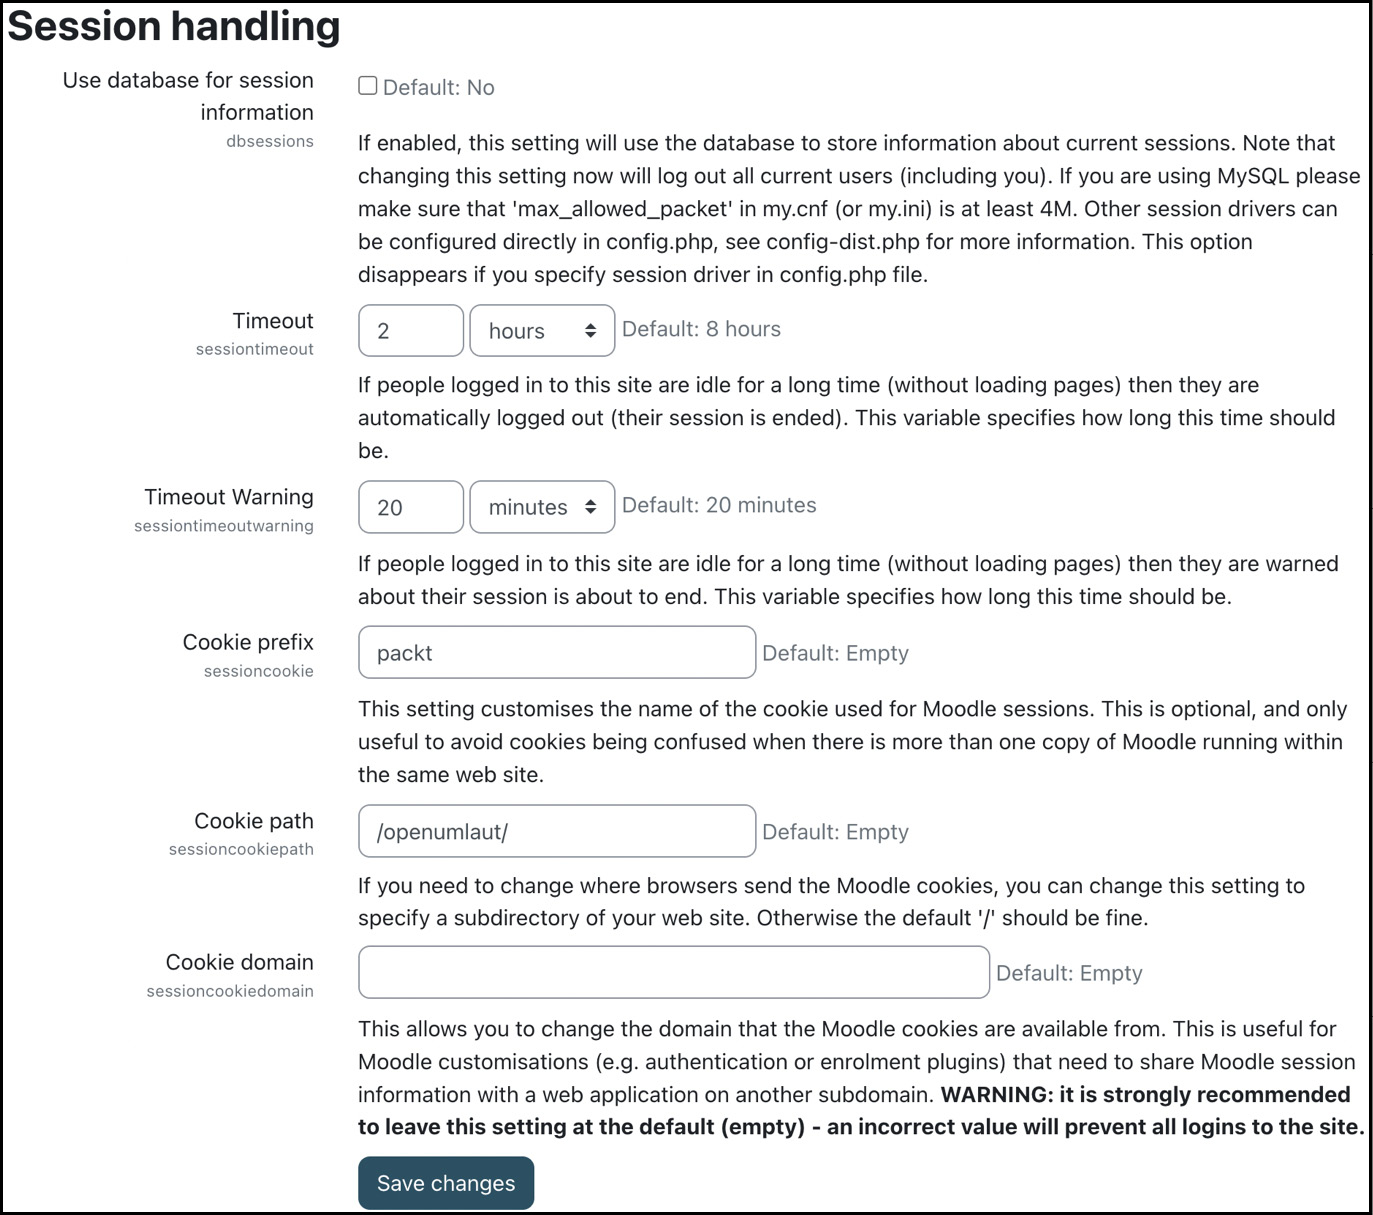
Figure 15.13 – Session handling
Moodle manages sessions and cookies very well. However, when problems occur, it is sometimes necessary to intervene manually. This should be done locally in the web browser if a specific user experiences issues (clear cache and cookies) or on the server if the problem affects multiple users. The latter is done by clearing the mdl_sessions table if sessions are stored in the database or emptying the $CFG->dataroot/sessions directory if the sessions are stored in files. Bear in mind that all logged-in users will be logged out.
You can also kill all user sessions via a CLI script that performs the preceding steps via a single command: php admin/cli/kill_all_sessions.php.
Cleaning up old sessions is done in the background by a so-called scheduled task. Cron management and scheduled tasks are the topics of the following subsection.
Managing cron and scheduled tasks
Moodle performs a significant number of background tasks regularly. The system script that performs these tasks is known as a cron script and is executed by the cron process.
Important note
The Moodle cron script runs different tasks at differently scheduled intervals.
The following diagram illustrates when scheduled tasks are executed in Moodle:
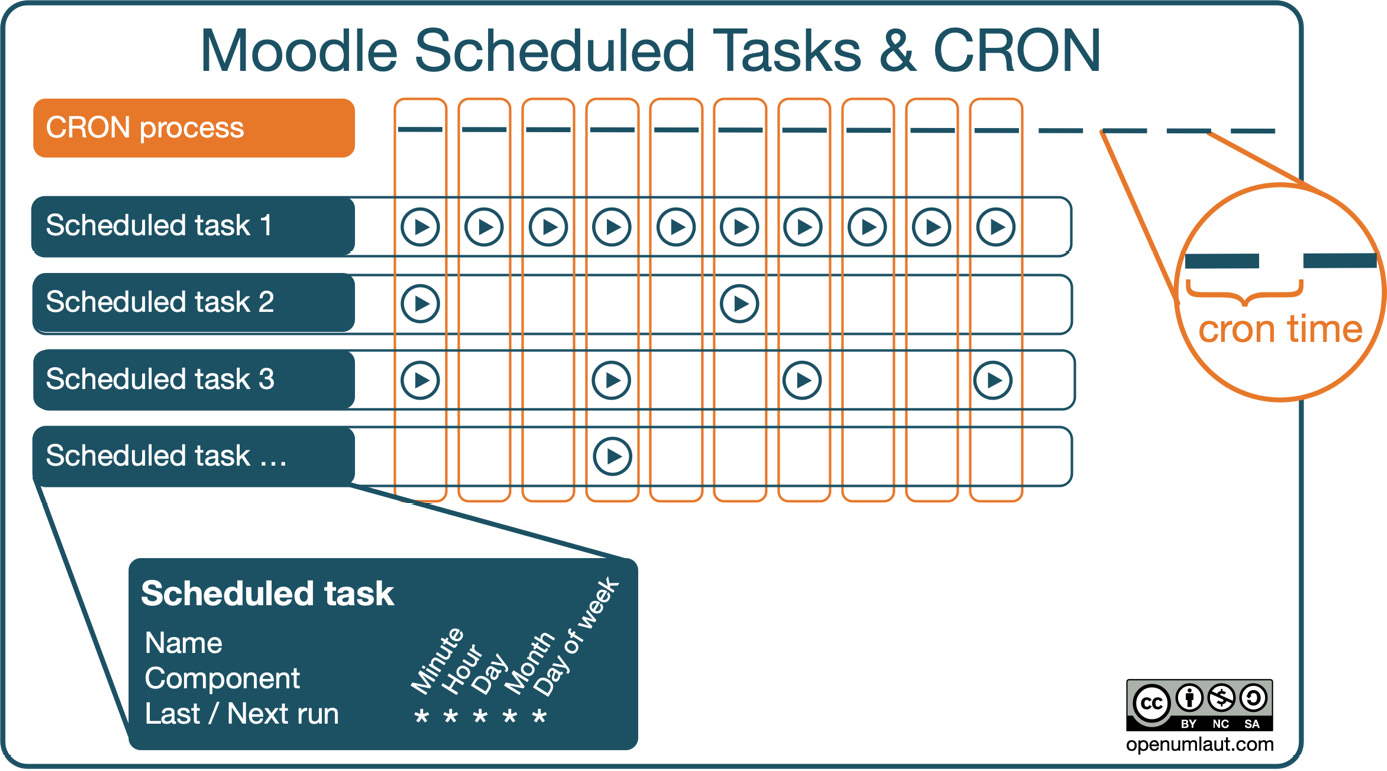
Figure 15.14 – Scheduled tasks and the cron process
Cron is a system process that triggers Moodle’s cron script, which determines which tasks are executed at a particular time slot.
Important note
The cron process should run every minute.
Moodle comes with a task scheduler (Site administration | Server | Scheduled tasks) that lets you precisely configure which routine job runs when and how often. The following screenshot shows some selected tasks (I hope your eyesight is better than mine):
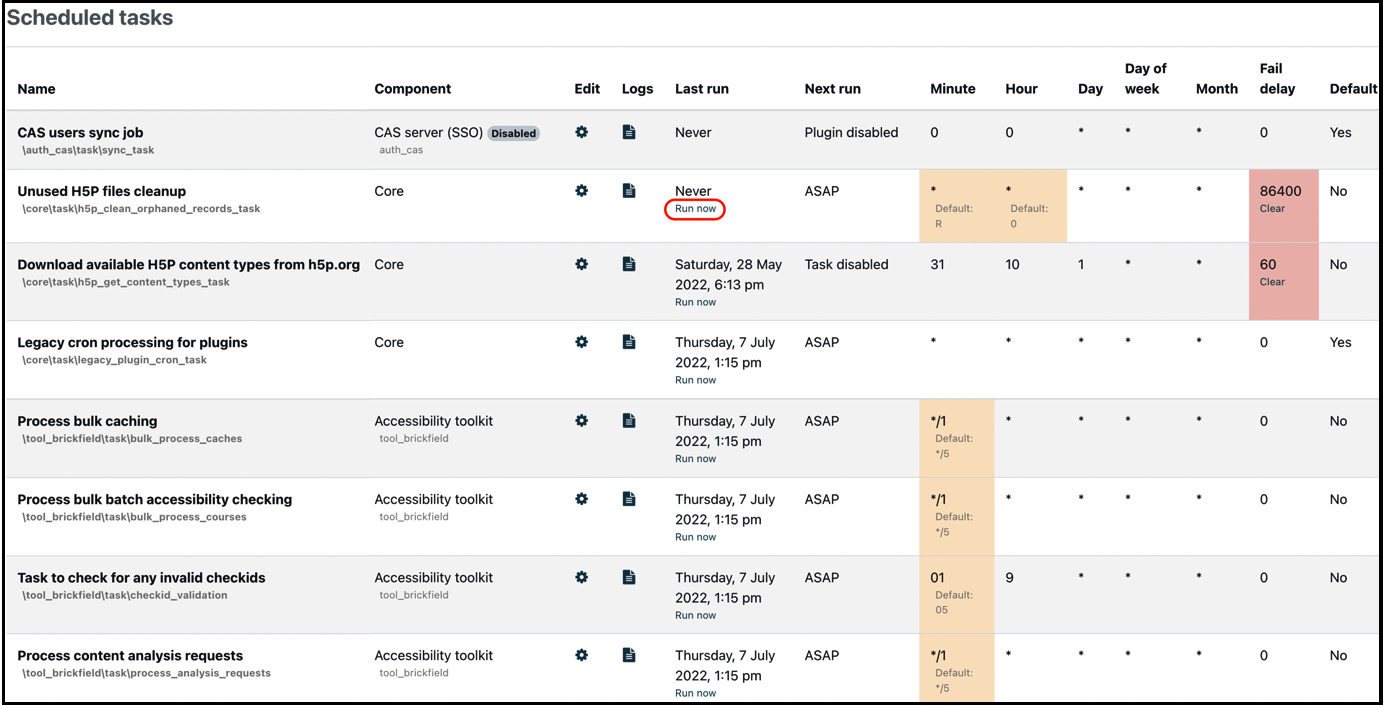
Figure 15.15 – Scheduled tasks
The following information is provided for each scheduled task:
- Name: Name and internal location of the task
- Component: Moodle component that triggers the task
- Logs: Details on each task execution, including duration and database reads/writes
- Last run: Date and time of the previous task execution or Never
- Next run: Date and time of subsequent task execution or ASAP
- Minute, Hour, Day, Day of week, Month: Schedule information in Unix cron format:
- *: every minute, hour, day, day of the week, and month
- */x: every x minutes, hours, and so on
- x-y: every minute between x and y past the hour or every hour, between x and y
- 0 = Sunday, 1 = Monday, and so on
- Fail delay: Number of seconds to wait before reattempting a failed task
- Default: Specifies whether the task has been modified
You must select the configuration icon in the Edit column if you wish to change the schedule for any tasks. As an example, we have picked the Check for updates task, which is executed at 10:48 every day, every month, and every day of the week:
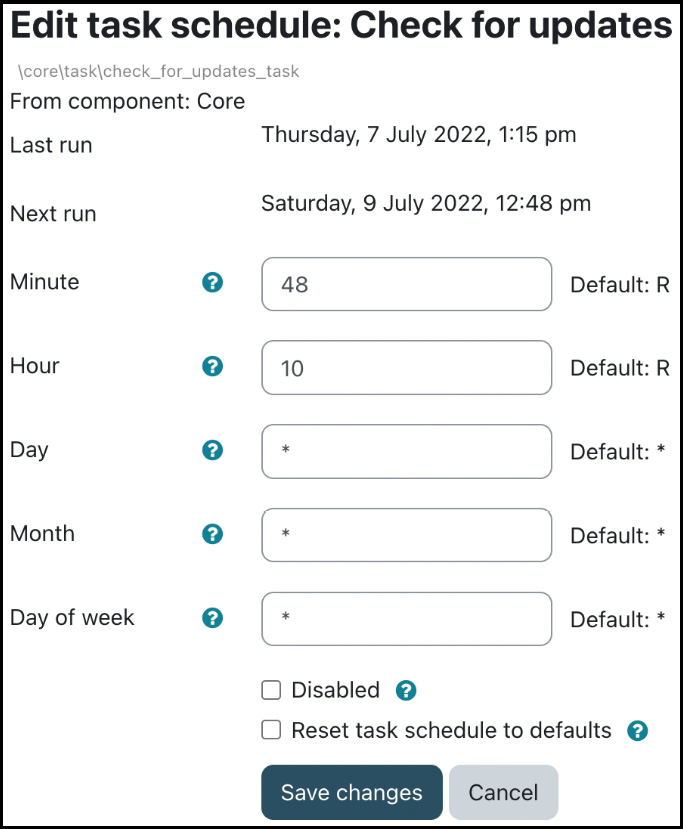
Figure 15.16 – Editing task schedule
In addition to the already covered scheduling settings, you can pause a task (Disabled) and revert the original settings (Reset task schedule to defaults). The default settings have been set with performance in mind. However, you might want to fine-tune these, considering any idiosyncrasies in your setup.
There are some things worth mentioning when dealing with scheduled tasks and the cron process:
- Tasks can be kicked off manually using the Run now option. For this action to appear underneath each enabled task, the Allow ‘Run now’ for scheduled tasks option in Site administration | General | Security | Site security settings must be set, and Path to PHP CLI in Site administration | Server | System paths has to be configured correctly.
- Multiple tasks can run in parallel. The concurrency limits for scheduled and ad hoc tasks can be configured at Site administration | Server | Tasks | Task processing.
- A cron run can take longer than the specified time between two executions, and the new tasks will be queued and executed at the next run if this is the case. The task lifetime before the task is freed can also be scheduled, and ad hoc tasks can be configured at Site administration | Server | Tasks | Task processing:
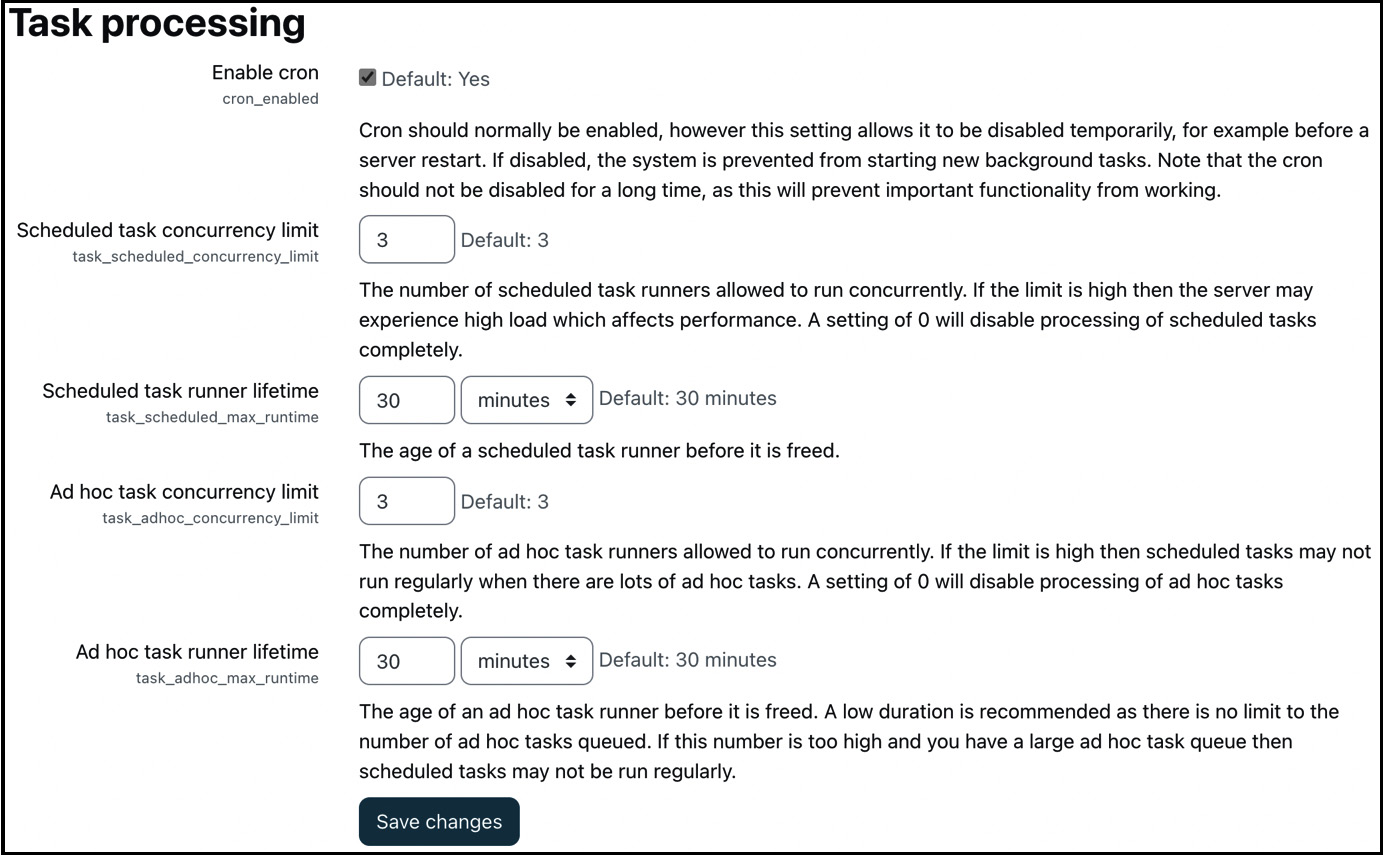
Figure 15.17 – Task processing settings
To view which tasks are running, go to Site administration | Server | Tasks | Tasks running now. Any processes in progress will be listed, including the time the process has already run.
Details of each task are logged in Moodle and can be viewed at Site administration | Server | Tasks | Task log. Via the report filters, you can drill down to processes that have taken a long time or tasks that have failed to complete. The settings at Site administration | Server | Tasks | Task log configuration let you reduce the number of log entries that are written to the log table:

Figure 15.18 – Task log configuration
We have already covered this as part of the installation, but it is worth reiterating that the method by which you call the Moodle cron job can have a significant impact on your system performance, especially on larger installations. If the cron.php script is invoked over HTTP (either using wget or curl), more memory is used than calling directly via the php –f command.
Moodle’s memory management has proven to be very efficient. However, there are scenarios when extra memory is required to execute complex PHP scripts, and cron is a candidate for such a complex script. To increase the memory limit, change the Extra PHP memory limit setting by going to Site administration | Server | Performance.
An operation that relies heavily on scheduled tasks and that potentially has a significant impact on system performance is global search, which we are configuring in the following subsection.
Configuring global search
Moodle comes with a powerful global search facility, supporting different content types, content areas, access permissions, and pluggable search engines.
Important note
Global search lets users search everywhere in Moodle they have access.
The following diagram is a simplified illustration of how global search works in Moodle:
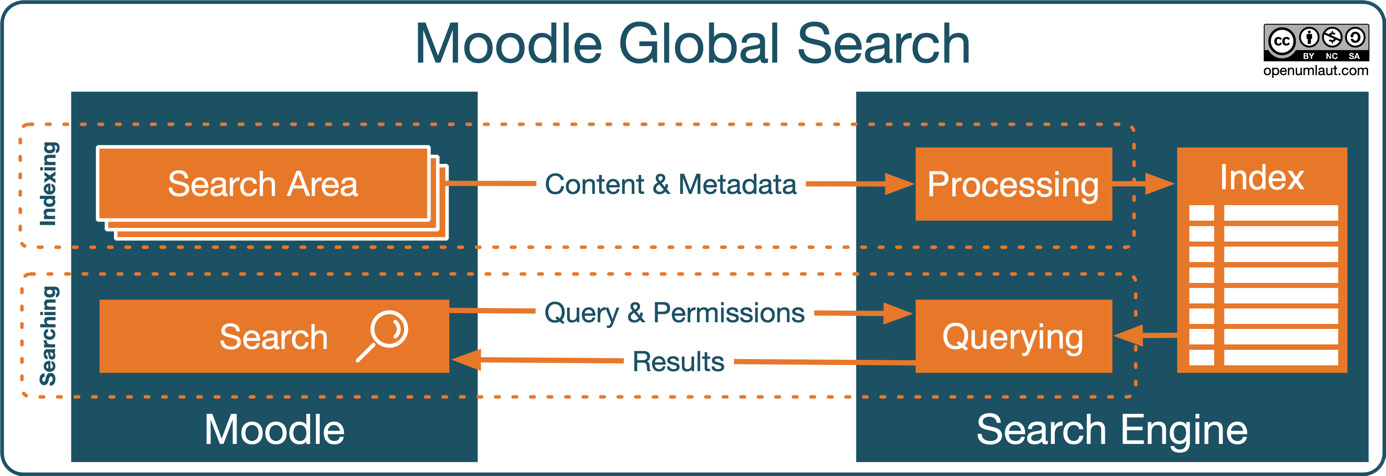
Figure 15.19 – Moodle global search
The indexing process (top) is triggered by a scheduled task, during which any content and metadata created, updated, or deleted since the last run is sent to the search engine. The search engine never requests anything from Moodle; there is no content crawling. Moodle global search can be limited to search areas, such as assignment activity information, text block content, or received messages. The search engine processes the received data and stores it in its index.
The searching process (bottom) is initiated by a user keying in a search word or phrase. The query is sent to the search engine alongside the user’s access permissions, which are taken into account by the querying mechanism in the search engine. This last point is critical to ensure that users are only presented with results they have access to. The results are returned to Moodle and displayed to the user.
Moodle ships with one internal and one external search engine plugin:
- Simple search: A built-in search engine supporting basic search operations.
- Solr: According to solr.apache.org, “Apache Solr is the popular, blazing-fast, open source enterprise search platform built on Apache Lucene.” Solr supports file searches and advanced search operations, such as Boolean operators, wildcards, prefixing, proximity searches, and boosting.
You will find additional search engine plugins at moodle.org/plugins/?q=type:search, for example, Elastic or Azure Search.
To manage global search, go to Site administration | Plugins | Search | Manage global search, where you should see a table of setup steps to go through:
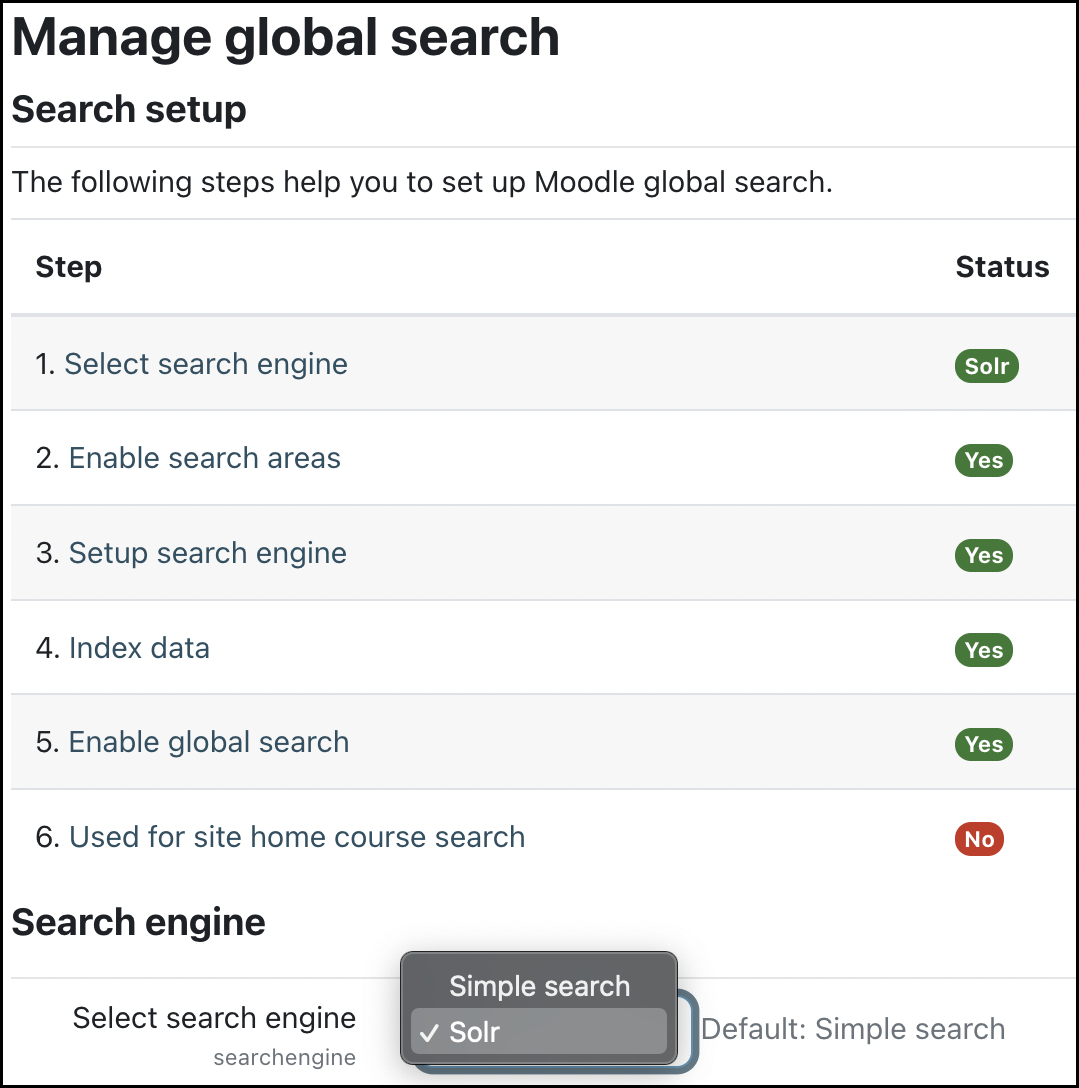
Figure 15.20 – Moodle global search setup
Let’s go through the six actions step by step:
- Select search engine: The options are Simple search and Solr unless you have installed third-party search engine plugins.
- Enable search areas: Search areas are content groups that are indexed separately. By default, global search indexes all search areas; however, you can enable and disable individual search areas in Site administration | Plugins | Search | Search areas. By disabling a search area, you improve search speed but exclude its content from appearing in search results. You might choose to disable the User search area to exclude links to user profiles from global search.
- Setup search engine: Simple search does not need any configuration; others do.
- Index data: Indexing is triggered by the Global search indexing scheduled task. Alternatively, there are multiple indexing actions in Site administration | Plugins | Search | Search areas, namely updating, reindexing, and deleting the entire index or indices of an individual search area.
- Enable global search: You enable global search in Site administration | General | Advanced features. Before enabling the feature, you should first configure global search and index the site contents. Otherwise, searches can return incomplete results.
- Used for site home course search: If enabled, search results will include course information visible to users, even if they don’t have access to the course content.
You will find the last setting underneath the list of setup steps among various configuration options dealing with search options, search scopes (for instance, only courses the users are enrolled in), and display preferences. These settings are well explained onscreen, so we are not repeating them here.
Some more parameters are grouped under Search management at the bottom of the global search configuration screen. These options are helpful when making changes on sites with extensive search indexes that take a long time to rebuild.
Since the Solr plugin ships with Moodle, here are some pointers that will help you use the powerful search engine as part of your setup:
- Solr must be installed separately, either on the same or on a dedicated server.
- Solr configuration in Moodle is located in Site administration | Plugins | Search | Solr. There are three groups of parameters: configuration (Solr host information and SSL support), file indexing, and query-only alternate settings.
- Solr installation and configuration in Moodle have been well documented at docs.moodle.org/en/Global_search.
The last configuration options in the system performance section are system paths, which we will set in the following subsection.
Setting system paths
An operation that Moodle performs regularly is the listing of directories. The operation can either be run using Moodle’s internal routine coded in PHP or a native version of the function provided by the host operating system. The latter approach is significantly faster since it reduces the load on your server, but it is only supported in Unix environments.
You can specify the path for the du command by navigating to Site administration | Server | System paths, as shown in the following screenshot. On most systems, the location of the executable is /usr/bin/du. Once specified correctly, this will accelerate the displaying of the directory content, especially if it contains many files:
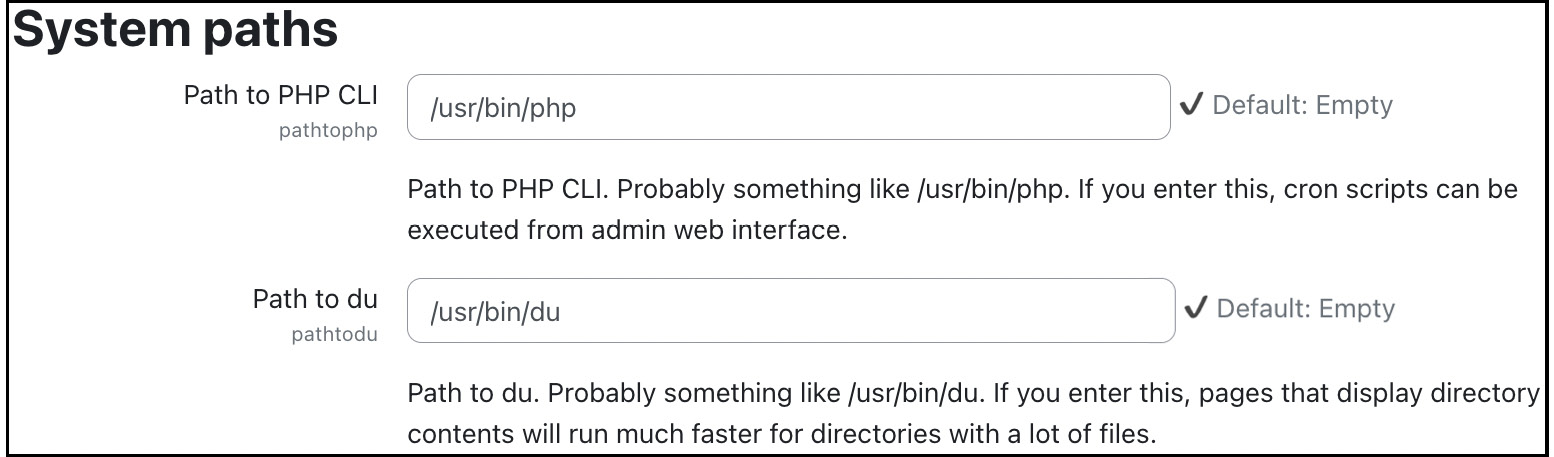
Figure 15.21 – System paths
This concludes the section on system performance. To ensure that any optimization leads to better performance and user experiences, you need to profile and monitor your Moodle system, which we will deal with in the last section of the chapter.
Moodle performance profiling and monitoring
When you set up your Moodle system, you can take some initial precautions to optimize the performance of your LMS. However, the real test is when Moodle is in full operation—that is, when the system is under load (“There is no test like production!”).
We will be looking at Moodle’s built-in profiling tools to let you monitor your Moodle system regularly. While application monitoring cannot be seen as a standalone exercise, we won’t be dealing with system profiling since this is beyond the scope of this book.
We will cover three supported tools: Performance info, Tideways, and JMeter.
Performance info
Moodle provides some basic profiling information you can activate in Site administration | Development | Debugging, where you have to enable the Performance info option. This feature displays the execution time, RAM usage, the number of files in use, CPU usage and load, session size, and various filter and caching measures (less information will be shown on a Windows-based installation).
Performance info further displays information on the caches used on the particular page. For each cache, hits, misses, and sets are shown. The caches are highlighted using traffic light colors: red uses up the most, orange some, and green (or no color) uses up the least resources. These signals are rather good indicators to identify potential performance issues.
The data will be displayed in the footer of Moodle as long as the theme in use supports it—for instance, Boost.
You can see an overview of Performance info in the following screenshot:
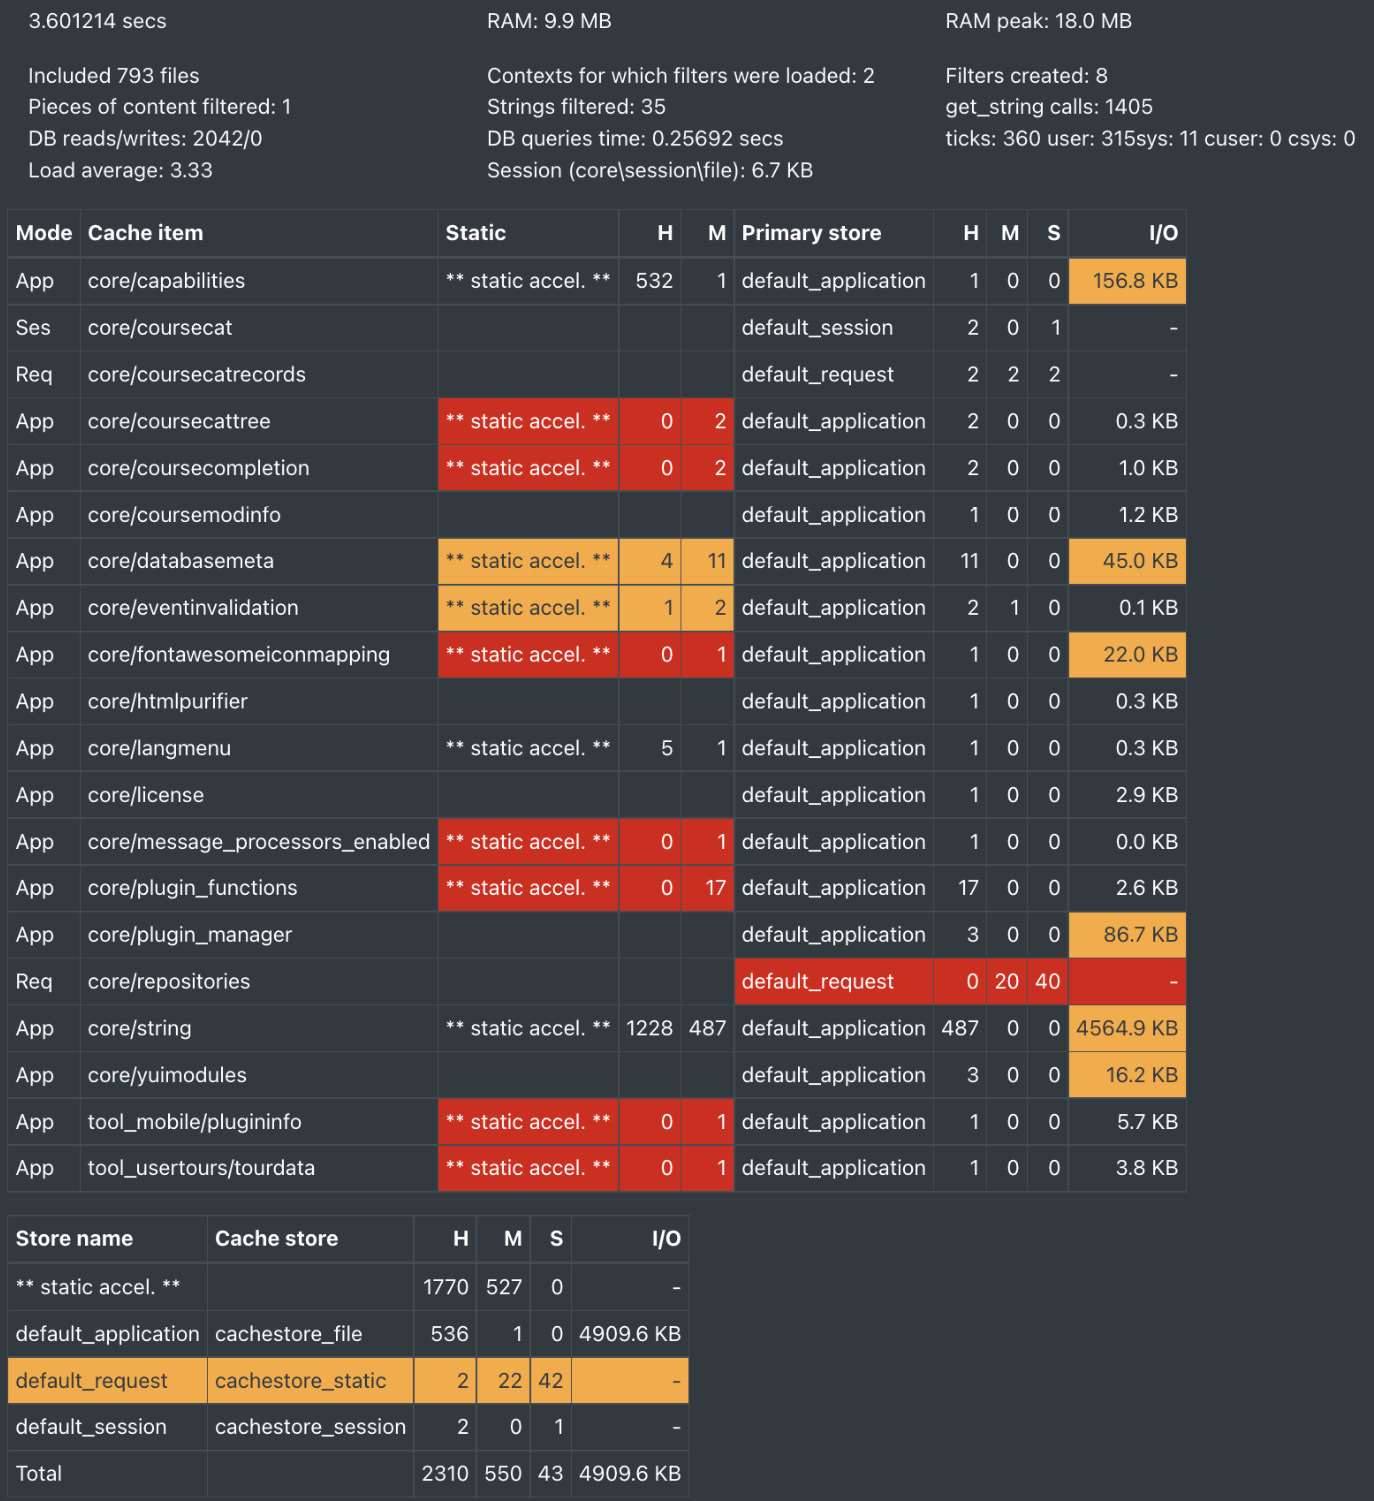
Figure 15.22 – Performance info
Performance info provides data on the overall Moodle system and its cache items. If you require more in-depth information, Tideways profiling might be helpful.
Tideways profiling
Moodle supports profiling at the PHP level. While this is mainly targeted at developers, it may be helpful for you to identify bottlenecks in your system. Internal profiling is built on top of Tideways, a replacement for XHProf, which allows the profiling of PHP pages at a relatively low performance cost.
Once you have installed the php-tideways and php-graphviz PHP extensions, you will see a new menu item when you navigate to Site administration | Development | Profiling:
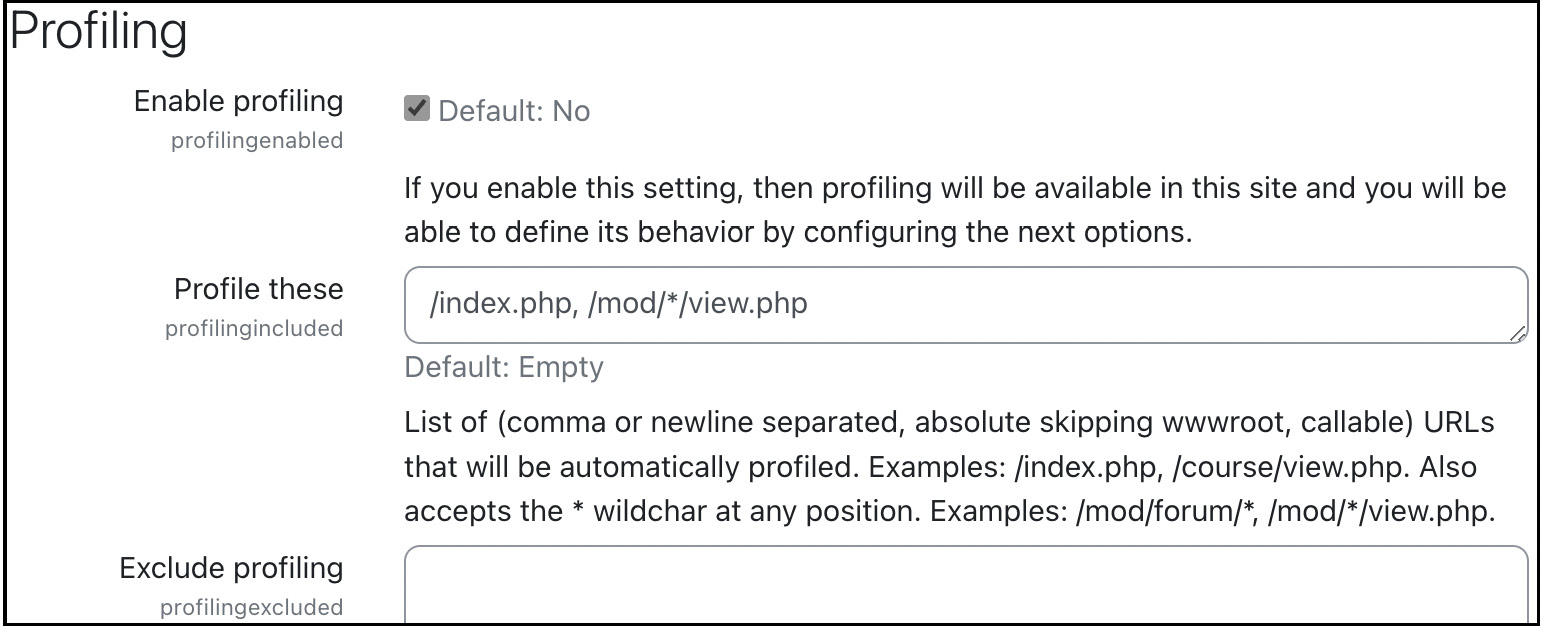
Figure 15.23 – Profiling configuration
The profiler can be configured to run automatically (set the Automatic profiling frequency to any value except 0, and specify URLs in the Profile these field) or manually. The latter can be Selective (you have to initiate the profiling) or Continuous (once it starts, you have to stop it).
As soon as profiling has been enabled, yet another menu item will appear when you go to Site administration | Development | Profiling runs, which lists summary information on all the profile runs that have been executed:
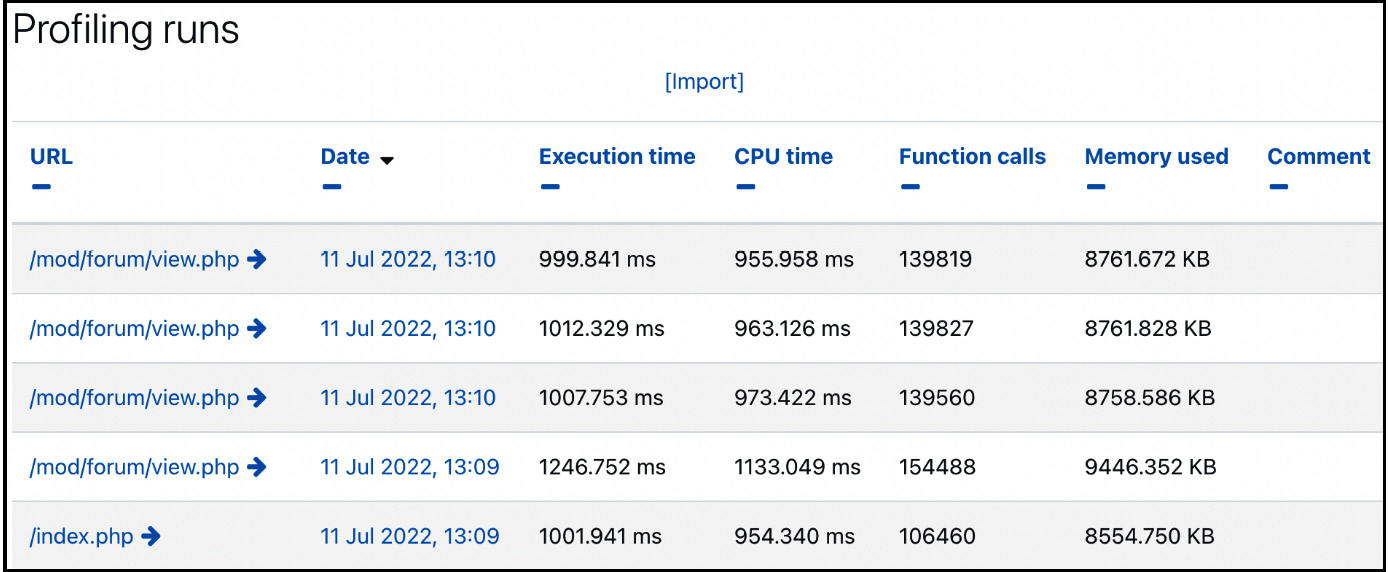
Figure 15.24 – Profiling runs
When you click on the URL or date of a single run, you can mark the run as a reference and provide a comment. You can also view its profiling details, where each function call’s execution times and memory usage are shown in tabular form. From this table, you can view a call graph. However, this requires dot to be installed (part of the Graphviz package) and Path to dot to be specified at Site administration | Server | System paths. The result is a scary-looking graph showing each function call’s order, dependencies, and details.
The general strategy when dealing with profiling is to identify the functions that take the longest to execute, tweak your setup, and check whether the time has been reduced. The difficulty in doing this is ensuring that the test runs occur under the same or, at least, very similar conditions. You can find more information on PHP profiling at docs.moodle.org/dev/Profiling_PHP.
Tideways helps identify issues at the PHP level. Another external profiling tool supported by Moodle is JMeter, as briefly covered in the following subsection.
JMeter support
Apache JMeter is another tool aimed at developers but potentially helpful when locating Moodle bottlenecks. To create a test plan file, set Debug messages to DEVELOPER at Site administration | Development | Debugging, and go to Site administration | Development | Make JMeter test plan. You need to follow the instructions shown in the following screenshot before a test plan can be created:
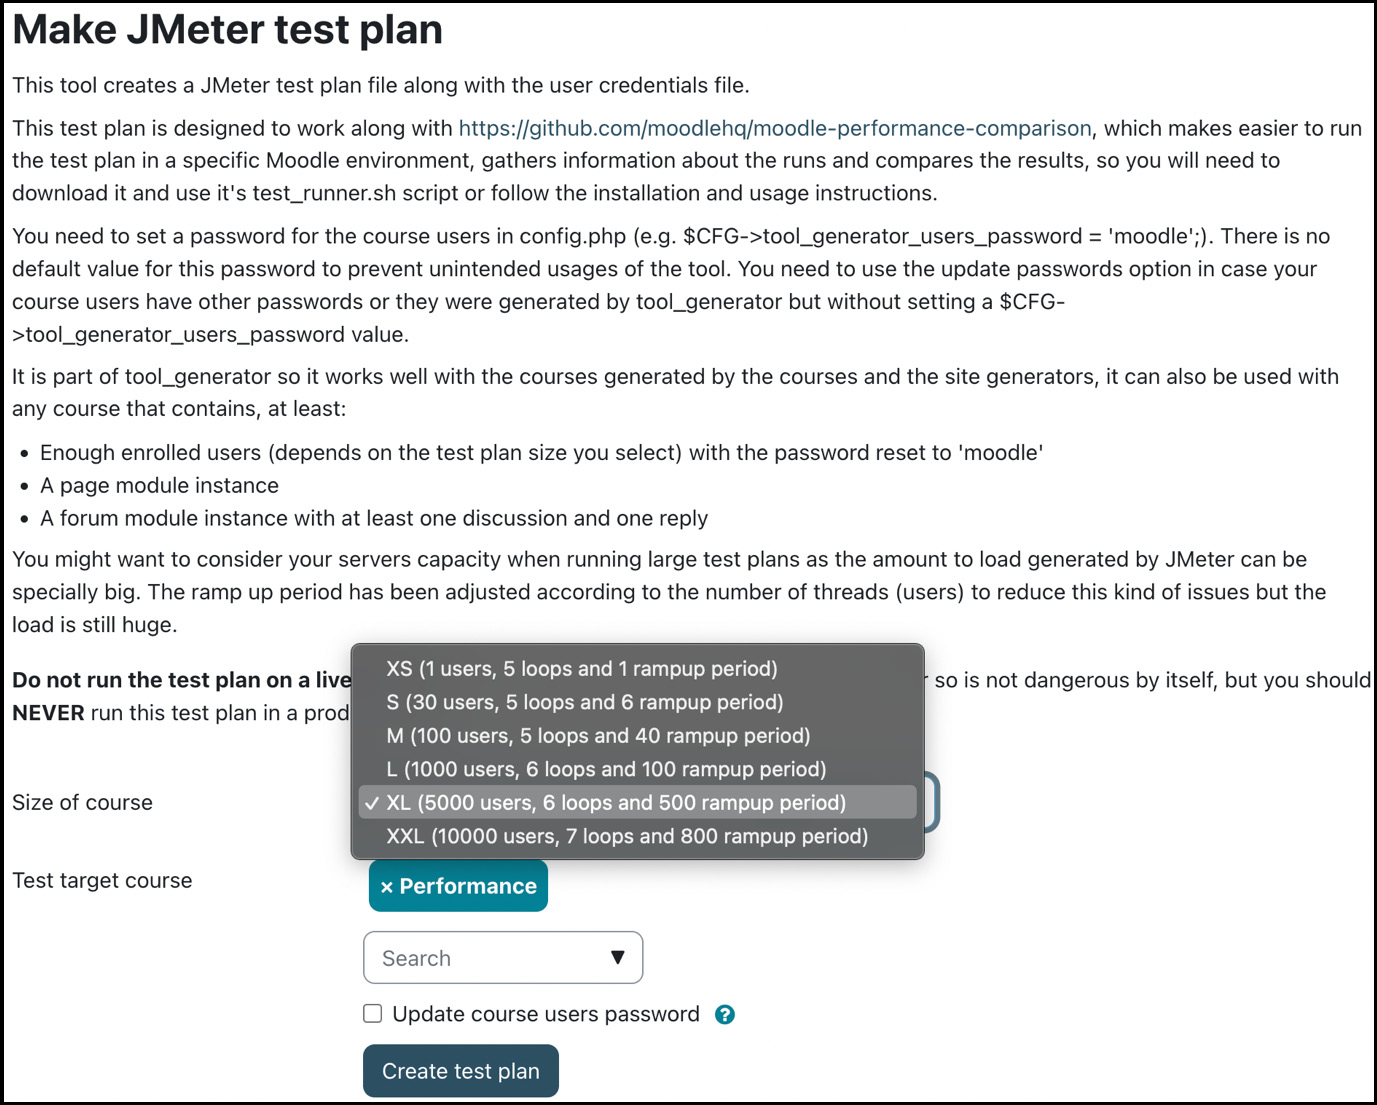
Figure 15.25 – Creating JMeter test plans
The outcome of the performance test run over a Moodle course is a file in JMX format that can then be loaded and analyzed in the JMeter tool, which you need to install separately.
Moodle comes with an unsupported tool that lets you generate random course data, which is helpful in the context of creating JMeter test plans. You have to call the script manually at <yoursite>/admin/tool/generator, where you can simulate having hundreds of courses with various levels and types of activities. You can see an overview of this here:
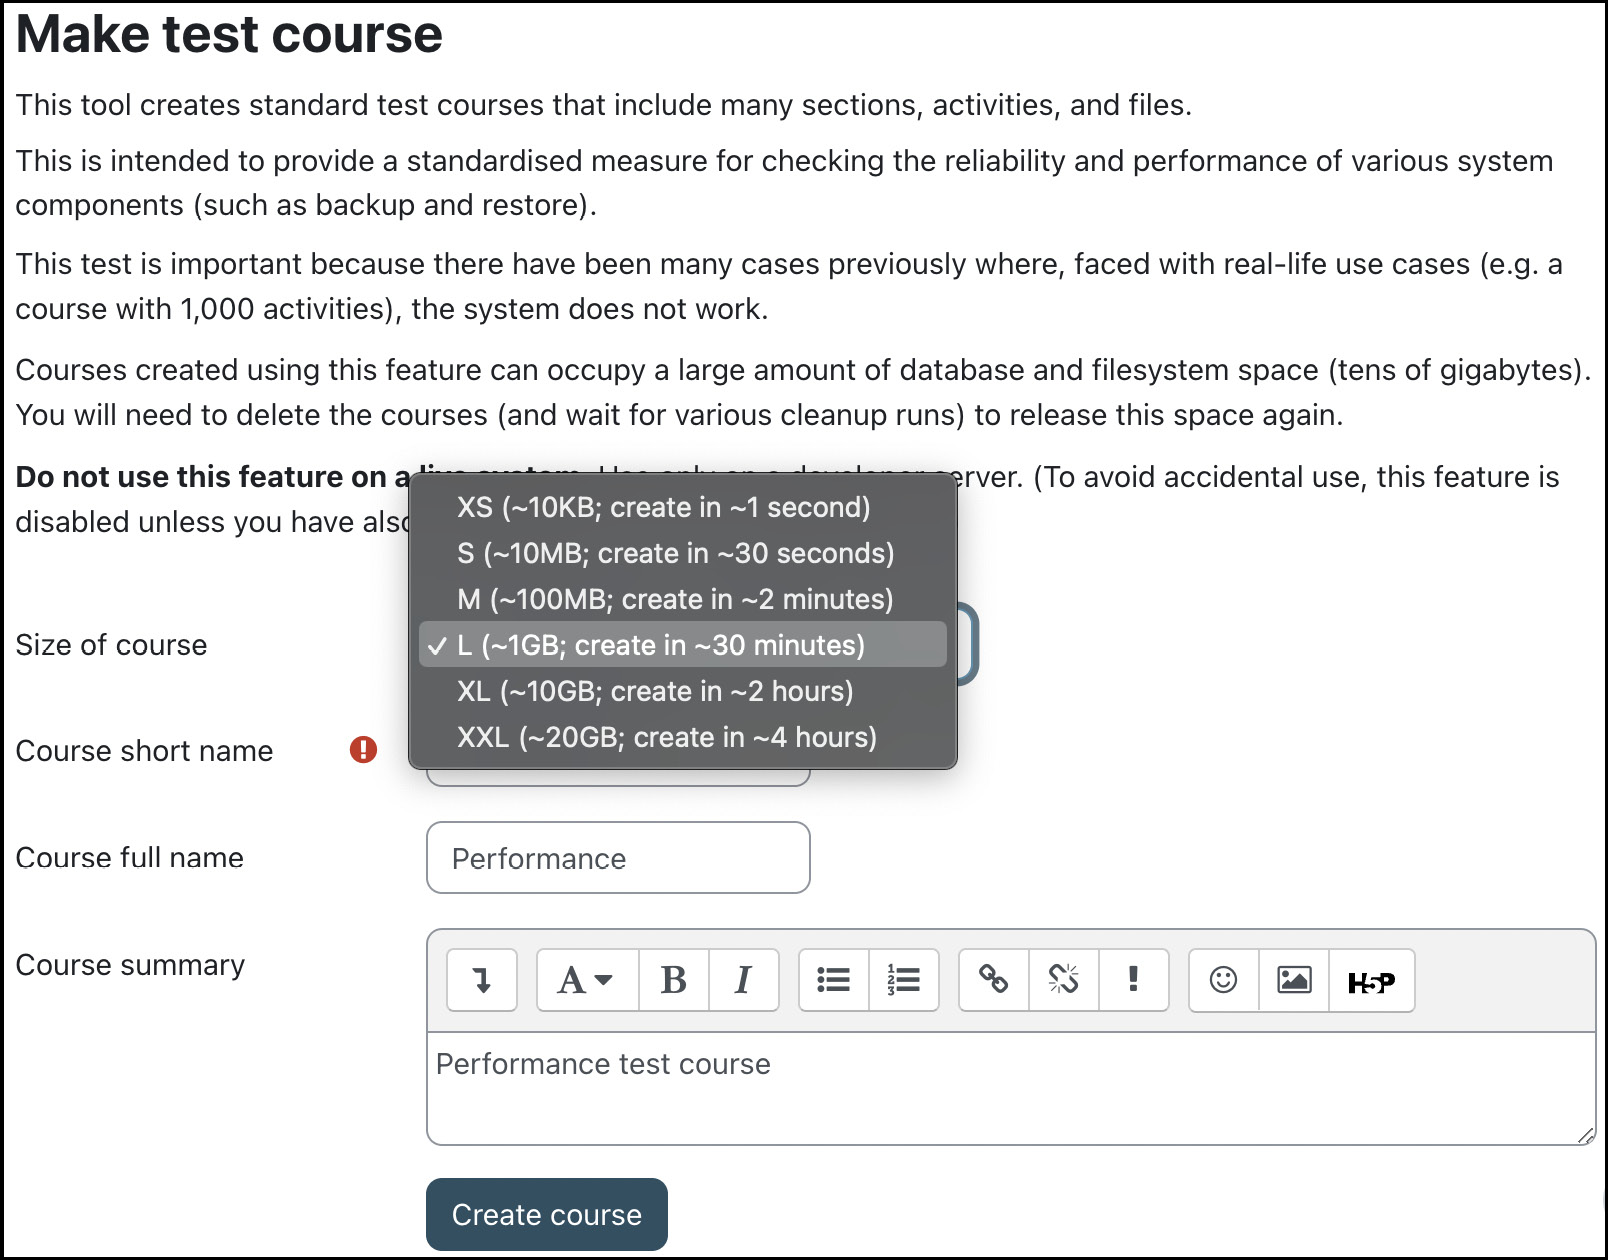
Figure 15.26 – Creating JMeter test plans
You can select Size of course as well as Course short name, Course full name, and Course summary options. Beware that the generation of large courses may take hours and significantly negatively impacts your system performance. Do not perform this operation in production environments.
Now that you have been armed with some profiling and monitoring tools, you can tweak the settings as described throughout the chapter. Take a look at what impact, positive or negative, they have on the performance of your Moodle system.
Summary
You learned how to optimize and monitor Moodle’s performance in this chapter. We first provided an overview of Moodle performance and briefly mentioned optimizing hardware, networks, databases, web servers, and course content. The key Moodle performance topics have been grouped into the following sections:
- Moodle feature performance: We covered performance issues in Moodle functions and Moodle activities.
- Moodle Universal Cache: We dealt with the powerful MUC and configured cache types, cache stores, and cache definitions before testing MUC performance and activating various caching options.
- Moodle system performance: We optimized session handling, cron management and scheduled tasks, global search, and system paths.
The chapter was concluded with a short Moodle performance profiling and monitoring section.
As you have probably gathered from the chapter, optimization is not always straightforward. It depends on various circumstances, such as the system that Moodle is running on, the hardware it utilizes, the network, the number of concurrent users logged in to the system, the types of activities carried out, and so on. While basic optimization is usually straightforward, fine-tuning is a bit of an art in itself. A lot of trial and error (that is, profiling) will be required to achieve the ideal setup for your Moodle system.
Now that your system is ready to perform to its maximum potential, let’s ensure that you have a professional backup and recovery strategy in place, which is covered in the next chapter.