Illustrations
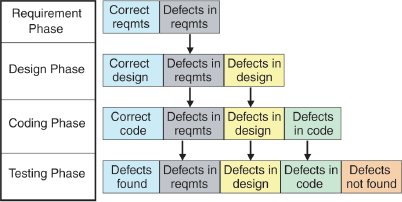
Figure 1.2 How defects from early phases add to the costs. (The black and white figure is available on Chapter.)
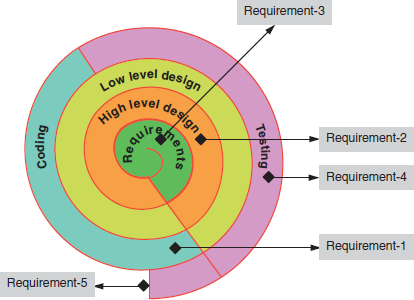


Figure 3.1 Classification of white box testing. (The black and white figure is available on Chapter.)

Figure 3.2 Flowchart for a date validation routine. (The black and white figure is available on Chapter.)
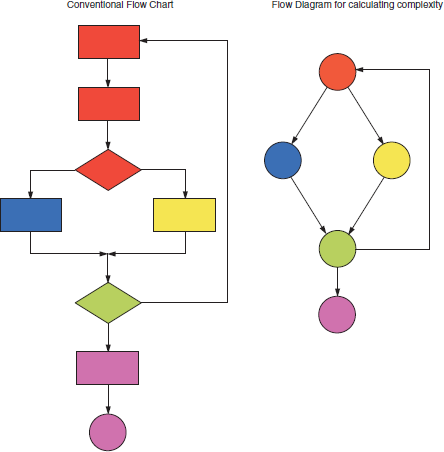
Figure 3.4 Converting a conventional flowchart to a flow graph. (The black and white figure is available on Chapter.)

Figure 4.1 Graphical representation of test case results. (The black and white figure is available on Chapter.)
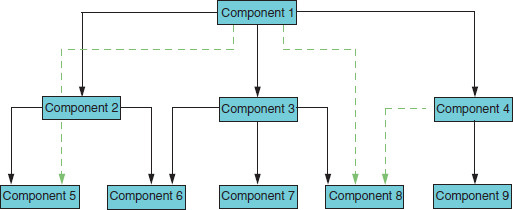
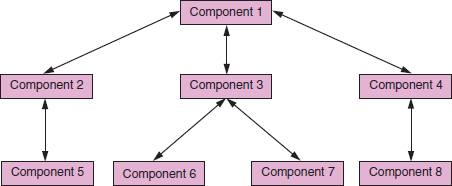
Figure 5.3 Example of bottom up integration. Arrows pointing down depict logic flow; arrows pointing up indicate integration paths. (The black and white figure is available on Chapter.)

Note: Double arrow in the above picture denotes both the logical flow of components and integration approach. Logic flow is from top to bottom, and integration path is from bottom to up.
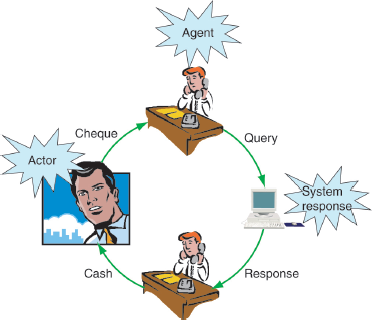
Figure 5.5 Example of use case scenario in a bank. (The black and white figure is available on Chapter.)

Figure 6.1 Different perspectives of system testing. (The black and white figure is available on Chapter.)
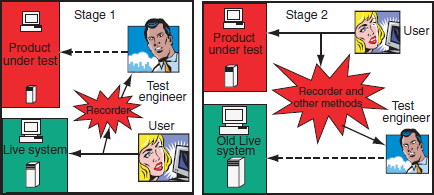

Figure 6.9 Relationship of entry criteria to time lines. (The black and white figure is available on Chapter.)
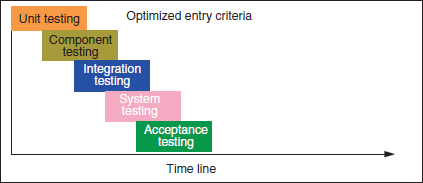
Figure 6.10 Entry criteria to balance parallelism with quality. (The black and white figure is available on Chapter.)
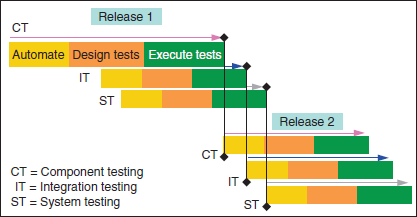
Figure 6.11 Exploiting parallelism across test phases to work on multiple releases simultaneously. (The black and white figure is available on Chapter.)
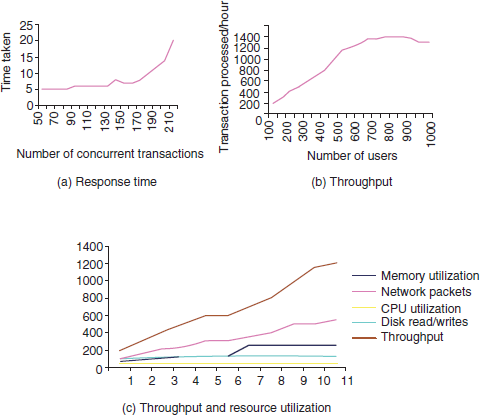
Figure 7.3 (a) Response time; (b) throughput; (c) throughput and resource utilization. (The black and white figure is available on Chapter.)

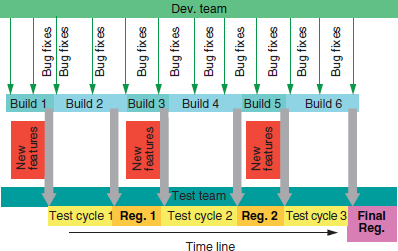
Figure 8.4 Classification of test cases—An example. (The black and white figure is available on Chapter.)
Figure 8.5 Methodology for selection of test cases. (The black and white figure is available on Chapter.)
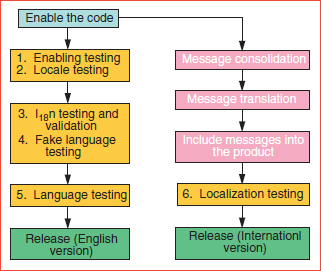
Figure 9.1 Major activities in internationalization testing. (The black and white figure is available on Chapter.)
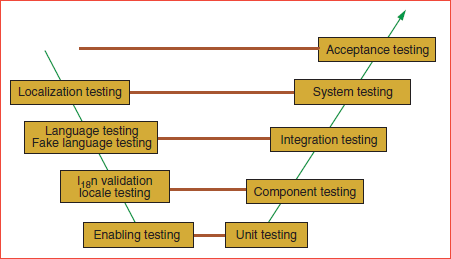
Figure 9.2 Phases of SDLC V model related to internationalization activities. (The black and white figure is available on Chapter.)

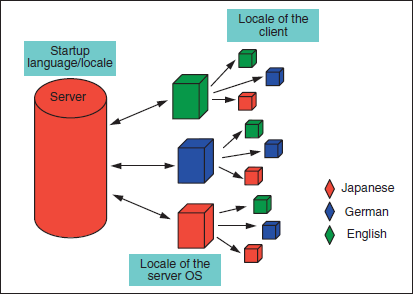
Figure 9.6 Language testing and locale combinations that have to be tested in a client-server architecture. (The black and white figure is available on Chapter.)
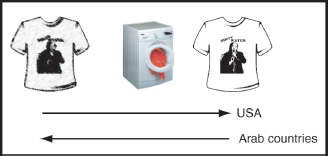
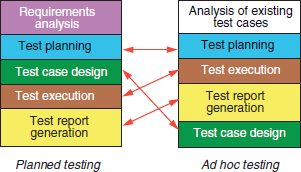
Figure 10.1 Ad hoc testing versus planned testing. (The black and white figure is available on Chapter.)

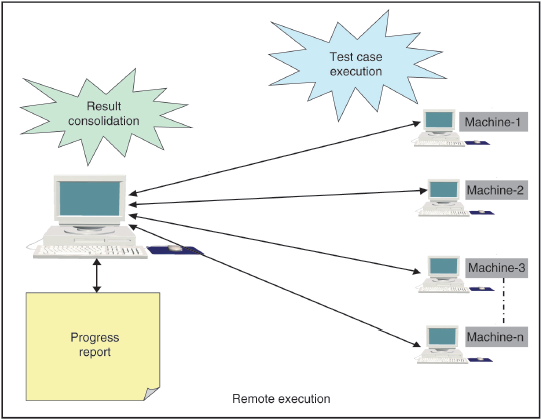
Figure 16.3 Role of test console and multiple execution module. (The black and white figure is available on Chapter.)

Figure 16.4 Similiarities between product development and automation. (The black and white figure is available on Chapter.)
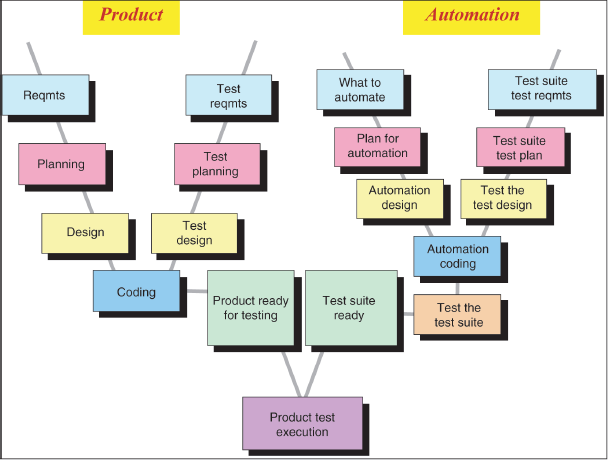
Figure 16.5 W model: Phases involved in automation. (The black and white figure is available on Chapter.)

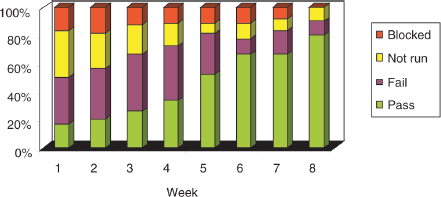

Figure 17.7 Typical pattern for finding defects in a product. (The black and white figure is available on Chapter.)
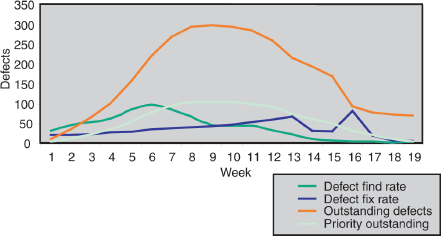
Table 5.1 Order of testing interfaces for the example in Figure 5.2. (The black and white format is available on Chapter.)
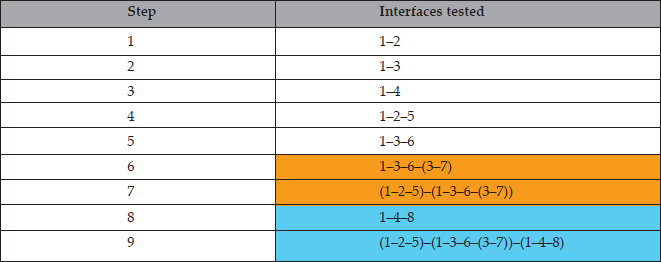
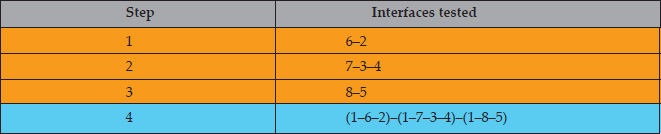
Table 5.2 Order of interfaces tested using bottom up integration for Figure 5.3. (The black and white format is available on Chapter.)
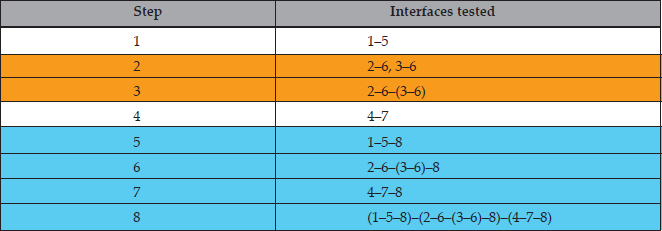
Table 5.3 Steps for integration using sandwich testing. (The black and white format is available on Chapter.)