
Classic web analytics data is an incredible asset to SEO. Here are three examples of ways to utilize this data for SEO purposes:
Look at your daily referral reports to detect newly received inbound links (the great majority of webmasters click on a link after implementing it, to make sure it works)
Look at the search terms people use to come to your site to spot long tail search opportunities
Measure the results of your campaigns by tracking the increase in conversions you are driving over time
Web analytics are a must-have for any web publisher.
Your hosting company most likely provides a free web analytics solution, such as AWStats, Webalizer, or something similar. Although these tools provide valuable data, they are very limited in scope, and other tools out there provide significantly more data. Here are six of the best-known ones:
Web analytics platforms track your site’s traffic in two major ways. The older of the two methodologies is to use software that analyzes your web server logfiles after traffic has occurred. Setting up this type of solution generally involves installing the software on an internal server that is able to gain access to the logfiles.
The newer methodology involves implementing JavaScript tags on all of the pages of your website. Provided that you have a basic template for your pages, this generally is a fairly straightforward process. JavaScript then tracks the activity on your web pages as it happens and builds a data profile reflecting that activity.
Logfile tracking and JavaScript tracking are equally valid methods, and each has its own strengths and weaknesses. The biggest advantage of the logfile method is that you can track search engine crawler activity on your site. This is something you cannot do in JavaScript implementations, because search engine crawlers do not execute the JavaScript.
The second big advantage of a logfile-based solution is that you run the software in-house, so no third party has a copy of a logfile with your proprietary traffic data on it. This distinction can be a big security issue for some organizations.
Ultimately, most companies opt for JavaScript tracking because JavaScript offers a much greater level of flexibility than logfiles. You can tweak the JavaScript to do custom conversion tracking, or gather pages into logical groupings in a manner that cannot be done in logfile-based applications.
Some companies, such as Unica and Webtrends, will offer you both options, or they will even offer the option to implement a combined solution. This kind of approach can bring you the flexibility and power of JavaScript, but still get you your search engine robot crawling data as well.
Making this decision is only the first step in picking an analytics package. We listed six of the more popular vendors earlier, and there are many more vendors than that. Each of these packages has different strengths and weaknesses. Not only that, they all do their counting a little bit differently. The chart from Stone Temple Consulting’s Web Analytics Shootout report, shown in Figure 9-1, helps to illustrate the point.

The chart in Figure 9-1 shows the results of seven different analytics packages (listed on the right). The traffic data for each vendor is reported across five different sites (represented by the acronyms on the bottom).
On the AMD site, the lowest reporting package (HBX Analytics) shows a little less than 750,000 unique visitors, and the highest reporting package (Clicktracks) shows about 1,050,000 unique visitors during the same period—almost 50% more!
These differences result from different decisions in how the analytics packages conduct visitor tracking. None of them are right or wrong, they are just different in the exact thing they are measuring.
Note
HBX Analytics, which is listed in Figure 9-1, is no longer available, as WebSideStory was acquired by Omniture. In addition, IndexTools was acquired by Yahoo! and is now called Yahoo! Web Analytics.
The more important component of this is whether the functionality of the web analytics software fits your needs. Making this more difficult to understand is the fact that you often do not know what your requirements are until you have used analytics for a while. As you engage with analytics, you will continually learn more things you want to investigate, and develop new requirements.
For many companies, one of the best solutions is to start with a free analytics package such as Google Analytics or Yahoo! Web Analytics and then look to buy a higher-end solution once they have pushed these packages to their limits. By pushing the limits of these free analytics products first, you will end up developing a set of requirements you can use in deciding where to go next.
None of this is meant to say that you should not brainstorm your requirements in detail before selecting an analytics package. You should (and must). Just expect that you will develop new requirements along the way. Web analytics is a journey that unfolds over time.
Based on the requirements you establish in your upfront brainstorming, you may find that you require a set of features that the free packages do not provide. Use that as knowledge to select the right package to start with.
You can extract all kinds of data from web analytics. Here are a few of the more interesting types of information you may want to extract.
One of the first things you may want to know is the breakout of traffic by search engine. Figure 9-2 provides an example of such a report in Google Analytics.

Notice how small the traffic is on Yahoo! compared to Google (about 2.5%). This may be indicative of a problem with the site in question and Yahoo!. This site owner might want to spend some time exploring why the site traffic from Yahoo! is so low.
One of the basic data points of interest for an SEO practitioner is what search terms are bringing traffic to the website. This provides a quick way to see where the SEO campaign is going well and where it is not going so well. You can also use this to spot opportunities where a key search term is providing some traffic, but not as much as you would expect if you were ranking highly for that term.
You can then look to see where you are ranking for that term. Perhaps you are in a lower position on the first page, or on the second page of the SERPs. If so, it might make sense to focus some attention on this term. With a little effort, such as a focused link-building campaign for the page in question, you may be able to move up several positions and obtain a traffic boost.
A traffic-by-keyword report can also show you the long tail of search as it relates to your current site. Figure 9-3 depicts a snippet from the organic search phrases report of Yahoo! Web Analytics showing some of the small-volume terms for Stone Temple Consulting’s website.
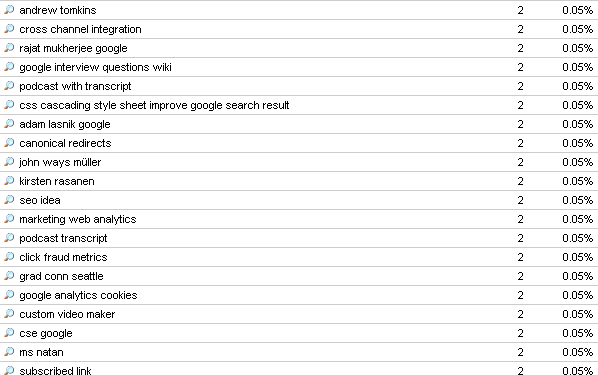
Notice that a lot of names are showing up in the list, in addition to the rather interesting who is the author of ask.com. Looking into this query data can give you a broad perspective on opportunities for long tail search.
Notice also how two of the names combine Google with a person’s name (jack ancone google and google carter). This could indicate an opportunity to make sure the person’s organization name is a part of the title of the articles in the Stone Temple Consulting interview series.
Next, you can consider putting these things together. Even the free tools provide substantial capability for building out custom reports. Figure 9-4 depicts a screen shot from Yahoo! Web Analytics that shows the search phrases just for Google, and the pages of the site that Google sent users to when users clicked on your link.
This is a key improvement to your SEO research for two reasons:
If you are looking into what terms can bring fast traffic benefits as a result of some additional optimization, you are going to want to know in which search engine you are ranking.
If you are going to optimize a page to rank higher, you will need to make sure you are optimizing the right page!
It is interesting to look at a referring site report for a number of reasons, but one of the more interesting SEO reasons to do so is to spot when you receive new links. You can often see those new links in these reports first, even before the search engines report them. Figure 9-5 shows a sample portion of the referring sites report from Google Analytics.

Expanding on this example, consider the site circled in Figure 9-5, edwardbeckett.com. If this is the first time you have ever noticed this site in your referrers, it can be a leading indicator that you have received a new link. This is of interest as it can help you to detect new links that result from your link-building campaigns, and therefore help you measure which of your link-building campaigns are yielding the best results.
In analytics terms, a dashboard is a single-page view that contains your most critical metrics all in one place. Of course, your most critical metrics are different from those of the next publisher, because the needs of different sites vary greatly.
In addition, multiple dashboards may be required in any given organization. For example, the CEO of a large public company probably wants to see different data (and a lot less of it) than a senior business analyst.
Each analytics package provides methods for implementing a custom dashboard. Figure 9-6 is an example of one from Unica’s Affinium NetInsight.

As you can see from Figure 9-6, a dashboard can be quite visual. What is most important, though, is that it provides the data that is most important to the person for whom the dashboard was designed. As an SEO practitioner, you can implement a dashboard to show progress against the goals you set for your SEO campaign.
Providing this type of visibility has two important benefits:
The person viewing the report will appreciate the fact that she does not have to work hard to do a quick health check on the progress of the SEO efforts. As we suggested at the beginning of this chapter, the fact that you agree to measurable goals will be a great comfort to management.
You will know what data your managers are looking at. When something goes wrong (or right), or when management wants to discuss some aspect of the business, they will have started from the dashboard you set up for them.
Action tracking is one step deeper than basic analytics. Rather than simply observing what pages are visited and how many unique sessions are logged, action tracking allows you to narrow down groups of visitors based on the actions they take on your site.
In most instances, it requires setting up a code in your analytics program and attaching that code to a button, page load, image rollover, or other JavaScript-trackable task (a click or hover). Once you’ve plugged it into your analytics and the website, you can use the action to refine data you’re already collecting. Figure 9-7 provides a look at how this works.
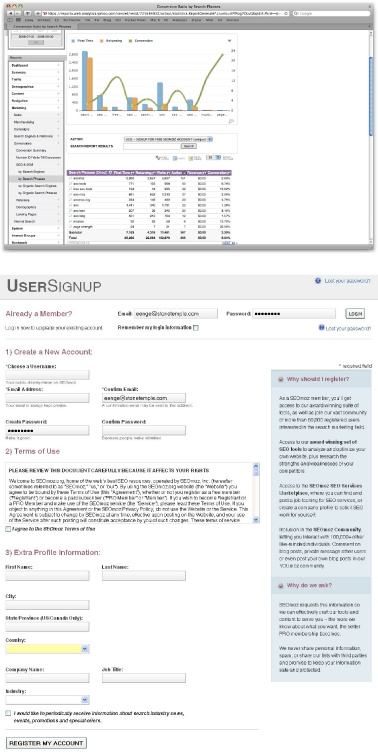
You can see from Figure 9-7 that:
Based on the people who sign up, you can predict which search terms will be better at converting visitors into applicants.
The Revenue column is empty, but if you were tracking e-commerce buyers, you could put their totals into the Revenue column and track high-volume buyers.
Expanding on this idea, you could also track users by time of day, the search engine they used, their geographic location, and so on.
So, what types of actions should you be tracking on your site? The answer varies depending on your business and site structure. Here are some suggestions as segmented by site type.
- Add to Cart button
Studies have shown us that users who “add to cart,” even if they do not complete the checkout process, are more likely to return to make a purchase. This is also a good way to calculate shopping cart abandonment and make changes to refine and improve the process.
- Complete checkout
An obvious one; this action will show you what percentage of each user group is converting into sales.
- Save to wish list
E-commerce sites offering wish lists are still in the minority, but wish lists are a great way to track interest that isn’t quite a purchase.
- Send this to a friend
Many sites offer a “share this page” function, and it is a great action to be aware of. If folks are sending out your link, you know you have a hit.
- Subscribe to newsletter
A subscription is a tacit endorsement of your brand and a desire to stay in contact. It may not be a conversion, but for B2B, it may be the next best thing.
- Contact form submission
A runner-up with subscribing to a newsletter is filling out the contact form. Though some of these forms will report support issues, many may contain questions about your products/services and will indicate a desire to open a sales conversation.
- Email link
As with contact forms, direct email links have the possibility of becoming a sales contact. The best thing you can do is clearly label sales emails and track them separately from support or business issues.
- Subscribe to RSS feed
An RSS feed subscriber is a blog’s equivalent of a conversion; tracking these is imperative.
- Add comment
Anyone who is contributing content to the blog or participating should be paid attention to (as should those channels that send you participatory people).
- Social bookmark/share
All those folks who are submitting your content to Digg and Reddit deserve to be recognized (and sought after).
Forum or other site based on user-generated content (UGC):
- Sign up for an account
These users are active contributors; you need to know where they come from.
- Contribute content
When a user publishes, discovering her path is important (especially if it is not from a bookmark/type-in).
- Add comment
As in the preceding list item, comments are a great predictor of engagement.
- Vote/rate
Even low levels of participation, such as a rating or a vote, are worth tracking when every piece of participation counts.
You can get very creative with many of these and track all sorts of actions. If you offer a tool or calculator, track its usage. If you want to follow who clicks a particular link (rather than just a page), add an action to it. You can even see which users hover on an image.
For many marketers, action tracking is the secret sauce. Once you install and activate this data, it is easy to adjust SEO (or PPC) marketing efforts on particular terms, phrases, or pages that will make a huge difference to the campaign’s efficacy.
For SEO professionals, action tracking is a “cannot-live-without-it” tool. The recommendations made based on this kind of tracking are backed up by real data. High-volume action-tracking studies almost always make a huge impact on a site’s bottom line.
One of the big problems with web analytics is that there is so much data. There is seemingly an endless supply of the stuff—so much that you can get lost in the weeds and waste a lot of time. As Yahoo! Web Analytics’ Dennis Mortensen (http://visualrevenue.com/blog/) likes to say, do not “report-surf.”
By this he means you shouldn’t get lost in the data, looking at one interesting fact after another, without understanding what business objective you are attempting to accomplish. To avoid this trap, you need to have a plan.
The basis of this plan is the definition of actionable Key Performance Indicators (KPIs). To summarize this concept very briefly, do not view a report unless there is a chance that it will provide enough insight to take action (such as reallocating resources to fix a problem or pursue a new opportunity you discovered).
Because of the complexity of web analytics, there are plenty of opportunities to make mistakes. Even if you are laser-focused on actionable KPIs, you can still draw wrong conclusions from the data. Here are a couple of examples:
- Making a decision on too small a sample size
A simplistic example would be if you had a keyword that brought you two visitors, and both of them bought something. What does that mean? Your conversion rate will always be 100%? Of course not.
You need to have a test run for a length of time that is statistically significant. According to Jonathan Mendez, long-time evangelist for Offermatica (which is now part of Omniture’s Test & Target product), the “golden rule” for test length is 100 conversions per branch (or tested element). For an A/B test, ideally you would have 200 conversions before you looked at the results. However, if after 50 conversions you have 40 on one branch and 10 on the other, your test is over. If your variance in results is lower, you need more data to make sure the data you are seeing is accurate.
- Not recognizing when you have enough data
You can make this mistake in the opposite direction too. When you have enough data, you need to be willing to act on it.
- Working with biased data
You can easily collect biased data and make the wrong decision. For example, an e-commerce site basing its SEO plans on December’s traffic numbers is probably being misled. And temporal factors aren’t the only cause—visitor locations, referral sources, and in-house campaigns to existing lists can all skew information.