ALTERNATIVE INVESTMENTS
‘Investors require unusual self-confidence to ignore the widely hyped non-core investments and to embrace the quietly effective core investments.’
David Swensen, CIO, Yale Endowment1
There are a number of asset classes other than cash, bonds and equities that you might consider as part of your wealth plan. In this chapter I’ll explain the main types and whether or not I recommend their inclusion in your portfolio.
Gold
Not recommended, in a multi-asset portfolio held for the long term because its expected return does not cover its risk as a portfolio asset, but hold a small amount if it helps you to stay disciplined.
Gold has been a store of value for thousands of years and has as much emotional appeal as it does potential for investment. Some investors view gold as the ultimate protection against rampant inflation and corrupt or profligate governments, with its appeal and thus value rising as confidence in governments’ economic policies declines. Gold is also seen as a means of hedging currency risk and as an attractive alternative to low real return asset classes.
In many Middle Eastern and Asian countries, particularly those with less developed banking infrastructures and less stable political institutions, gold is still a trusted form of exchange for goods and services. In addition, there are strong cultural traditions that perpetuate the allure of gold. For example, at Indian weddings it is usual for the bride and groom to be given gold as a wedding present.
The capital return from gold can come only from a rise in the price due to increasing demand. A large part of the demand for gold arises from its use in jewellery and other goods, known as the ‘consumption dividend’.2 This pushes up the price of gold and as such lowers its expected capital return. If you invest in gold bullion or a gold fund as part of your investment portfolio, all you will receive is the expected capital return as you are not receiving the consumption dividend.
Figure 8.1 shows the return from gold after adjusting for inflation over the past 40 years compared with the S&P 500 and FTSE 100. As is clear, gold has lagged well behind most equity indices, although it has performed in line with many fixed income benchmarks. Taking the data from 1990 to 2008 and dividing it into three types of environment – high inflation, high uncertainty and normal – gold delivered negative real returns in normal conditions, and positive real returns in high inflation and uncertainty.3 Recent research appears to suggest that gold is a hedge (i.e. it is uncorrelated with stocks and bonds on average) and acts as a safe haven asset class, providing support in extreme stock market conditions, reducing investors’ losses just when they need that protection most.4 However, when buyers acquire gold on the day after a shock (i.e. after the price has already risen), they lose money, which suggests that any gold allocation should be at the strategic asset allocation level, not in response to news.
In another recently updated research paper,5 the authors find little evidence that gold has been an effective hedge against unexpected inflation. They also question the assertion that gold really provides a true ‘safe haven’ in an environment of very low real yields. In terms of an inflation hedge, equities and index-linked gilts provide alternative asset classes to achieve this objective. Gold does, however, appear to act as a hedge against a weakening US dollar, which is attractive from a sterling-based investor’s perspective. Although gold has diversification characteristics, because it has very low correlation with equities and bonds, its expected return should be low because of its role in reducing risk in the portfolio overall.
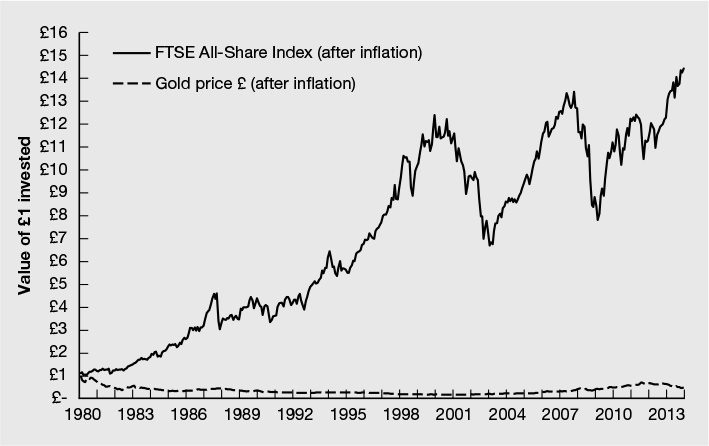
Figure 8.1 Historic after-inflation return from gold compared with FTSE All-Share Index
Source: Dimensional Fund Advisors, with data from the FTSE Group. Calculated using Returns 2.3.
‘I am recommending gold as I have done for many years. I will continue to do so until the gold price hits the blow-off stage, which is nowhere in sight. … The environment for gold couldn’t be better … Gold could go to $5,000 or even $10,000.’
Fred Hickey, High Tech Strategist6
Many gold enthusiasts believe that gold is ‘under-owned’ by investors and we are on the cusp of a major increase in the amount of investment capital allocated to gold. Even a small increase in demand for gold, we are told, will cause the price to soar. While acknowledging that such a strategic shift would lead to a significant increase in the price of gold, the same academics who questioned the inflation-hedging characteristics of gold had this to say about the price of gold: ‘Given the most recent value for the CPI [Consumer Price] index, this version of the “gold as an inflation hedge” argument suggests that the price of gold should currently be around $780 an ounce.’7 At the time of writing (May 2014) the spot price of gold was US$1,300, compared with a low of US$252 (June 1999) and a high of $1,913 (August 2011) over the past 30 years.
Warren Buffett8 put the case succinctly against gold, positioned against equities:
‘This type of investment requires an expanding pool of buyers, who, in turn, are enticed because they believe the buying pool will expand still further. Owners are not inspired by what the asset itself can produce – it will remain lifeless forever – but rather by the belief that others will desire it even more avidly in the future.
‘The major asset in this category is gold, currently a huge favorite of investors who fear almost all other assets, especially paper money (of whose value, as noted, they are right to be fearful). Gold, however, has two significant shortcomings, being neither of much use nor procreative. True, gold has some industrial and decorative utility, but the demand for these purposes is both limited and incapable of soaking up new production. Meanwhile, if you own one ounce of gold for an eternity, you will still own one ounce at its end.
‘What motivates most gold purchasers is their belief that the ranks of the fearful will grow. During the past decade that belief has proved correct. Beyond that, the rising price has on its own generated additional buying enthusiasm, attracting purchasers who see the rise as validating an investment thesis. As “bandwagon” investors join any party, they create their own truth – for a while.’
Owning gold as an investment seems to be driven as much by emotions and market-timing decisions in the face of news as it does for any rational, empirical reasons. If allocating a small strategic amount of, say, 5% of your portfolio to gold helps you to feel better about the future and to stay disciplined with the remaining 95% of your portfolio, then that might be the right approach to adopt. Otherwise I’d suggest you restrict your portfolio to comprising an appropriate amount of equities, short-dated and inflation-linked bonds and benefit from the dividends and interest arising. You can then restrict your investment in gold to objects of beauty.
Hedge funds/funds of hedge funds (FoHFs)
Not recommended due to their complexity, high costs and unsubstantiated risk/reward characteristics.
There is no definitive description of what a hedge fund is. They have been described as a variety of skill-based investment strategies with a broad range of risk and return objectives that takes a performance fee. As such hedge funds are not an asset class but a class of active investment management. On the face of it, hedge funds appear to provide attractive characteristics to investors, including low correlation to equities and bonds, high returns and low risk. Investment can be by either individual funds or funds that invest in a number of other hedge funds (known as funds of hedge funds). The hedge fund industry claims that, in aggregate, their funds generate returns over and above those of the market due to the skill of investment managers. However, because we know that there are no high-return low-risk investments, such claims should be treated with a significant degree of scepticism.
The most commonly available risk and return databases for hedge funds contain a number of biases that overstate returns and understate correlations (against other asset classes) and volatility. In addition, the data conceal the fact that there is usually an increased probability of very large losses.
Research suggests that returns from hedge funds may in fact be systematic exposure to alternative sources of market-based returns (beta) rather than manager skill.9 During the period November 2007 to March 2009, when the UK equity market fell almost 40%, diversified FoHFs failed to live up to their diversification and skill-based returns sales pitch, losing more than 20% in dollar terms.10 This suggests that such products are simply the result of taking directional market bets, for very high fees. Over the long term these high fees will have a detrimental impact on investor returns, even if a manager gets those directional bets right (and there is no evidence that those who do so can repeat their success in a way that can reliably be attributed to skill rather than luck).
Assessing hedge funds is an expensive, time-consuming and complex task, which involves trying to understand the underlying strategies, selecting truly skilful managers and performing the necessary due diligence. (Bernie Madoff fooled a number of wealthy professional investors and large private banks with his US-based fraud, so assessment is not as easy as it might appear.) The costs of a typical hedge fund are very high, with typically a 2% annual management charge and 20% of any gains, plus 1% and 10%, respectively, on top of that for a fund of funds. The costs incurred by the manager in buying and selling holdings are likely to add significant additional costs, which will be at least as much as traditionally managed funds, but most likely much higher, given the typically higher portfolio turnover within hedge funds.
Research released in a book11 by an asset manager who formerly chose hedge funds for major US bank JP Morgan reveals some interesting and thought-provoking insights about hedge funds:
- Between 1998 and 2003 hedge fund returns were positive in aggregate in each year. The industry at that time was small, with around $200 billion in assets.
- Due to its strong performance during the 2000–2003 period (the technology sector crash), the industry attracted assets rapidly.
- By 2008 it is estimated that hedge fund assets amounted to $2 trillion, a ten-fold increase.
- The average performance loss in 2008 was 23%.
- The author estimates that these money flows and the consequent asset-weighted returns, i.e. the returns received by investors based on the timing of their investments, cancelled out all of the profit made in the previous ten-year period. To the end of 2010 investors were still below water, yet hedge fund managers extracted more than $100 billion in fees between 2008 and 2010.
- The 18% return on hedge funds in the nine years to November 2011 was easily beaten by the total 29% gain from the US S&P 500 Index (in US$ terms). The gap was even starker for investment-grade corporate bonds, which in the same period gained 77%, as measured by the Dow Jones Corporate Bond Index. The underperformance of hedge funds over this period was before accounting for the typical 2% p.a. management fee and 20% performance fees.
- If individual hedge fund managers are generating additional returns above those of the market, then the benefits of that skill (if it is skill and not luck) tend to go to the managers themselves rather than to investors. Hedge fund managers extracted $379 billion for themselves between 1998 and 2008 out of the $449 billion returns generated in excess of cash, meaning that investors took all the risk but the hedge fund managers took virtually all the excess returns. On a risk-adjusted basis, investors would have been better off simply placing their funds in a cash deposit account.
While the hedge fund industry would no doubt contest the findings of Lack’s book, one doesn’t have to agree with his numbers still to harbour reasonable doubts about risking one’s hard-earned savings by investing in hedge funds.
Hedge fund returns data tend to be packed with all sorts of biases (self-selection – many funds (often the poorer performers) never even make it to the databases; survivor bias – some fail and fall out; and back-fill bias – where managers back-fill prior performance, which is likely to happen only when it has been good). One piece of research12 reveals that over the 15 years of the study to 2009, hedge fund net returns were around 14% p.a., which sounds good but when stripped of these biases they were more like 8%, not much different from the US equity market. In the dataset being used (TASS database), the authors found that 63% of funds were now dead and only 37% had survived. Interestingly, around two-thirds of returns came from simple market factors (owning bonds and equities) and one-third from manager skill. Costs were very high at an average of around 3.5% p.a. – which is a lot given that 60% of the return is simply delivered by the market.
The authors note an important point – that although market-beating returns appear to exist, there is no easy way for investors to secure this average and even if the funds could, the investors only ended up with a market return as the hedge fund managers took all the outperformance for themselves.
Another piece of research13 from 2011 explains that, due to the lack of disclosure around returns, it is difficult to determine how much market-beating returns, if any, hedge funds generate. This is in addition to other drawbacks of hedge funds, such as illiquidity, relative lack of oversight, the additional costs of leverage and derivatives and, of course, the substantial fees charged by the managers themselves. The research concludes that the highly uncertain payoff from hedge funds, the high expense ratios and the lack of disclosure around them mean that investors should exercise caution before investing in them.
Investing is a zero-sum game before costs (for every winner there must be a loser) and over the medium to long term hedge funds have a very high hill to climb in achieving sufficient investment returns just to cover their increased costs. In order to do this, they need to take more risk (with your money). Synthetic hedge funds, which replicate underlying market risk factors at far lower cost and with greater liquidity, could be a possible option for investors in the future, but it is still too early to establish their efficacy in delivering the desired characteristics and there is still a lack of available funds of this type.
In concluding I’ll leave you with some wise words from one of the investment world’s most acclaimed users of hedge fund strategies:
‘Casual approaches to hedge fund selection lead to almost certain disappointment. Hedge funds belong in the domain of sophisticated investors who commit significant resources to manager selection …Investors who fail to identify truly superior active managers face a dismal reality.’
David Swensen, CIO, Yale Endowment14
Structured products
Not recommended for long-term investors due to high costs, additional provider risks and loss of return upside but may be suitable for very short-term investors who accept the downsides.
Structured products, created by investment banks and enthusiastically promoted by their private banking divisions, started gaining popularity with European retail investors in the 1990s and with US retail investors in the mid-2000s. Recent estimates put the amount of UK investors’ money currently invested in structured products at £42 billion.15 In simple terms, a structured investment pays a return based on the performance of an underlying asset, such as an index, commodity or equity, according to a pre-set formula, usually over a set time period of up to six years. In some issues it is possible to encash the investment early, but this may be subject to certain penalties and even then will depend on the market price of the underlying asset.
On the face of it these products can be useful to investors who desire a specific payoff structure linked to the performance of the underlying asset(s) at apparently lower risk than owning the assets directly. Certainly the promise of capital protection with market upside participation looks appealing to the average investor. However, behind the sales message is usually a complex payout mechanism that even the most mathematically minded would struggle to understand and risks that may be neither immediately obvious nor quantifiable.
‘They are horrible investments for retail investors … Simple portfolios of bonds, stocks or the S&P 500 [Index] will beat structured products 99.5% of the time because of the heavy profit built into the pricing.’
Craig McCann, former SEC economist
The combination of a simple investment proposition supported by extremely complex financial engineering means that most retail investors buy structured products on the advice of ‘experts’ such as private banking and other financial advisers. As I’ve stated previously, there are no high-return, low-risk investments. Therefore, as an investor you know intuitively that a fixed income product that pays a high yield and offers additional upside potential must carry some form of downside risk. A financial institution will not offer more benefit without getting something in return.
In fact, a few years ago the UK’s financial regulator reviewed the practices of several institutions that account for 50% or so of all structured products sold in the UK. The regulator’s Head of Conduct Supervision commented: ‘Many of the problems we found with the product design process were rooted in the fact that the firms are focusing too much on their own commercial interests rather than the outcomes they are delivering to consumers.’16
It is worth noting, too, that the popularity of these types of products with banks, building societies and insurance companies is driven not only by the direct pricing benefits to the issuer of the product but also because they represent a cheap source of funding for the institution.
The usual price of capital protection is giving up part of the return from the underlying index, security or commodity on which the structured product is based. Dividends are the regular cash payment made to shareholders, as part of the compensation for taking on the risk of equity ownership, the other component being a rise in the price of the shares of the company. An important insight into equity investing is that share price rises alone have historically delivered a return only just higher than inflation. It is the reinvestment of cash dividends into the portfolio that accounts for the bulk of the attractive returns that equities delivered, and are expected to deliver, over time. This is illustrated in Figure 8.2.
Typically, structured products sold by banks usually promise to deliver only the ‘price return’ of the index, such as the FTSE 100, rather than a ‘total return’ index where reinvested dividends are included. With dividend yields around 3% p.a., over the lifespan of a five-year product an investor would give up more than 15% due to compounding compared with the underlying asset from which dividends are included. Looking at this another way, this is a 15% cushion for an investor taking on the full risk of equities, by simply buying an equity index tracker fund. Rolling from one structured product to the next gives up this important long-term driver of returns. Promising to give you your capital back sounds like a reasonable deal if Plan A does not come off (for example, the FTSE 100 ends lower over five years than its start point). Where the product guarantees a return of principal, this is only in nominal terms (invest £100, get back £100) and a period of high inflation could seriously erode purchasing power.
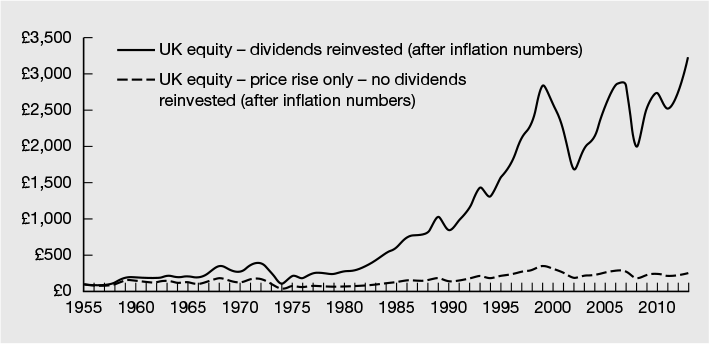
Figure 8.2 Reinvesting dividends is a major contributor to long-term equity returns
Source: Barclays Capital Equity Gilt Study 2014.
By placing your money onto the balance sheet of a bank or other financial institution, you are opening yourself up to the risk that it goes bust. That is not a trivial decision to make, particularly as some products sit outside UK investor-protection schemes. The owners of the $18 billion invested globally in structured products issued by Lehman Brothers lost most of their money despite such promises.17 In fact, the bank backed $900 million of structured products in 2009 alone, before filing for bankruptcy in September of that year.18 UK investors who bought structured products from Keydata have been told that the whereabouts of their money, which was invested by a further counterparty, SLS Capital, is unknown. It’s still unclear whether they will be able to make claims from the UK’s compensation scheme.
A common feature of these products is high, but rarely quantifiable, costs. It is in the issuer’s interests to make the product as complex as possible so that it is hard for investors and advisers to quantify the costs and the profits accruing to the issuing bank. Many investors wrongly equate complexity with high returns, to their detriment. While the return payout may appear to be passive in nature, being linked to an index or other asset class measure means that many structured products are simply gambles on the direction and magnitude of the movement of a market or a basket of markets.
‘Some of the more exotic structured products offered by firms … have often been mind-bogglingly complicated financial gambles – almost like spread bets on steroids.’
Martin Wheatley, Chief Executive of the Financial Conduct Authority19
Private equity
Not recommended due to high costs and poor return characteristics.
Private equity, i.e. leveraged buyouts and venture capital, appear to provide exciting opportunities for higher returns than the public market and additional diversification benefits. In reality, capturing these higher returns comes at the price of illiquidity, higher risk and higher costs. A study by former banker Peter Morris found that private equity managers often charge excessive fees (typically a 2% annual fee and 20% performance fee) and overstate potential returns. ‘Calculating returns on private equity is not a trivial issue’, Morris says. ‘The most widely used measure, the internal rate of return, is misleading and often overstates realised returns. This creates room for uncertainty, at best, and, at worst, manipulation.’20
Morris questioned the extent to which the returns that the managers do deliver relate to their skill and the extent to which they come from what the market would have provided anyway and from the leverage involved. For instance, his study analysed the returns on 110 deals in the UK and Europe over a decade from 1995 to 2005. The average internal rate of return in those deals was 39%, of which debt accounted for 22% and a rising stock market 9%. The other 8% was the contribution of the private equity managers. Given that the average annual fee in private equity was at least 8%, this meant the investors who provided the bulk of the money would have done just as well investing in the market directly and borrowing from the bank. See Figure 8.3.
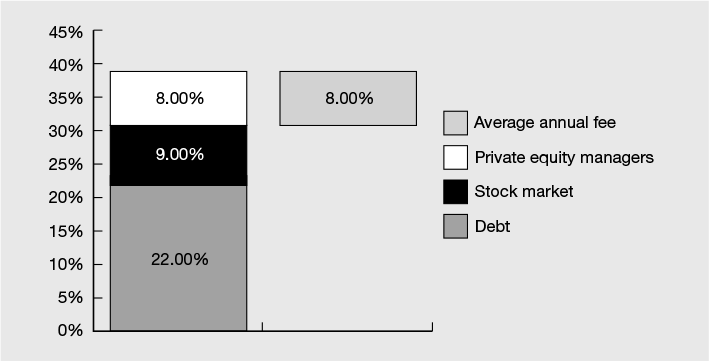
Figure 8.3 Return composition of private equity deals
Source: Data from Morris, P. (2010) ‘Private equity, public loss?’, Centre for the Study of Financial Innovation, July.
Another European study21 looked at cashflows from more than 4,000 liquidated private equity investments and found that the market-beating return (alpha), or return unexplained by risk factors to which investors could have obtained low cost exposure anyway, was zero. This study inferred an historical risk premium from private equity of around 18%, of which about 10% was the market premium, 5% was the value (or book-to-market) premium and the remaining 3% was the premium from liquidity risk – the risk of not being able to sell out of the asset sufficiently quickly to avoid a loss.
‘Private equity is simply public equity with additional layers of leverage; it is therefore likely to be a good deal more risky than quoted equity markets, while several orders of magnitude more expensive in management fee structures … From an accounting perspective, private equity might appear to be a lower risk investment than quoted equities, while delivering historical returns that display low correlations with equities. In the real world, nothing could be further from the truth.’
Barclays Capital, ‘Equity Gilt Study 2007’
Leading finance academics Fama and French expressed their view that, to the extent that private equity managers add value through the application of their skills, the evidence indicates this additional return tends to go to the managers themselves.22 Fama and French also dispute that private equity is a diversification tool, because the types of targets chosen by private equity – small companies and start-ups – tend to be highly sensitive to the market.
There is a wide range of possible outcomes for the returns from private equity when compared with those from the quoted stock market. However, these returns are driven by chance, which makes it hard for investors to discern whether the returns they are paying for are due to skill or luck, so, while private equity can generate good returns, once these returns are adjusted for market risk, value and size risk and liquidity risk, there is little sign of the managers adding any further value through their own skill. In any case, the size of the fees involved suggests that what additional spoils are on offer tend to go to the managers, not the investors.
Life settlement funds
Not recommended due to poor upside, lack of transparency and significant counterparty risk.
Life settlement funds purchase life insurance plans from individuals with impaired life expectations at a discount and then receive the proceeds on the death of the original policyholder. Given that returns are uncorrelated to financial markets and some existing funds have delivered returns in the region of 8% per annum with low volatility, they are, at least superficially, attractive.
There are four main points to consider when weighing up whether or not to use life settlement funds. First, returns are based on someone else’s misfortune, which may not be acceptable to some people. Second, the risk exists of a misselling scandal, not only of life policies but the fact that there may well be alternatives to the original policyholder selling a policy, which may not have been properly explained to the policyholder and would be financially more attractive to them. Third, you need to remember that high returns may be arbitraged away as more players enter the life settlements marketplace. Finally, you need to understand the various risks associated with this type of investment.
You are relying on the skill of the manager to make the correct assumptions about the life expectancy of the policyholders from whom policies are purchased. If they underestimate how long policyholders will live, the overall return from the fund will be much less than anticipated as they will need to find cash to pay ongoing premiums and this may require the forced sale of other policies at a discounted price. In addition, like structured products, life settlement funds have a rather opaque product structure that combines relatively high costs with multiple counterparties, including the manager, life policy adviser, policy administrator and custodian.
While there have been several high-profile disasters involving life settlement funds, the most high-profile one to date remains the $1 billion Ponzi23 scheme involving the Mutual Benefits Corporation in the US. The UK’s main financial regulator has also made it clear that it sees a very limited audience for life settlements and, in recent guidance,24 it outlined six key risks presented by these funds:
- Longevity – inaccurate estimation of life expectancy of the lives insured by the policies could negatively impact on the investment return and liquidity of the investment scheme.
- Liquidity – traded life settlement policies are illiquid and have a limited secondary market, which means that value could be significantly discounted if funds are required by the manager at short notice.
- Structure – yields are promised to previous investors which can be sustained only by using new investors’ money, which appears to share some of the characteristics of a Ponzi scheme.
- Location of the underlying asset – investors face exchange rate risk on the ongoing policy premiums and the final payout on maturity if denominated in a currency (e.g. US$) different to that of the investor.
- Offshore distributors – investors will have limited or no recourse to the Financial Ombudsman Service or Financial Services Compensation Scheme.
- Counterparties – the failure of the insurance company underwriting the policy would mean that claims would not be paid on the death of the original policy holder.
Zeros
Not recommended due to equity-type risks.
Investment trusts companies are quoted companies that exist solely to invest in other companies and they have been in existence for well over 150 years. Zero dividend preference shares, known as ‘zeros’, are a class of investment trust share issued by split capital investment trusts that provide a predetermined return on the maturity of the zero, similar to a zero coupon bond (a fixed income investment that pays all its return at maturity rather than regular interest payments throughout its term). The zero is assured of being repaid as long as the company’s assets grow by a fixed amount, which is defined at its launch date.
In the early 1990s some investment companies invested in each other and also took on debt to boost returns further, thus increasing risk beyond that which would have applied in a fully diversified market portfolio. In the early 2000s, with equity markets in free fall, the impact of those market falls was amplified by the cross-holdings and debt, and banks started calling in their loans. Like the proverbial deck of cards, this led to a number of companies becoming insolvent and defaulting on payouts to their shareholders at maturity. In the mid-2000s the investment trust industry agreed a compensation package to provide limited compensation to those who lost out in this situation. Today there are relatively few zeros, most of which relate to specialist fund sectors, with redemption dates falling within the next three or four years.
Convertible bonds
Not recommended due to equity-type risks.
These are fixed income securities issued by companies that also offer the holder the option to convert to ordinary share capital of the issuing company at a predetermined price in the future. The concept is that the investor receives a known return through the interest paid and capital security, with the potential to share in the upside of the company. As a result convertible bonds act more like bonds when they are issued and gradually take on more and more equity risk characteristics as they near maturity. While investing in convertibles via a convertibles fund deals with the diversification issue, it doesn’t deal with the fact that mixing bond and equity risks in the same asset class means it’s hard to know in which bit of the portfolio it should be held (and it drifts from one to the other). Therefore, the equity-like nature of convertibles is incompatible with the principal role of fixed income in most portfolios – that of reducing the risk of risky assets.
Art and wine
Art and wine are certainly things that have a value and in some cases can appreciate significantly, if you buy correctly, store properly and sell at the right time. I have met many people who have amassed a small fortune from collecting wine and/or art over many years. However, despite the items apparently appreciating in value significantly, people often fail to take into account storage and insurance costs, nor how the return compares with a diversified multi-factor investment portfolio.
If you have an interest in this area and enjoy wine and/or art, by all means allocate some of your wealth to it. However, if your main priority is to use your accumulated wealth to sustain your lifestyle over several decades, and you don’t see yourself as a wine or art expert (and don’t want to spend the time necessary to become one), I suggest you limit the amount you spend to an amount that won’t impact on your overall financial security. Enjoying wine and/or art for the pleasure they bring is probably the most prudent approach.
Wise words with which to leave you
While there will be some people who can see merit in using the various alternative investments discussed in this chapter, I am not one of them. I advocate keeping investing as simple, transparent, liquid and low cost as possible, and on that basis, none of these alternatives passes the test. David Swensen, CIO of the Yale University Endowment, and one of the most respected institutional investors (including alternatives), seems to agree:
‘You should invest only in things that you understand. That should be the starting point and the finishing point. For most investors the practical application of this axiom is to invest in index funds (low-fee investments that aim to mirror the performance of a particular stock market index). The overwhelming number of investors, individual and institutional, should be completely in low-cost index funds because that’s easy to understand.’
David Swensen25
1 Swensen, 2005.
2 The term ‘consumption dividend’ means the utility value that comes from actually using gold in products or owning gold for pleasure or status. Owning gold bullion or a gold fund does not provide this consumption dividend to the investor.
3 Index Investor (2010) ‘What is the proper role of gold?’
4 Baur, D. and Lucey, B. (2009) ‘Is gold a hedge or a safe haven?’, available at www.ssrn.com
5 Erb, C.B. and Harvey, C.R. (2012) ‘The golden dilemma’, http://sssrn.com/abstract=2078535
6 Barron’s (2013) ‘Stirring things up’, 3 February.
7 Erb, C.B. and Harvey, C.R. (2012) ‘The golden dilemma’, http://sssrn.com/abstract=2078535
8 Berkshire Hathaway Inc. (2011) Annual Report, chairman’s letter, p. 18, available at www.berkshirehathaway.com
9 Géhin, W. and Vaissié, M. (2005) ‘The right place for alternative beta in hedge fund portfolios: An answer to the capacity effect fantasy’, EDHEC and Journal of Alternative Investments, 9(1): 9–18; Jensen, G. (2005) ‘Hedge funds selling beta as alpha’, Daily Observations, Bridgewater Associates.
10 HFRI Fund of Funds Diversified Index in US$.
11 Lack, S. (2012) The Hedge Fund Mirage: The illusion of big money and why it’s too good to be true, John Wiley & Sons.
12 Cheng, P., Ibbotson, R. and Zhu, K. (2011) ‘The ABCs of hedge funds: Alphas, betas and costs’ – summarised in Chen, P. (2013) ‘Are you getting your money’s worth? Sources of hedge fund returns’, www.dfaeurope.com
13 Shah, R.R. (2011) ‘Demystifying hedge funds: A review’, Dimensional Fund Advisors, December.
14 Swensen, 2005.
15 UK Structured Products Association (2012), www.ukstructuredproductsassociation.co.uk
16 Financial Services Authority (2011) Guidance consultation, ‘Retail product development and governance – structured products review’, November.
17 Securities Litigation & Consulting Group (2009) ‘Structured products in the aftermath of Lehman Brothers’.
18 Light, L. (2009) ‘Twice shy on structured products?’, Wall Street Journal, 28 May.
19 Speech at the London School of Economics, 10 April 2013.
20 Morris, P. (2010) ‘Private equity, public loss?’, Centre for the Study of Financial Innovation, July.
21 Franzoni, F., Nowak, E. and Phallippou, L. (2010) ‘Private equity performance and liquidity risk’, Swiss Finance Institute, 17 June.
22 Fama, E.F. and French, K.R. (2010) ‘Q&A: Public vs private equity’, Fama/French Forum, Dimensional Fund Advisors, 7 July.
23 Ponzi schemes are named after a 1920s’ fraudster who promised high returns to attract investors, using new investors’ money to repay outgoing investors. This continued until eventually the entire scheme collapsed when investors all wanted their money back. A case of robbing Peter to pay Paul.
24 Financial Services Authority (2012) ‘Finalised guidance, traded life policy investments (TLPIs),’ April.
25 Financial Times, 8 October 2009.