
The process of getting the debugger to communicate with the running application and provide data to the user is known as attaching the debugger to the process.
- Deploy and run your game on your iOS device. Make sure that the device is on the same WiFi network as the machine that will be doing the debugging and then select the iOS device that you want to attach to.
- Select the Debug button in the toolbar:

MonoDevelop will then launch the Unity editor and after some time start the execution of your application. Your application will begin running in the player and stop when the first breakpoint in your code is encountered:
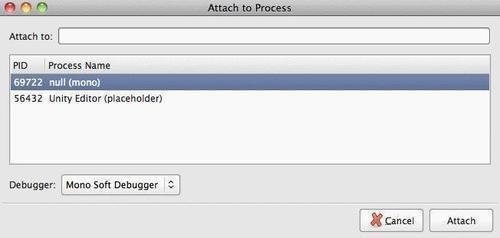
- Select the game that you want the Unity debugger to attach itself to. In this image we see the Unity Editor as one process we can attach to and another referred to as "null (mono)." This is your game running on your iOS device. Select this instance of your game.
We have just attached our debugger to an instance of our game that is running on our iOS device. This is very useful as we can get real debugging information from our actual device. When testing an application it is important to do this, as there will be times when an application will run fine within Unity on the PC, yet fail on an actual device.
..................Content has been hidden....................
You can't read the all page of ebook, please click here login for view all page.