
Now we're going to take our application and tune it so that it performs well, and has consistent behavior, regardless of where we are in the environment.
- Start the Profiler by selecting it from the Window menu (Window | Profiler):

The profiler will start and display the profiling interface for Unity. If you are familiar with the XCode tool Instruments you will find many of the same design and interface concepts in the Unity profiler:
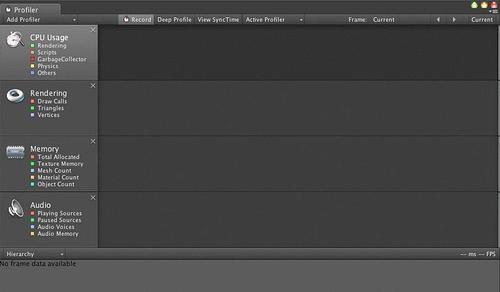
The Profiler will display metrics across a range of different settings: CPU Usage, Rendering, Memory, Audio, and Physics. You can remove profilers by clicking on the X in the upper-left corner of the Profiler.
- Remove the Audio profiler by clicking on the X in the upper-left corner of the Profiler:

- Add the Audio profiler back by clicking on the Add Profiler drop-down and selecting the Audio profiler:

The profilers that are already added will be greyed out. In this example both Audio and Physics can be added to the Profiler.
- Start the game by pressing the Play button. Immediately you will see the profiler fill with data from the profiling session:

We have used the build in Unity profiler to examine the performance of our application and explore the different metrics that it is returning so that we can gain some insight to the bottlenecks in our application. Now that we've done this we can identify some hot spots and look at a few ways to fix the issues that we uncover.