
Apart from testing the project in real-world conditions, it is important to check its performance and try to eliminate problems in this area. Fortunately, the Windows Phone Application Analysis tool is integrated with the IDE, and you can use it to measure the performance of various parts of your game. The tool can be started by selecting the Start Windows Phone Application Analysis option from the Debug menu.
After launching, you should have the Execution option selected, thus you can click on the Start Session (App will start) element. It automatically starts your game in the emulator, if it is selected as the target. Then, a process of collecting data is started, and you can use the application in various ways to check the performance of its several areas. For instance, you can start by spending some time on the Menu screen, then you launch the game and play ten levels, return to the menu, and open additional screens (such as Ranks, Map, or World). When you want to finish collecting performance data, you should click on the End Session (App will exit) option. Then, the process of collecting data stops and the report is created, which can take some time.
The Windows Phone Application Analysis tool presents a lot of important data related to the game performance, including both the managed and the native parts. The graph, presented in the main part of the window, shows the CPU usage at a particular time, as shown in the following screenshot. You can easily analyze which part of your application causes performance issues, and you may try to improve them.
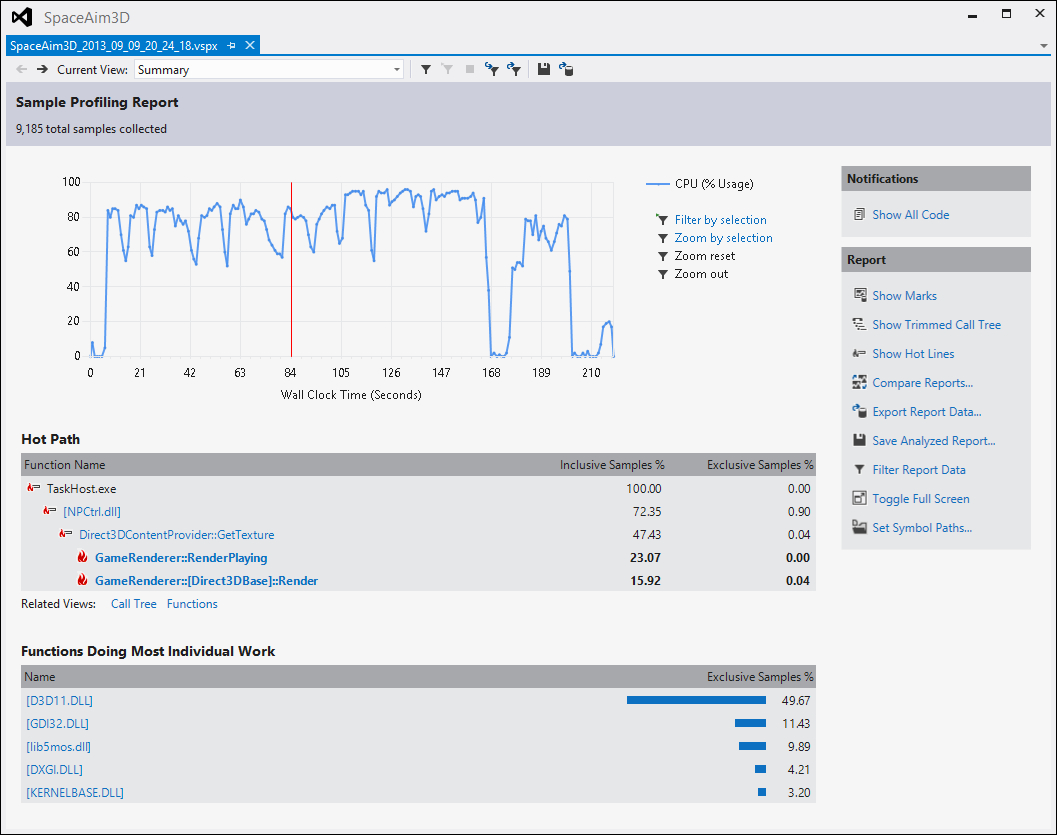
As you can see in the preceding screenshot, the performance results for the Space Aim 3D game are expectable and reasonable. In case of the Menu screen, the CPU usage is very low. It grows significantly for the Game page, but here you need to perform a lot of operations, for example, related to rendering many objects in the 3D game world. What is interesting, the CPU usage grows slightly while consecutive levels, but also on the tenth level, the game works smoothly both in the emulator and on the phone. As soon as you exit to the main menu, the CPU usage decreases almost immediately. The remaining part is related to opening the following game screens: Ranks, Map, World, and others.
The possibilities of the Windows Phone Application Analysis are not limited only to drawing the graph of the CPU usage. You can also see the Hot Path information, which lets you know what part of code uses the most processing power. In your case, it is the region that renders 3D objects on the screen, using Direct3D. What is more, you can click on a name of the particular function to open another view, which shows more details. By using the tool, you can even analyze the performance of particular lines of code, as shown in the following screenshot:

Available features make it significantly easier to find a bottleneck causing performance problems. By running the Windows Phone Application Analysis tool multiple times, while making modifications in the code, you can see how your changes reflect in the performance.