Breakpoints
At this point, you might be looking at this and thinking, “There is something wrong with this. My Spidey sense detects Code Smell.” Trust your Spidey sense. This solution is fraught with potential problems for your project.
Look at all those nasty NSLog statements all over our project. Ideally, we should never include an NSLog command in code that we send to Apple. Although they may help for debugging, NSLog statements are inefficient and slow our app for absolutely no reason. Additionally, any code we add to our project opens up the possibility of breaking something. What’s the point of using something that might break our code in order to figure out how to fix it?
Wouldn’t it be great if we could still print all our commands to the console without having to sift through all our code looking for those sneaky NSLog statements?
Breakpointing Bad
The answer to our conundrum are breakpoints. You have probably inadvertently already created a breakpoint when you clicked on an error icon to try to see what it said. Now we are going to create breakpoints on purpose.
Breakpoints are a feature in the Xcode development environment that lets us freeze our app at a specific point and figure out what our code is doing. They are like a photograph of all the functions that are happening, what threads are running, and what all our variables are set to at a given moment in time. Understanding breakpoints is the key to many of the debugging techniques available to us in Xcode.
Breakpoints are part of the Low-Level Debugger. LLDB is the debugger for Xcode. Many of its functionalities have been built into the user interface, such as the ability to create and edit breakpoints, as we’ll see shortly. It also has many other commands that are not included in the user interface and need to be entered via the Xcode console. By learning these, we can become efficient debuggers…plus, we can do things that look like magic and we can impress our friends and family.

We have already seen the easiest and most common way people create breakpoints in Xcode. Click in the gutter to the left of our code to create a breakpoint on any line. Create a breakpoint in the first few lines of handleTwitterData, inside the do catch block.
Right now when we create a breakpoint, it is kind of limited. It will just signal the code to pause on this line. That’s helpful enough, as it will let us know the app got that far, which is what we were tempted to use NSLogs for. Fortunately for us, breakpoints can do so much more than that.
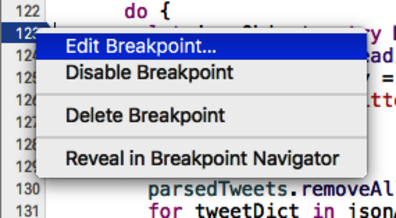
Right-click (or Control-click) on the breakpoint to reveal the breakpoint menu, as seen in the figure. As you will see, one of our options is Edit Breakpoint. Let’s go ahead and select that and see what we can do with it.
Take a look at the default options for editing breakpoints (as seen in the next figure). Notice that we have the following options:
- Add a condition.
- Ignore the breakpoint a variable number of times.
- Add an action.
- Determine if we want the program to pause or not after the program hits the breakpoint.

The ability to ignore a breakpoint is particularly useful if we are dealing with a large collection of items. If we were analyzing a collection of ten million keys and values but we only wanted to know what the forty-second value was, we could tell the compiler to ignore the first forty-one values and analyze the one we want to make sure it is “Life, the Universe, and Everything.”
Breakpoint Logging
Rather than burdening our code with lots of NSLog statements, breakpoints offer something easier to remove when we have finished debugging our code. Click the Add Action button. Notice that one of our options is Log Message, as seen in the following figure.

Log Message lets you do exactly that: log a message to Xcode’s debug console. Since we are attaching this behavior to a breakpoint, it is easier to go back later and filter out all of our debugging tools. Instead of a lot of messy code, we have some nice, neat breakpoints, as seen in the following diagram. In fact, it gets better: breakpoints are saved only in the local user’s Xcode configuration. So, if we send this project to our colleagues, there will be nothing for them to clean up.

The Debugging User Interface
So far, what we’ve accomplished is pretty much what we got from using a bunch of NSLogs: we can tell how far our code got before something went wrong. But handleTwitterData is a long method; are we seriously going to have to put breakpoints all over it and edit each to add a unique log message?
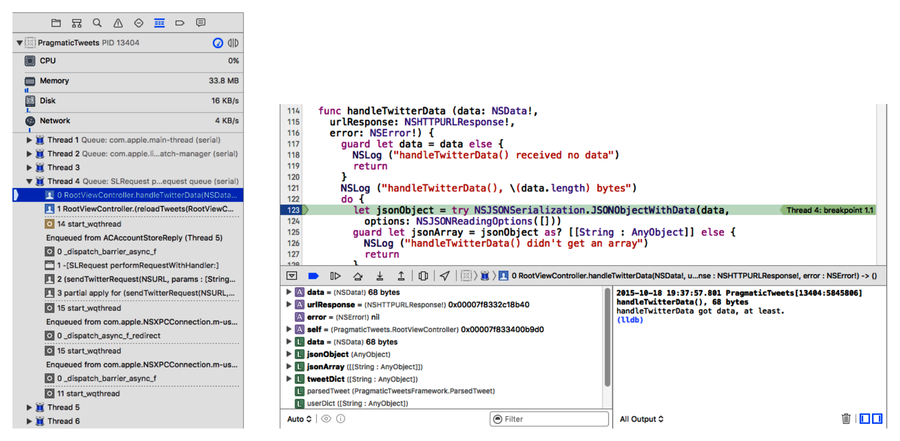
At this level of debugging detail, we can do better. Go ahead and run the app. The usual startup routine will call reloadTweets, eventually resulting in a callback to handleTwitterData, which is where it hits our breakpoint and the Mac automatically switches the foreground application from the iOS Simulator to Xcode. By default, stopping on a breakpoint also causes two debugging-related panes (shown in the following figure) to appear automatically.
-
Debug Navigator (⌘6)—Shows the app’s usage of CPU time, memory, and other resources. When the app is stopped on a breakpoint, it also shows the state of active threads.
-
Debug Area (⇧⌘Y)—As first mentioned in The Xcode Window, this space at the bottom of the window can show output from NSLog. When stopped on a breakpoint, it also lets us look at variables and their values. In this figure, the Debug Navigator is on the left and the Debug area is on the right.
In the bottom right of the Debug area are three important icons: a trashcan and two little boxes. The trashcan clears logged text from println or breakpoints that log messages. The two boxes show or hide the two panes of the Debug area: the left shows a variables view, and the right shows the log messages.
At the top of the Debug area, there’s a toolbar that includes a blue breakpoint icon, along with several other tiny buttons. The breakpoint button turns all breakpoints on or off. The next button to the right is a play/pause button, which allows us to continue after hitting a breakpoint.
The next three buttons are the step buttons. The first, Step Over, allows the app to continue to the next statement in the current method and then stops again. Further right, the down and up arrow icons represent Step In and Step Out, respectively. Step In means that we will enter the statement on this line of code and stop on its first line. Usually, this is only useful if the statement is in code we’ve written, as the debugger can’t show us the source for Apple’s framework code (or third parties’). Step Out does the opposite: it lets the app continue until the current method returns, and stops on the first line in the calling method after returning.
Stepping Through Breakpoints
We are going to use the step buttons to solve our problem. Use the Step Over button to advance one line at a time after the breakpoint. A green arrow in the source will show us where we are after each step.
Our progress may go back and forth on the call to JSONObjectWithData a few times, but it will eventually reach guard let jsonArray = jsonObject as? [ [String:AnyObject] ], and then enter the else block. Here, it logs the message handleTwitterData() didn’t get an array, and it does an early return out of the method.
Progress! We now know we are failing because our JSON response isn’t an array of dictionaries like we expect. That, of course, begs the question “what the heck is it then?”
To figure that out, we need to make another trip through this method. Press the Continue button (between the Breakpoints and Step Over buttons) to let the app continue normally. It finishes its work and fails to update the table. In the Simulator, do a pull-to-refresh on the table, which will make a new Twitter request and hit our breakpoint again. Press Step Over until we’re sitting on the guard statement again.
Use the pane buttons next to the trashcan icon to make sure that both the variables and console panes are showing. The variables view shows us all the variables currently in scope: the parameters that were passed in to handleTwitterData, local variables we’ve created, and self. Variables that have public properties have disclosure triangles that we can use to inspect those variables; we could look at the self.parsedTweets array this way.
Since we know we aren’t getting past the guard on this line, we know that jsonObject isn’t an array of [String : AnyObject] dictionaries. But why not? We can see in the variables view that there is an error that was passed into us, but it’s nil, so that’s probably not the problem. Also, if the try had failed on NSJSONSerialization.JSONObjectWithData, we would have been thrown to the catch block, so parsing the JSON isn’t the problem either.
We need details! Fortunately, LLDB is here to help us out. Any of these variables can be inspected in multiple ways. Let’s hypothesize that the Twitter API has used its response to tell us about an error. That would be in the urlResponse. Right-click (or Control-click) urlResponse, and from the pop-up menu, choose Print Description Of "urlResponse", as shown in the following figure.
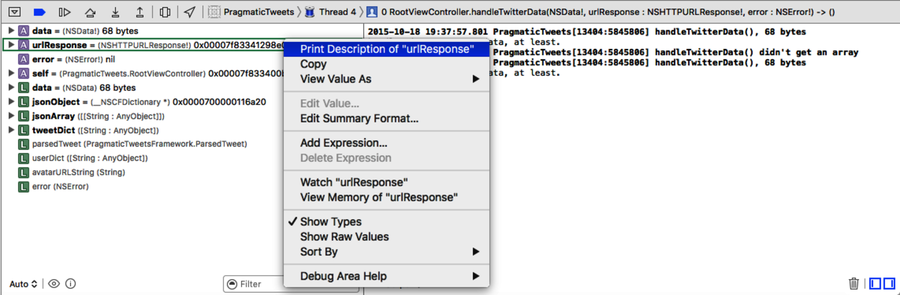
The Debug area will fill in with a log of the object, in this case formatted like a dictionary (only the first few lines are shown here, reformatted to fit the book’s layout):
| | Printing description of urlResponse: |
| | <NSHTTPURLResponse: 0x7f83341298e0> { URL: |
| | https://api.twitter.com/1.1/statuses/foo_bar.json?adc=phone&count=100 } |
| | { status code: 404, headers { |
| | "Content-Encoding" = deflate; |
| | "Content-Length" = 80; |
| | "Content-Type" = "application/json;charset=utf-8"; |
Clear as a bell, we can pick out status code: 404. We asked for an endpoint that doesn’t exist, and that leads us back to the underlying problem.
Sometimes, we don’t even have to print the description. When possible—which usually means for simple things like numeric values and strings—the variables view will show a simple description in the list itself, and we can mouse over a variable in the source while we’re stopped on a breakpoint to see its value. For images, an “eye” icon on the debugging toolbar sometimes lets us even see a popover of an image variable selected in the variables list.
Exception Breakpoints
Another class of breakpoints happens when dealing with uncaught exceptions. Certain problems, instead of failing or crashing immediately—which would at least let Xcode show us which line of code blew up—will throw an NSException object. The exception bubbles up through calling methods until someone deals with it. If nobody does, we usually end up seeing it on a page of scary-looking machine code with a message like libsystem_kernel.dylib‘__pthread_kill:. Lot of good that does us.
Pretend that Xcode is a dinosaur. Xcode goes about its merry way grazing on a bunch of leaves until it accidentally eats some poisoned berries. Xcode starts feeling kind of sick but decides to keep walking and consuming leaves, even though it knows it is sick. It finally succumbs to the poison and falls over dead a mile away from the poisoned berries.
As the caretakers of the Xcode dinosaur, we want to make sure we don’t keep poisoning it, and it would be helpful to us if the Xcode dinosaur knew not to wander away from the berries so that we can figure out where they are and clear them out.
That is what exception breakpoints are for. When we set an exception in the code, we are telling Xcode that if it encounters something that is going to eventually kill it, we want it to stop going and show us where the bad stuff is. In more concrete terms, we want a breakpoint when the exception is raised, not 20 returns later after it hasn’t been caught.
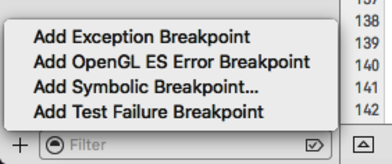
Creating an exception breakpoint is easy. We start in the left pane with the Breakpoint Navigator (⌘7), which shows all breakpoints currently set for our project, organized by class and method. Down at the bottom of the screen we have a plus sign. Clicking on the plus button will open a dialog allowing you to create a few new types of breakpoint.
Choose the Add Exception Breakpoint option. This will create a breakpoint that will automatically stop the program at the exact location where an error will occur. It is a good idea to set the exception breakpoint at the beginning of our program to deal with any issues we might encounter while we are coding. We only need one exception breakpoint.
Fortunately, we need exception breakpoints a lot less in Swift than we did in Objective-C and earlier versions of iOS and Xcode. For example, an array index out of bounds mistake—like asking for the eleventh member of a ten-member array—would be an exception in Objective-C and would dump us into the main method that launched the app. In Swift, array index out of bounds shows up as fatal error: Array index out of range, with Xcode pointing to the offending line.
Still, other classes in Foundation sometimes throw NSExceptions, and exception breakpoints are the key to making sense of them.
Symbolic Breakpoints
If we look at the list of breakpoints we can create with the plus button in the Breakpoint Navigator, we observe that there is an option called Add Symbolic Breakpoint.
A symbolic breakpoint is a breakpoint programmed to pause the app whenever a specified method is called. The thing that makes this interesting is that we can set a symbolic breakpoint on any method in any class, not just the classes we wrote. So we could set a symbolic breakpoint to pause the app whenever viewDidLoad is called. Since viewDidLoad exists in all our UIViewController subclasses, this could be a good way of monitoring behaviors that span the scope of our project.
The following figure updates our hypothetical control flow to use a symbolic breakpoint. If we put a breakpoint on UITableView’s reloadData method, we’d stop on any call to it, whether directly from our code or as a side effect (for example, from navigating between scenes).

Unfortunately, in Xcode 7, the symbol in the Breakpoint Editor pop-up needs to be written in Objective-C syntax, not Swift. So, setting the symbol to UITableView.reloadData() won’t do anything, but -[UITableView reloadData] will pause as we expect. It’s been this way since Xcode 6, so we’re kind of resigned to it staying this way.
We have covered a lot of different ways that we can use breakpoints in our program. At this point, you might be wondering which is the best way. The best way is the one that works for you. We have debugged our program using several kinds of breakpoints, so it is possible to do the same task many different ways. Pick which one you like best or what works best for your specific issues.
Maybe you’ve noticed that our screenshots of the breakpoint gutter on the left side of the code editor show line numbers and wondered why your Xcode isn’t showing line numbers. We are big fans of showing line numbers. It’s a nice reminder that once one of our files hits 1,000 lines, it’s clearly time to refactor that code. Also, it makes the breakpoint gutter a little wider.
To turn on line numbers, go to Xcode’s preferences and select the Text Editing section. The first check box under the Editing tab is Line numbers, and that’s where you can turn them on.

While here, there are a number of other preferences you can set, and the Indentation tab lets you stake out your position in the never-ending tabs-versus-spaces war (although this is also available as a setting on your project as a whole, and the project setting takes precedence over your local preference).
Another useful Xcode preference group is the “Fonts and Colors” group, which features various themes for styling your editor’s color scheme and font sizes.