
Setting Up Your Debugging Environment
When we’re in serious debugging mode, it can sometimes help to make sure our debugging tools are ready to deploy immediately. With that in mind, we are going to set up a special debugging tab with an immersive debugging environment. In programming, being organized is vitally important. It will help our efficiency to have a dedicated space where all of our debugging tools are laid out consistently.
Think of your debugging tab like you would your kitchen. When you go to your kitchen to cook, you can get a recipe started right away because you know where all your tools are. If you didn’t know where to find your measuring cups and the food processor, it would take a lot longer to get something started.
First thing we’ll do is to create a dedicated debugging tab. You can create a new tab by pressing ⌘T, just as you would in a web browser, but there is a better way to create a dedicated debugging tab.
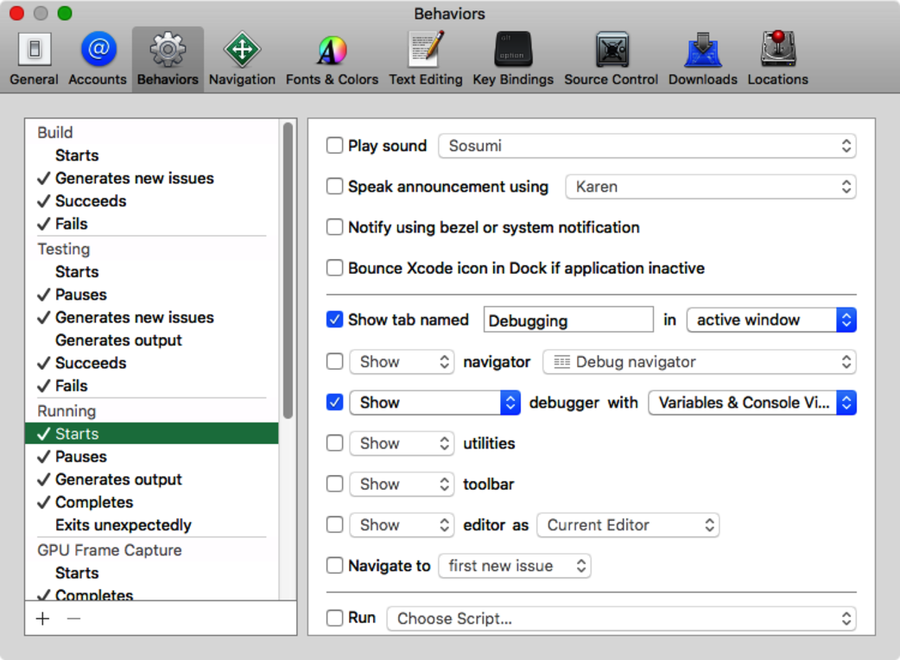
Choose Xcode > Preferences or press ⌘ to access the Preferences window. The third tab from the left is Behaviors. This panel controls all of the behaviors an app will have at each and every stage of its life, along with controlling behaviors present in both automated testing and using OpenGL. Since these skills are a little beyond the scope of a beginner book, we won’t be going over them, but we just wanted you to know they are there for when you want to take your next steps.
We want to make sure that we can see all of our testing tools while we are running and debugging our application. Find the Running section of the list. Instead of just waiting to hit a breakpoint, we want to see the debugger when the app starts, when it pauses, and when it generates output.
Click Starts and look at the options available to us. You will see an option that says “Show tab named empty text box in drop-down menu.” Click on the check box to ensure that it is selected. In the text box, name it something appropriate, like Debugging. Lastly, go into the drop-down menu and select Active Window.
The last thing we need to do before moving on to other parts of the run cycle is to make sure our debugger is showing. If we look at the option two below the Show Tab option, we will see one that says “Show debugger with drop-down menu.” Again, click on the check box to ensure this option is selected and choose Variables & Console View from the options. Our Behaviors for the Starts menu should look the way it does in the following figure.
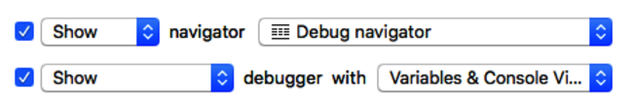
Next, let’s move on in the left column to the behaviors we want when we pause our program. We want to show the debugger with Variables & Console View, but now we also want to select the option above that one, which selects a navigator window to show, and we want the Debug Navigator. Make sure your options look the way they do in the following figure.
Lastly, in Generates Output make sure that you have it set to show the debugger with Variables & Console View.
There! Now we have a handy debugging environment that will always be there for us when we need it. Since this is your debugging environment, make sure you go through and look at all the options you think you might want or need. There is nothing that says everyone must have the same options, so feel free to customize this to suit you.