
Chapter 21
Advanced Access Report Techniques
In This Chapter
- Organizing reports to present the data in a logical manner
- Producing more attractive reports
- Providing additional information about the report
- Learning other approaches to enhance your presentation
Back in the bad old days, most computer-generated reports were printed on pulpy, green-bar paper in strict tabular (row-and-column) format. Users were expected to further process the data to suit their particular needs—often a time-consuming process that involved manually summarizing or graphing the data.
Things have changed. Visually oriented businesspeople want useful, informative reports produced directly from their databases. No one wants to spend time graphing data printed in simple tabular format anymore. Today, users want the software to do much of the work for them. This means that reporting tools such as Access must be able to produce the high-quality, highly readable reports users demand.
Because Access is a Windows application, you have all the Windows facilities at your disposal: TrueType fonts, graphics, and a graphical interface for report design and preview. In addition, Access reports feature properties and an event model (although with fewer events than you saw on forms) for customizing report behavior. You can use the Visual Basic language to add refinement and automation to the reports you build in Access.
In this chapter, we provide some general principles and design techniques to keep in mind as you build Access reports. These principles will help make your reports more readable and informative.
Grouping and Sorting Data
To be most useful, the data on a report should be well organized. Grouping data that’s similar can reduce the amount of data presented, which makes it easier to find specific data. As you’ll see in this section, the Access Report Builder offers a fair degree of flexibility in this regard.
Grouping alphabetically
Data is often displayed with too much granularity to be useful. A report displaying every sale made by every employee arranged in a tabular format can be difficult to read. Anything you do to reduce the overload of tabular reports can make the data more meaningful.
The Group, Sort, and Total pane (which is opened by clicking the Group & Sort button in the Grouping & Totals group on the Design tab) controls how data is grouped on Access reports. Sorting alphabetically arranges the records in alphabetical order based on the first character of the company name, while grouping by company name creates a separate group for each company.
Clicking the Add a Group button below the Sorting and Grouping area opens a list from which you choose a field to use for grouping data on the report. In Figure 21.1, both CompanyName and OrderDate have been selected, with CompanyName being grouped first and then OrderDate sorted within the company groups.

Figure 21.1 Alphabetical grouping is easy.
Typically, data is grouped on the entire contents of a field or combination of fields. Simple grouping on the CompanyName field means that all records for Bottom Dollar Markets appear together as a group and all the records for Ernst Handel appear together as another group. You can, however, override the default and group based on prefix characters by changing the Group On property in the Group, Sort, and Total dialog box.
Notice the More button in the CompanyName sorting bar in Figure 21.1. Clicking the More button reveals the sorting details you want to apply to the CompanyName field (see Figure 21.2). By default, text fields such as CompanyName are sorted alphabetically by the field’s entire contents. You can change this behavior to alter how Access applies grouping to the field’s data (see Figure 21.3).
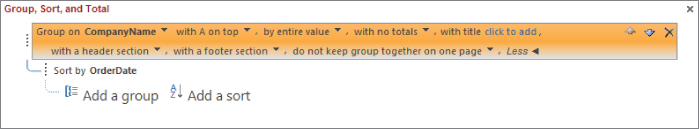
Figure 21.2 Many options are available for grouping and sorting.

Figure 21.3 Modifying a text-based grouping.
When you select by first character, the GroupInterval property tells Access how many characters to consider when grouping on prefix characters. In this case, the grouping interval is set to 1, meaning, “Consider only the first character when grouping.” You could choose to group by the first character, the first two characters, or any number of characters in the field, depending on your requirements.
Notice also that the CompanyName field is set to ascending sort (with A on top), which causes alphabetic grouping starting at names beginning with A and progressing to names beginning with Z. With this combination of properties, all companies starting with A will be grouped together, those beginning with B will be in another group, and so on.
The report for this example (rptSalesJanuarayAlpha1, shown in Figure 21.4) shows purchases during the month of January, sorted by customer name. The order date, the order ID, and the employee filling the order are shown across the page. The result of the sorting and grouping specification in Figure 21.1 is shown in Figure 21.4.
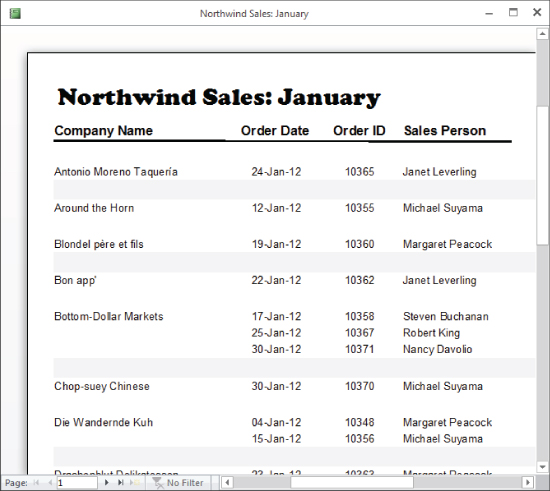
Figure 21.4 A rearrangement of the data shown in Figure , later in this chapter.
It’s important to note that the data shown in Figure 21.4 is identical to the data shown in Figure 21.13. In fact, the same record source (qrySalesJanuary, shown in Figure 21.11 later in this chapter) is used for both of these reports. Often, a data rearrangement yields useful information. For example, you can easily see that Bottom-Dollar Market placed three orders in January, one with salesperson Steven Buchanan, one with Robert King, and one with Nancy Davolio.
Let’s assume you want to refine the rptSalesJanuaryAlpha1 report by labeling the groups with the letters of the alphabet. That is, all customers beginning with A (Antonio Moreno Tagueria and Around the Horn) are in one group, all customers beginning with B (Blondel père et fils, Bon app’, and Bottom-Dollar Market) are in one group, and so on. Within each group, the company names are sorted in alphabetical order. The sales to each customer are further sorted by order date.
To emphasize the alphabetical grouping, a text box containing the first character for each group has been added to the report (see rptSalesJanuaryAlpha2 in Figure 21.5). Although the dataset in this example is rather small, in large reports such headings can be useful.

Figure 21.5 An alphabetic heading for each customer group makes the rptSalesJanuaryAlpha2 report easier to read.
Adding the text box containing the alphabetic character is easy:
- Right-click the report’s title bar and choose Design View.
- Choose Group & Sort from the Design tab of the Ribbon. The Group, Sort, and Total task pane appears.
- Add a Group for CompanyName.
- Click More, and ensure that With a Header Section is selected. This action adds a band for a group based on the CompanyName information (see Figure 21.6).
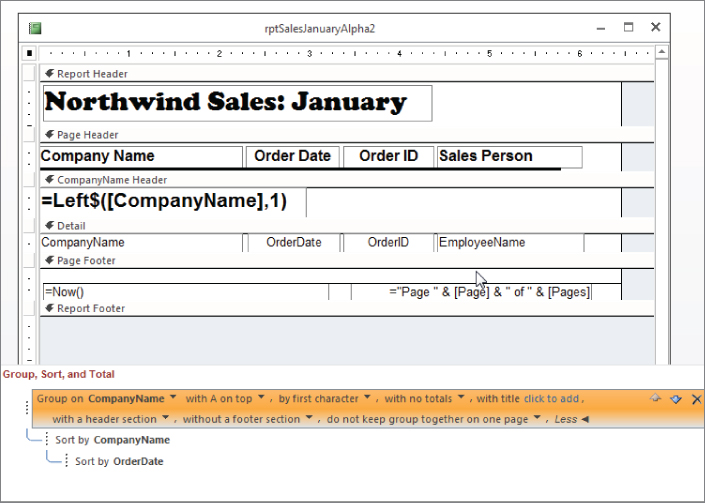
Figure 21.6 rptSalesJanuaryAlpha2 in Design view.
- Select By First Character instead of the default By Entire Value.
- Expand the CompanyName group header and add an unbound text box to the CompanyName group header.
- Set the text box’s Control Source property to the following expression:
=Left$([CompanyName],1) - Set the other text box properties (Font, Font Size, and so on) appropriately.
- While you’re grouping on the first character of the company name, you still need to ensure that company names are sorted correctly. Click Add a Sort and select the CompanyName field again. Click More to ensure that the entire field is going to be sorted, and that no header section will be added.
- Finally, add a sort for OrderDate so that multiple orders for the same company are in order. When you’re done, the report in Design view should appear as shown in Figure 21.6.
Notice the CompanyName group header that was added by the Group Header setting in the Group, Sort, and Total pane. The unbound text box in the CompanyName Header displays the expression used to fill it.
This little trick works because all the rows within a CompanyName group have the first character in common. Using the Left$() function to peel off the first character and use it as the text in the text box in the group header provides an attractive, useful heading for the CompanyName groups.
Grouping on date intervals
Many reports require grouping on dates or date intervals (day, week, or month). For example, Northwind Traders may want a report of January sales grouped on a weekly basis so that week-to-week patterns emerge.
Fortunately, the Access report engine includes just such a feature. An option in the Group, Sort, and Total task pane enables you to quickly and easily group report data based on dates or date intervals. Just as we grouped data based on prefix characters in an earlier example, we can group on dates using the group’s GroupOn property. Figure 21.7 shows the January sales report grouped by each week during the month. This report is named rptSalesJanuaryByWeek.

Figure 21.7 The January sales data grouped by each week during the month.
This report is easy to set up. Open the Group, Sort, and Total task pane again and establish a group for the OrderDate field. Set the OrderDate GroupHeader option to Yes and select the the Group On drop-down list (shown in Figure 21.8). Notice that Access is smart enough to present Group On options (Year, Quarter, Month, Week, and so on) that make sense for Date/Time fields like OrderDate. Selecting Week from this list instructs Access to sort the data on the OrderDate, grouped on a week-by-week basis. Note, though, that you still need to sort by the entire value of the OrderDate to ensure that they’re in sequential order within the week.

Figure 21.8 OrderDate is a Date/Time field, so the grouping options are relevant for date and time data.
The label at the top of the group identifying the week (the first one reads Week beginning 1/1/12:) is the product of the following expression in an unbound text box in the OrderDate group header:
="Week beginning " & [OrderDate] & ":"See the Design view of rptSalesJanuaryByWeek in Figure 21.9. Notice the unbound text box in the OrderDate group header. This text box contains the value of the order date that Access used to group the data in the OrderDate grouping.

Figure 21.9 The Design view of rptSalesJanuaryByWeek. Notice the expression in the OrderDate group header.
Hiding repeating information
An easy improvement to tabular reports is to reduce the amount of repeated information on the report. Figure 21.10 shows a typical tabular report (rptTabularBad) produced by Access, based on a simple query of the Northwind Traders data.
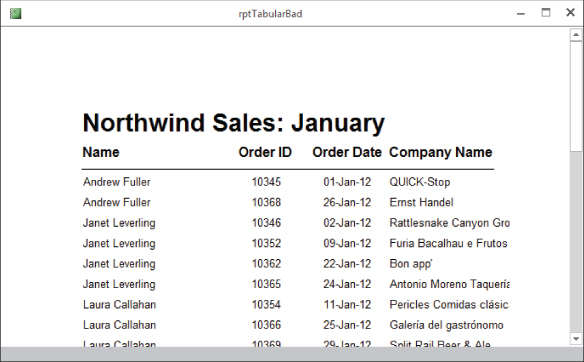
Figure 21.10 Simple tabular reports can be confusing and boring.
The report in Figure 21.10 was produced with the Access Report Wizard, selecting the tabular report format and all defaults. The query underlying this report selects data from the Customers, Orders, and Employees tables in Chapter21.accdb and is shown in Figure 21.11. Notice that the data returned by this query is restricted to the month of January 2012. Also, the first and last names of employees are concatenated as the Name field.

Figure 21.11 The simple query underlying rptTabularBad.
The query in Figure 21.11 (qrySalesJanuary) is used as the basis of several examples in this chapter.
You can significantly improve the report in Figure 21.10 simply by hiding repeated information in the Detail section. As soon as Andrew Fuller’s name is given, there’s no need to repeat it for every sale that Andrew made in January 2012. The way the data is arranged on rptTabularBad, you have to search for where one employee’s sales data ends and another employee’s data begins.
Making the change to hide the repeated values is very easy:
- Open the report in Design view.
- In the Detail section, select the EmployeeName field containing the employee’s first and last names.
- Open the Property Sheet for the Name field (see Figure 21.12).
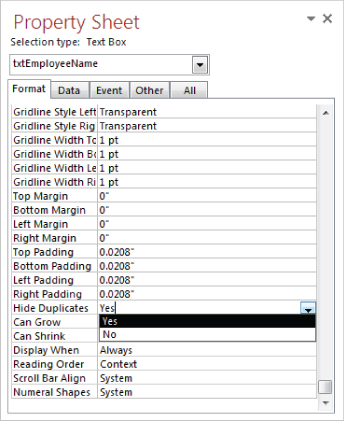
Figure 21.12 The default property values sometimes lead to unsatisfactory results.
- Change the Hide Duplicates property to Yes. The default is No, which directs Access to display every instance of every field.
- Put the report back to Print Preview mode and enjoy the new report layout (shown in Figure 21.13). The report shown in Figure 21.13 is rptTabularGood.

Figure 21.13 Much better! Hide that repeating information.
Distinguishing the sales figures for individual employees in Figure 21.13 is much easier than it is when the repeating information is printed on the report. Notice that no fancy programming or report design was required. A simple property-value change resulted in a much more readable and useful report. (Mainframe report designers working with traditional report writers would kill for a report as good looking as the one shown in Figure 21.13!)
The Hide Duplicates property applies only to records that appear sequentially on the report. As soon as Access has placed a particular Name value on the report, the name won’t be repeated in records immediately following the current record. In Figure 21.13, the records are sorted by the EmployeeName field, so all records for an employee appear sequentially as a group. If the report were sorted by another field (for example, OrderID or OrderDate), the Hide Duplicates property set on the Name field would apply only to those instances where the employee’s name coincidentally appeared sequentially in multiple records on the report.
The Hide Duplicates property can be applied to multiple controls within a report. As long as you understand that Hide Duplicates only hides subsequent duplicate values within a detail section, you should be able to achieve the results you expect. (Note, though, that you may occasionally run into unexpected results if only one of the multiple fields changes.)
Hiding a page header
Sometimes you need to display a page header or footer on just the first page of a report. An example is a terms and conditions clause in the header of the first page of an invoice. You want the terms and conditions to appear only on the first page of the invoice but not on subsequent pages.
Add an unbound Text Box control to the report with its ControlSource property set to the expression =HideHeader(). Delete the text box’s label. The HideHeader() function returns a null string, making the textbox invisible.
The HideHeader() function is as follows:
Function HideHeader() As String


  'Set the visible property of the header
  Me.Section("PageHeader0").Visible = False
  HideHeader = vbNullString


End Function
The invisible text box can be placed virtually anywhere on the first page but is most logically located in the page footer. The assumption is that, because the page header is the first item printed on the page, you’ll always get the first page header. Once the page footer containing the invisible text box has been processed, the page header’s Visible property will be set to False, and the page header will not be seen on any other pages in the report.
Starting a new page number for each group
Sometimes a report will contain a number of pages for each group of data. You might want to reset page numbering to 1 as each group prints so that each group’s printout will have its own page-numbering sequence. For example, assume you’re preparing a report with sales data grouped by region. Each region’s sales may require many pages to print, and you’re using the ForceNewPage property to ensure that grouped data doesn’t overlap on any page. But how do you get the page numbering within each group to start at 1?
The report’s Page property, which you use to print the page number on each page of a report, is a read/write property. This means that you can reset Page at any time as the report prints. Use the group header’s Format event to reset the report’s Page property to 1. Every time a group is formatted, Page will be reset to 1 by the following code:
Private Sub GroupHeader0_Format(Cancel As Integer, FormatCount As Integer)
  Me.Page = 1
End Sub
Use the Page property to display the current page number in the page header or footer as usual. For example, include the following expression in an unbound text box in the page footer:
= "Page " & [Page]The report named rptResetPageEachGroup is included in Chapter21.accdb and shows this technique. Unfortunately, it’s not nearly as easy to count the pages within a group so that you could put a “Page x of y” in the page footer, where y is the number of pages within the group.
Formatting Data
In addition to sorting and grouping data, you can make reports more useful by formatting them to highlight specific information. Numbering the entries or using bullets can make things stand out, as can using lines or spaces to separate parts of the report. Ensuring that the elements on the report are positioned in a consistent manner is important as well; you might have all the necessary data in a report, but poor presentation can leave a very negative impression on the users. The techniques discussed in this section will help you produce reports that are more professional looking.
Creating numbered lists
By default, the items contained on an Access report are not numbered. They simply appear in the order dictated by the settings in the Group, Sort, and Total task pane.
Sometimes it would be useful to have a number assigned to each entry on a report or within a group on a report. You might need a number to count the items in a list or uniquely identify items in the list. For example, an order details report might contain an item number for each item ordered, plus a field for items ordered, showing how many things were ordered.
The Access Running Sum feature provides a way to assign a number to each item in a list on an Access report. For example, the Northwind Traders sales management has asked for a report showing the sum of all purchases by each customer during the month of January, sorted in descending order so that the top purchaser appears at the top. Oh, yes—and they want a number assigned to each line in the report to provide a ranking for the Northwind customers.
What an assignment! The query to implement this request is shown in Figure 21.14 (qryCustomerPurchasesJanuary). This query sums the purchases by each customer for the month of January 2012. Because the Purchases column is sorted in descending order, the customers buying the most product will appear at the top of the query results set. The OrderDate field is not included in the query results and is used only as the query’s selection criterion (notice the Where in the Total row).

Figure 21.14 An interesting query that sums data and sorts the query results in descending order of the sum.
Although you could do much of this work at run time using VBA to programmatically sum the values returned by the query or a SQL statement in the report’s RecordSource property, you should always let the Access query engine perform aggregate functions. All Access queries are optimized when you save the query. You’re guaranteed that the query will run as fast as possible—much faster than a filter based on a SQL statement in a report’s RecordSource property.
The basic report (rptUnNumberedList) prepared from the data provided by qryCustomerPurchasesJanuary is shown in Figure 21.15. All sorting options have been removed from the Group, Sort, and Total dialog box to permit the records to arrange themselves as determined by the query.

Figure 21.15 A straightforward report (rptUnNumberedList) produced with data from qryCustomerPurchasesJanuary.
Adding a Ranking column to the simple report you see in Figure 21.15 is not difficult. Although the information that’s shown in Figure 21.15 is useful, it’s not what the user asked for.
To add a Ranking column to the report, use the RunningSum property of an unbound text box to sum its own value over each item in the report. When the RunningSum property is set to Over Group, Access adds 1 to the value in this text box for each record displayed in the Detail section of the report (RunningSum can also be used within a group header or footer). The alternate setting (Over All) instructs Access to add 1 each time the text box appears in the entire report. Add an unbound text box to the left of the CompanyName text box on the report, with an appropriate header in the Page Header area. Set the RecordSource property for the text box to =1 and the RunningSum property to Over All. Figure 21.16 shows how the Rank text box is set up on rptNumberedList.

Figure 21.16 The value in the unbound text box named txtRank will be incremented by 1 for each record in the report.
When this report (rptNumberedList) is run, the Rank column is filled with the running sum calculated by Access (see Figure 21.17). Once again, the data in this report is the same as in other report examples. The main difference is the amount of manipulation done by the query before the data arrives at the report and the additional information provided by the running sum.

Figure 21.17 The Running Sum column provides a ranking for each customer in order of purchases during January.
Reports can contain multiple running sum fields. You could, for example, keep a running sum to show the number of items packed in each box of a multiple-box order while another running sum counts the number of boxes. The running sum starts at zero, hence the need to initialize it to 1 in the Control Source property on the Property Sheet.
You can also assign a running sum within each group by setting the RunningSum property of the unbound text box to Over Group instead of Over All. In this case, the running sum will start at zero for each group. So, be sure to set the ControlSource property of a group’s running sum to 1.
Creating bulleted lists
You can add bullet characters to a list instead of numbers, if you want. Instead of using a separate field for containing the bullet, however, you can simply concatenate the bullet character to the control’s RecordSource property—a much easier solution. Access will “glue” the bullet character to the data as it’s displayed on the report, eliminating alignment problems that might occur with a separate unbound text box.
The design of rptBullets is shown in Figure 21.18. Notice the bullet character in the txtCompanyName text box as well as in the Property Sheet for this text box.

Figure 21.18 The bullet character is added to the ControlSource property of the txtCompanyName text box.
The bullet is added by exploiting a Windows feature. Position the text insertion character in the RecordSource property for the CompanyName field, hold down the Alt key, and type 0149. Windows inserts the standard Windows bullet character, which you see in the Property Sheet. Looking at Figure 21.18, you can see that the bullet character is inserted correctly into the text box on the report. The expression you use in the ControlSource property is the following:
= "•" & Space$(2) & [CompanyName]where the bullet is inserted by the Alt+0149 trick.
You can produce the same effect by using the following expression in the text box:
= Chr(149) & Space$(2) & [CompanyName]This expression concatenates the bullet character—returned by Chr(149)—with the data in the CompanyName field.
The report now appears as shown in Figure 21.19. You can increase the number in the Space$() function to pad the white space between the bullet and the text. Because the bullet character and CompanyName field have been concatenated together in the text box, they’ll be displayed in the same typeface. Also, adding the bullet character to the text box containing the company name guarantees that the spacing between the bullet and first character of the company name will be consistent in every record. When using proportionally spaced fonts such as Arial, it can sometimes be difficult to get precise alignment between report elements. Concatenating data in a text box eliminates spacing problems introduced by proportionally spaced characters. Note, though, that if the amount of text in the text box exceeds a single row, subsequent rows will not be indented.

Figure 21.19 Use a Windows feature to insert the bullet in front of the CompanyName field.
You might want to add other special characters to the control. For a complete display of the characters available in the font you’ve chosen for the Text Box control, run Charmap.exe, the Windows Character Map application (see Figure 21.20). Be sure to select the font you’ve chosen for the Text Box control. The only constraint on the characters you use on an Access report is that the font used in the text boxes on the report must contain the specified characters. Not all Windows TrueType character sets include all the special characters, like bullets.

Figure 21.20 Charmap is a useful tool for exploring Windows font sets.
Charmap is quite easy to use. Select a font from the drop-down list at the top of the dialog box, and the main area fills with the font’s default character set. Some character sets are incredibly large. For example, the Arial Unicode MS font includes more than 53,000 different characters, including traditional and simplified Chinese, Japanese Kanji, and Korean Hangul character sets.
Most characters in a Windows font are accessible through the Chr$() function. The page footer of rptBullets includes a text box filled with characters specified by the Chr$() function. For example, the smiley face character in the Wingdings font is specified with Chr$(74). Some of the characters displayed by Charmap are identified only by their hexidecimal values. If the decimal value is not given, the hexidecimal value can be used with Chr$() by using the CLng() function to convert the hex value to integer: Chr$(CLng("&H00A9")) displays the familiar copyright symbol (©) when used to set the contents of a control set to the Arial font.
Adding emphasis at run time
You might add a number of hidden controls to your reports to reduce the amount of clutter and unnecessary information. You can hide and show controls based on the value of another control. You hide a control, of course, by setting its Visible property to False (or No) at design time. Only when the information contained in the control is needed do you reset the Visible property to True.
An example might be a message to the Northwind Traders customers that a certain item has been discontinued and inventory is shrinking. It’s silly to show this message for every item in the Northwind catalog; including the number of units in stock, in conjunction with a message that a particular item has been discounted, might encourage buyers to stock up on the item.
Figure 21.21 shows rptPriceList in Print Preview mode. (You may have to right-click on the report name and select Print Preview from the context menu.) Notice that the Guarana Fantastica beverage product appears in italics, the price is bold italics, and the Only 20 units in stock! message appears to the right of the product information.
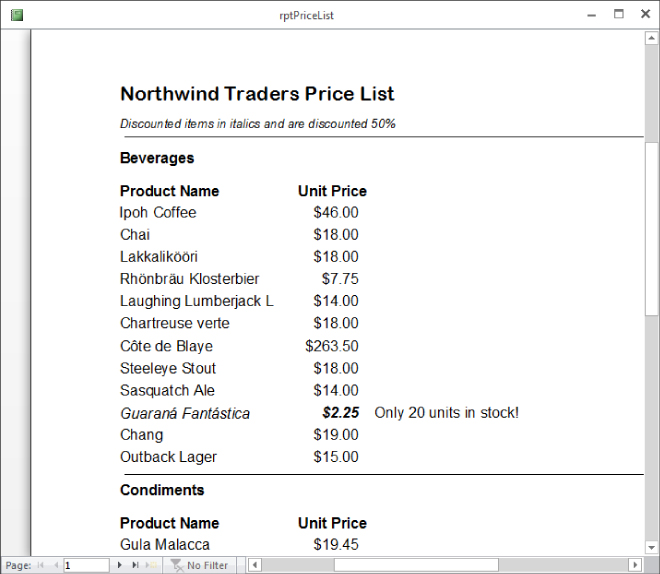
Figure 21.21 Can you tell Guarana Fantastica is on sale?
Figure 21.22 reveals part of the secret behind this technique. The visible unit price text box is actually unbound. This is the text box used to display the unit price to the user. Another text box is bound to the UnitPrice field in the underlying recordset, but it’s hidden by setting its Visible property to No. Just to the left of the hidden UnitPrice field is a hidden check box representing the Discontinued field. txtMessage, which contains the Only x units in stock! message, is also hidden.

Figure 21.22 rptPriceList in Design view reveals how this effect is implemented.
Use the Detail section’s Format event to switch the Visible property of txtMessage to True whenever txtDiscontinued contains a true value. The code is quite simple:
Private Sub Detail1_Format(Cancel As Integer, _
  FormatCount As Integer)


    Me.txtProductName.FontItalic = Me.Discontinued.Value
    Me.txtPrice.FontItalic = Me.Discontinued.Value
    Me.txtPrice.FontBold = Me.Discontinued.Value


    'Cut price in half for discontinued
    Me.txtPrice = Me.UnitPrice * IIf(Me.Discontinued.Value, 0.5, 1)
    Me.txtMessage.Visible = Me.Discontinued.Value


End Sub
In this procedure, Me is a shortcut reference to the report. You must explicitly turn off the italics, bold, and other font characteristics when the product is not discontinued; otherwise, once a discontinued product has been printed, all products following the discontinued product will print with the special font attributes. The font characteristics you set in a control’s Property Sheet are just the initial settings for the control. If you change any of those properties at run time, they stay changed until modified again. Similarly, txtMessage must be hidden after it’s been displayed by setting its Visible property to False, or in this case the value of Discontinued.
Avoiding empty reports
If Access fails to find valid records to insert into the Detail section of a report, all you’ll see is a blank Detail section when the report is printed. To avoid this problem, attach code to the report’s NoData event that displays a message and cancels the print event if no records are found.
The NoData event is triggered when Access tries to build a report and finds no data in the report’s underlying recordset. Using NoData is easy:
Private Sub Report_NoData(Cancel As Integer)


    MsgBox "There are no records for this report."
    Cancel = True


End Sub
The Cancel = True statement instructs Access to stop trying to show the report. The user will see the dialog box shown in Figure 21.23 and will avoid getting a report that can’t be printed. (Open rptEmpty in Chapter21.accdb for this example.)
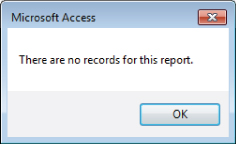
Figure 21.23 Inform the user that there are no records to print.
Because the NoData event is tied to the report itself, don’t look for it in any of the report’s sections. Simply add this code as the report’s NoData event procedure, and your users will never wonder why they’re looking at a blank report.
Inserting vertical lines between columns
You can easily add a vertical line to a report section whose height is fixed (like a group header or footer). Adding a vertical line to a section that can grow in height (like a Detail section on a grouped report) is more difficult. It’s really difficult to get a vertical line between columns of a report (see rptVerticalLines in Figure 21.24). If you simply add a vertical line to the right side of a section of a snaking columns report, the line will appear to the right of the rightmost column on the page. You have to be able to specify where vertical lines will appear on the printed page.

Figure 21.24 Vertical lines in rptVerticalLines help segregate data.
Reports using snaking columns are discussed in the “Adding Even More Flexibility” section later in this chapter.
Although you add most controls at design time, sometimes you have to explicitly draw a control as the report is prepared for printing. The easiest approach in this case is to use the report’s Line method to add the vertical line at run time. The following subroutine, triggered by the Detail section’s Format event, draws a vertical line 3 inches from the left printable margin of the report:
Private Sub Detail_Format(Cancel As Integer, FormatCount As Integer)
  Dim X1 as Single
  X1 = 3.5 * 1440
  Me.Line (X1, 0)-(X1, 32767)
End Sub
The syntax of the Line method is as follows:
object.Line (X1, Y1) - (X2, Y2)The Line method requires four arguments. These arguments (X1, X2, Y1, and Y2) specify the top and bottom (or left and right, depending on your perspective) coordinates of the line. Notice that all calculated measurements on a report must be specified in twips. (There are 1,440 twips per inch or 567 twips per centimeter.) In this case, X1 and X2 are the same value, and we’re forcing the line to start at the very top of the Detail section (0) and to extend downward for 32,767 twips.
You might wonder why we’re using 32,767 as the Y2 coordinate for the end of the line. Access will automatically “clip” the line to the height of the Detail section. Because the Line control doesn’t contain data, Access won’t expand the Detail section to accommodate the line you’ve drawn in code. Instead, Access draws as much of the 32,767-twip line as needed to fill the Detail section, and then it stops. The maximum value for Y2 is 32,767.
The same procedure could be used to draw horizontal lines for each section on the report. In the report example (rptVerticalLines) in the database accompanying this chapter (Chapter21.accdb), we’ve added Line controls to the report instead. Using the Line control when the height of the report section is fixed (for example, in the group header and footer) is simply faster than drawing the line for each of these sections.
Adding a blank line every n records
Detail sections chock-full of dozens or hundreds of records can be difficult to read. It’s easy to lose your place when reading across columns of figures and when the rows are crowded together on the page. Wouldn’t it be nice to insert a blank row every fourth or fifth record in a Detail section? It’s much easier to read a single row of data in a report (rptGapsEvery5th in Chapter21.accdb) where the records have been separated by white space every fifth record (see Figure 21.25).

Figure 21.25 Using white space to break up tabular data can make it easier to read.
Access provides no way to insert a blank row in the middle of a Detail section. You can, however, trick Access into inserting white space in the Detail section now and then with a little bit of programming and a couple of hidden controls.
Figure 21.26 reveals the trick behind the arrangement you see in Figure 21.25. An empty, unbound text box named txtSpacer is placed below the fields containing data in the Detail section. To the left of txtSpacer is another unbound text box named txtCounter.

Figure 21.26 This report trick uses hidden unbound text boxes in the Detail section.
Set the properties in Table 21.1 for txtSpacer, txtCounter, and the Detail sections.
Table 21.1 Properties for the “Blank Line” Example
| Control | Property | Value |
| txtSpacer | Visible | Yes |
| CanShrink | Yes | |
| txtCounter | Visible | No |
| RunningSum | Over All | |
| ControlSource | =1 | |
| Detail1 | CanShrink | Yes |
These properties effectively hide the unbound txtSpacer and txtCounter controls, and permit these controls and the Detail section to shrink as necessary when the txtSpacer Text Box control is empty. Even though txtSpacer is visible to the user, Access shrinks it to 0 height if it contains no data. The txtCounter control never needs any space because its Visible property is set to No, hiding it from the user.
The last step is to enter the following code as the Detail section’s Format event procedure:
Private Sub Detail1_Format(Cancel As Integer, _
  FormatCount As Integer)


  If Me.txtCounter.Value Mod 5 = 0 Then
    Me.txtSpacer.Value = Space$(1)
  Else
    Me.txtSpacer.Value = Null
  End If


End Sub
The Format event occurs as Access begins to format the controls within the Detail section. The value in txtCounter is incremented each time a record is added to the Detail section. The Mod operator returns whatever number is left over when the value in txtCounter is divided by 5. When txtCounter is evenly divisible by 5, the result of the txtCounter Mod 5 expression is 0, which causes a space character to be assigned to txtSpacer. In this situation, because txtSpacer is no longer empty, Access increases the height of the Detail section to accommodate txtSpacer, causing the “empty” space every fifth record to be printed in the Detail section. You never actually see txtSpacer because all it contains is an empty space character.
txtCounter can be placed anywhere within the Detail section of the report. Make txtSpacer as tall as you want the blank space to be when it’s revealed on the printout.
Even-odd page printing
If you’ve ever prepared a report for two-sided printing, you may have encountered the need for knowing whether the data is being printed on the even side of the page or the odd side of the page. Most users prefer the page number to be located near the outermost edge of the paper. On the odd-numbered page, the page number should appear on the right edge of the page, while on the even-numbered side, the page number must appear on the left side of the page. How, then, do you move the page number from side to side?
Assuming the page number appears in the Page Footer section of the report, you can use the page footer’s Format event to determine whether the current page is even or odd, and align the text to the left or right side of the text box accordingly.
The basic design of rptEvenOdd is shown in Figure 21.27. Notice that the Width property of txtPageNumber is set to the same as the report header. Also, the TextAlign property is set to Right. The Format event will determine whether the text is aligned to the right or left, so setting TextAlign to Right is a bit arbitrary.

Figure 21.27 txtPageNumber is the same width as the report.
The Page Footer Format event procedure adjusts the TextAlign property of txtPageNumber to shift the page number all the way to the left or right side of the text box depending on whether the page is even or odd.
Private Sub PageFooter1_Format(Cancel As Integer, _
    FormatCount As Integer)


    Const byALIGN_LEFT As Byte = 1
    Const byALIGN_RIGHT As Byte = 3


    If Me.Page Mod 2 = 0 Then
      Me.txtPageNumber.TextAlign = byALIGN_LEFT
    Else
      Me.txtPageNumber.TextAlign = byALIGN_RIGHT
    End If


End Sub
In this event procedure, any time the expression Me.Page Mod 2 is zero (meaning the page number is even), the TextAlign property is set to Left. On odd-numbered pages, TextAlign is set to Right.
Like magic, this event procedure causes the Page Number text to move from the right side on odd-numbered pages to the left side on even-numbered pages (see Figure 21.28).

Figure 21.28 txtPageNumber jumps from right to left.
Using different formats in the same text box
On some reports, you may want the format of certain fields in a record to change according to the values in other fields on the report. A good example is a journal voucher report in a multicurrency financial system in which the voucher detail debit or credit amount format varies according to the number of decimal places used to display the currency value.
Unfortunately, a control in a Detail section of a report can have but a single format specified in its Property Sheet. Use the following trick to flexibly set the format property at run time. The FlexFormat() function, which is stored in MFunctions and used in rptFlexFormat, uses the lDecimals argument to return a string specifying the desired format:
Public Function FlexFormat(lDecimals As Long) As String


    FlexFormat = "#,##0." & String(lDecimals, "0")


End Function
The String function returns text that has lDecimal number of characters and all the characters are 0. If lDecimals is 2, for example, FlexFormat returns "#,##0.00".
Assume that the field to be dynamically formatted has its ControlSource set to [Amount]. The format of the Amount text box should vary depending on the value of the CurrDecPlaces field in the same record. CurrDecPlaces is a Long Integer data type. To use FlexFormat, change the ControlSource property of the Amount text box to the following:
=Format([Amount],FlexFormat([CurrDecPlaces]))The Amount text box will be dynamically formatted according to the value contained in the CurrDecPlaces text box. This trick may be generalized to format fields other than currency fields. By increasing the number of parameters of the user-defined formatting function, the formatting can be dependent on more than one field, if necessary.
Centering the title
Centering a report title directly in the middle of the page is often difficult. The easiest way to guarantee that the title is centered is to stretch the title from left margin to right margin, and then click the Center button in the Text Formatting group of the Home tab.
Aligning control labels
Keeping text boxes and their labels properly aligned on reports is sometimes difficult. Because a text box and its label can be independently moved on the report, all too often the label’s position must be adjusted to bring it into alignment with the text box.
You can eliminate text box labels completely by including the label text as part of the text box’s record source. Use the concatenation character to add the label text to the text box’s control source:
= "Product: " & [ProductName]Now, whenever you move the text box, both the label and the bound record source move as a unit. The only drawback to this technique is that you must use the same format for the text box and its label.
Micro-adjusting controls
The easiest way to adjust the size or position of controls on a report in tiny increments is to hold down either the Shift or Control key and press the arrow key corresponding to Table 21.2.
Table 21.2 Micro-Adjustment Keystroke Combinations
| Key Combination | Adjustment |
| Control+Left Arrow | Move left |
| Control+Right Arrow | Move right |
| Control+Up Arrow | Move up |
| Control+Down Arrow | Move down |
| Shift+Left Arrow | Reduce width |
| Shift+Right Arrow | Increase width |
| Shift+Up Arrow | Reduce height |
| Shift+Down Arrow | Increase height |
Another resizing technique is to position the cursor over any of the sizing handles on a selected control and double-click. The control automatically “sizes to fit” the text contained within the control. This quick method can also be used to align not only labels but also text boxes to the grid.
Adding Data
When you’re looking at data through forms, you can usually assume that the data is current. However, with printed reports, you don’t always know if the data is old. Adding little touches like when the report was printed can help increase the usefulness of a report. This section shows you some techniques that enable you to add additional information to the report to let the users know something of its origin.
Adding more information to a report
You probably know that the following expression in an unbound text box prints the current page and the number of pages contained in the report:
="Page " & [Page] & " of " & [Pages]Both Page and Pages are report properties that are available at run time and can be included on the report.
But consider the value of adding other report properties on the report. Most of the report properties can be added to unbound text boxes as long as the property is enclosed in square brackets. For the most part, these properties are only of value to you as the developer, but they may also be useful to your users.
For example, the report’s Name, RecordSource, and other properties are easily added the same way. Figure 21.29 demonstrates how unbound text boxes can deliver this information to a report footer or some other place on the report.

Figure 21.29 rptMoreInfo demonstrates how to add more information to your reports.
The inset in the lower-right part of Figure 21.29 shows the information provided by adding the four text boxes to this report. Very often, the user is not even aware of the name of a report—the only text the user sees associated with reports is the text that appears in the title bar (in other words, the report’s Caption property). If a user is having problems with a report, it might be helpful to display the information you see in Figure 21.29 in the report footer.
Adding the user’s name to a bound report
An unbound text box with its ControlSource set to an unresolved reference will cause Access to pop up a dialog box requesting the information necessary to complete the text box. For example, an unbound text box with its RecordSource set to the following displays the dialog box you see in the middle of Figure 21.30 when the report is run:
=[What is your name?]
Figure 21.30 Use an unbound text box to capture useful information.
Access displays a similar Parameter dialog box for each parameter in a parameter query. The text entered into the text box is then displayed on the report. (rptUserName in Chapter21.accdb on this book’s companion website demonstrates this technique.)
The unbound text box on the report can be referenced by other controls on the report. The Parameter dialog box appears before the report is prepared for printing, which means that the data you enter into the dialog box can be used in expressions, calculations, or the VBA code behind the report.
Adding Even More Flexibility
As you’ve probably discovered by now, reporting in Access is a very large topic. We’ve included a few additional techniques that will help you make your reports even more flexible to users.
Displaying all reports in a combo box
The names of all the top-level database objects are stored in the MSysObjects system table. You can run queries against MSysObjects just as you can run queries against any other table in the database. It’s easy to fill a combo box or list box with a list of the report objects in an Access database.
Choose Table/Query as the RowSource Type for the list box and put this SQL statement in the RowSource of your list box to fill the box with a list of all reports in the database:
SELECT DISTINCT [Name] FROM MSysObjects
WHERE [Type] = -32764
ORDER BY [Name];
The -32764 identifies report objects in MSysObjects, one of the system tables used by Access. The results are shown in Figure 21.31.

Figure 21.31 frmAllReports displays the reports in Chapter21.accdb.
If you’re using a naming convention for your database objects, use a prefix to show only the reports you want. The following code returns only those reports that begin with tmp:
SELECT DISTINCTROW [Name] FROM MSysObjects
WHERE [Type] = -32764 AND Left([Name], 3) = "tmp"
ORDER BY [Name];
Because MSysObjects stores the names of all database objects, you can return the names of the other top-level database objects as well. Just substitute the –32764 as the type value in the preceding SQL statement with the Table 21.3 values to return different database object types.
Table 21.3 Access Object Types and Values
| Object | Type Value |
| Local Tables | 1 |
| Linked tables (except tables linked using ODBC) | 6 |
| Linked tables using ODBC | 4 |
| Forms | –32768 |
| Modules | –32761 |
| Macros | –32766 |
| Queries | 5 |
To view the MSysObjects table, set the Show System Objects setting to Yes in the Navigation Options dialog box (which you can get to by right-clicking on the Navigation pane’s title bar, and selecting Navigation Options from the shortcut menu). MSysObjects does not have to be visible for this trick to work.
Fast printing from queried data
A report that is based on a query can take a long time to print. Because reports and forms can’t share the same recordset, once a user has found the correct record on a form, it’s a shame to have to run the query over again to print the record on a query. A way to “cache” the information on the form is to create a table (we’ll call it tblCache) containing all the fields that are eventually printed on the report. Then, when the user has found the correct record on the form, copy the data from the form to tblCache, and open the report. The report, of course, is based on tblCache.
The query is run only once to populate the form. Copying the data from the form to tblCache is a very fast operation, and multiple records can be added to tblCache as needed. Because the report is now based on a table, it opens quickly and is ready to print as soon as the report opens.
Using snaking columns in a report
When the data displayed on a report doesn’t require the full width of the page, you may be able to conserve the number of pages by printing the data as snaking columns, as in a dictionary or phone book. Less space is wasted and fewer pages need to be printed, speeding the overall response of the report. More information is available at a glance and many people find snaking columns more aesthetically pleasing than simple blocks of data.
For the examples in this section, we need a query that returns more data than we’ve been using up to this point. Figure 21.32 shows the query used to prepare the sample reports in this section.

Figure 21.32 This query returns more detailed information than we’ve been using.
This query returns the following information: CompanyName, OrderID, OrderDate, ProductName, UnitPrice, and Quantity for the period from January 1, 2012, to March 31, 2012.
The initial report design for rptSalesQ1 is shown in Design view in Figure 21.33. This rather complex report includes a group based on the order ID for each order placed by the company, as well as a group based on the company itself. This design enables us to summarize data for each order during the quarter, as well as for the company for the entire quarter.

Figure 21.33 Notice how narrow the records in this report are.
The same report in Print Preview mode is shown in Figure 21.34. Notice that the report really doesn’t make good use of the page width available to it. In fact, each record of this report is only 3¼ inches wide.
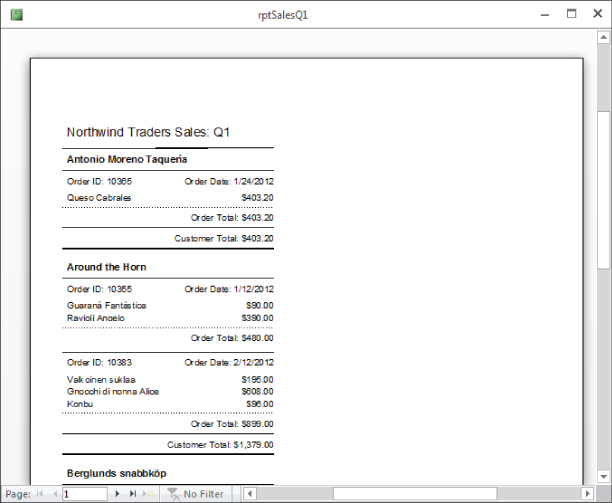
Figure 21.34 The report makes poor use of the available page width.
Setting a report to print as snaking columns is actually part of the print setup for the report, not an attribute of the report itself. With the report in Design view, click on the Columns button on the Report Design Tools Page Setup tab of the Ribbon to open the Page Setup dialog box (shown in Figure 21.35) with the Columns tab selected. Change the Number of Columns property to 2. As you change Number of Columns from 1 to 2, the Column Layout area near the bottom of the Layout tab becomes active, showing you that Access has selected the Across, Then Down option to print items across the page first, and then down the page. Although this printing direction is appropriate for mailing labels, it’s not what we want for our report. Select the Down, Then Across option to direct Access to print the report as snaking columns (see Figure 21.35).

Figure 21.35 Only a few changes are needed to produce snaking columns.
When working with snaking columns, make sure the proper Column Layout option is selected. If you neglect to set the Column Layout to Down, Then Across, the snaking columns will be laid out horizontally across the page. This common error can cause a lot of confusion because the report won’t look as expected (see Figure 21.36). The reports shown in Figures 21.36 and 21.37 are the same with the exception of the Column Layout setting.
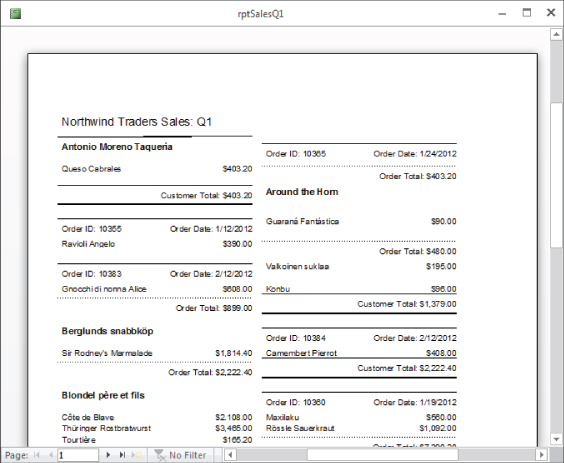
Figure 21.36 The wrong Column Layout setting can be confusing.
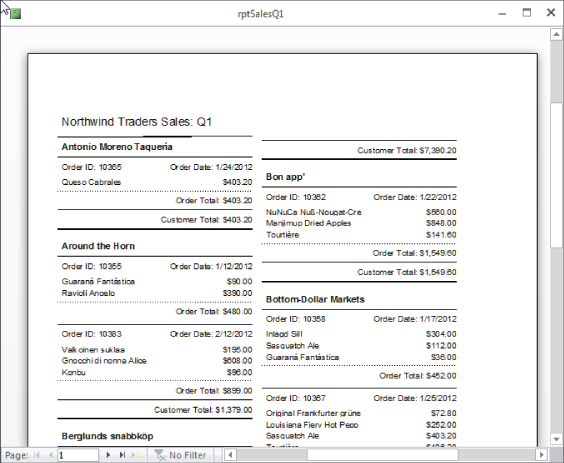
Figure 21.37 Snaking multiple columns conserve page space and provide more information at a glance.
As long as the Same as Detail check box is not checked, Access intelligently adjusts the Column Spacing and other options to accommodate the number of items across that you’ve specified for the report. With Same as Detail checked, Access will force the columns to whatever width is specified for the columns in Design view, which might mean that the number of columns specified in the Number of Columns parameter won’t fit on the page.
Figure 21.37 clearly demonstrates the effect of changing the report to a snaking two-column layout. Before the change, this report required 17 pages to print all the data. After this change, only nine pages are required.
You may be wondering about the other print options in the Page Setup dialog box (refer to Figure 21.35). Here is a short description of each of the relevant settings in the Layout tab of the Page Setup dialog box:
- Number of Columns: Specifies the number of columns in the report. You should be aware that Number of Columns affects only the Detail section, Group Header section, and Group Footer section of the report. The Page Header section and Page Footer section are not duplicated for each column. When designing a multi-column report, you must keep the width of the design area narrow enough to fit on the page when multiplied by the number of columns you’ve selected. Most often, printing a report in landscape mode helps the width required for more than one column in a report.
- Row Spacing: Additional vertical space allowed for each detail item. Use this setting if you need to force more space between detail items than the report’s design allows.
- Column Spacing: Additional horizontal space allowed per column. Use this setting if you need to force more space between columns in the report than the design allows.
- Column Size – Same as Detail: The column width and detail height will be the same as on the report in Design view. This property is useful when you need to fine-tune the column placement on a report (for example, when printing the data onto preprinted forms). Making adjustments to the report’s design will directly influence how the columns print on paper.
- Column Size – Width and Height: The width and height of a column. These options are handy when printing onto preprinted forms to ensure that the data falls where you want it to.
- Column Layout: How the items are to be printed: either Across, Then Down or Down, Then Across.
In addition to these properties, be sure to take note of the New Row or Col property for the CompanyName Header section (see Figure 21.38). The values for New Row or Col are None, Before Section, After Section, Before & After. You use New Row or Col to force Access to, for example, start a new column immediately after a group footer or detail section has printed (see Figure 21.39). Depending on your reports and their data, New Row or Col may provide you with the flexibility necessary to make reports more readable.
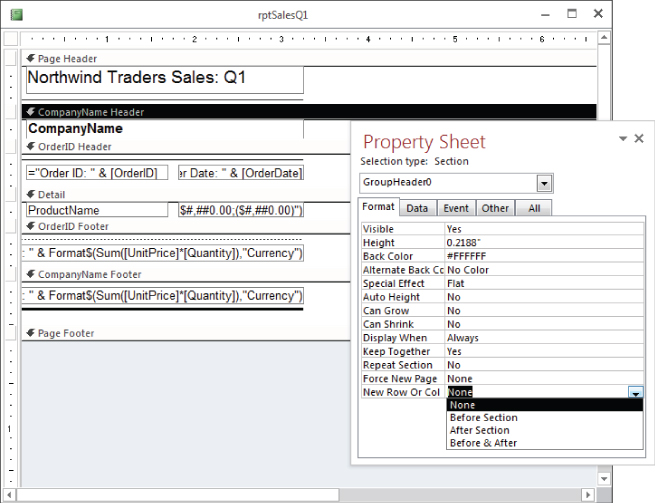
Figure 21.38 Headers (and footers) have properties that can be used to control actions when the grouping value changes.

Figure 21.39 New Row or Col forces Access to start a column before or after a section.
Keep in mind that the measurement units you see on the Page Setup tab of the Ribbon are determined by the Windows international settings. For example, in Germany or Japan where the metric system is used, the units of measure will be centimeters instead of inches. Also, you must allow for the margin widths set in the Margins gallery, accessed from the Page Setup tab of the Ribbon (see Figure 21.40).
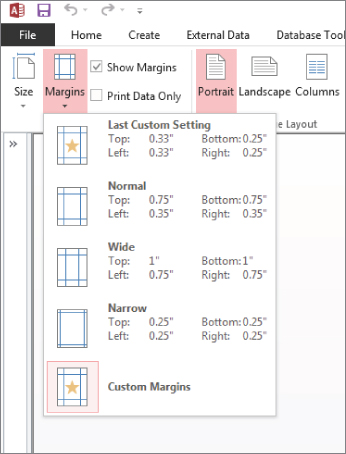
Figure 21.40 All report page settings must consider the margin widths.
For example, if you specify a Column Size Width of 3.5” and the left margin is set to 1”, this means the right edge of the column will actually fall 4 inches from the left physical edge of the paper, or more than halfway across an 8-x-11-inch sheet of paper printed in portrait mode. These settings will not allow two columns, each 3 inches wide, to print on a standard letter-size sheet of paper. In this case, you might consider reducing the left and right margins until the 3-inch columns fit properly. (Don’t worry about setting the margins too small to work with your printer. Unless you’re working with a nonstandard printer, Windows is pretty smart about knowing the printable area available with your printer and won’t allow you to set margins too small.)
Exploiting two-pass report processing
In Chapter 20, we mention that Access uses a two-pass approach when formatting and printing reports. We’ll now explore what this capability means to you and how you can exploit both passes in your applications.
The main advantage of two-pass reporting is that your reports can include expressions that rely on information available anywhere in the report. For example, placing a control with the Sum() function in a header or footer means that Access will use the first pass to accumulate the data required by the function, and then use the second pass to process the values in that section before printing them.
Another obvious example is putting an unbound text box in the footer of a report containing the following expression:
="Page " & [Page] & " of " & [Pages]The built-in Pages variable (which contains the total number of pages in the report) isn’t determined until Access has completed the first pass through the report. On the second pass, Access has a valid number to use in place of the Pages variable.
The biggest advantage of two-pass reporting is that you’re free to use aggregate functions that depend on the report’s underlying record source. Group headers and footers can include information that can’t be known until the entire record source is processed.
There are many situations where aggregate information provides valuable insight into data analysis. Consider a report that must contain each salesperson’s performance over the last year measured against the total sales for the sales organization, or a region’s sales figures against sales for the entire sales area. A bookstore might want to know what portion of its inventory is devoted to each book category.
Figure 21.41 shows such a report. The Number of Customers, Total Sales, and Average Purchase information at the top of this report (rptSummary) are all part of the report header. In a one-pass report writer, the data needed to perform these calculations would not appear until the bottom of the page, after all the records have been processed and laid out.

Figure 21.41 The summary information is part of the report’s header.
A glance at rptSummary in Design view (see Figure 21.42) reveals that the text boxes in the report header are populated with data derived from these mathematical expressions:
Number of Customers: =Count([CompanyName])
Total Sales: =Format(Sum([Purchases]),"Currency")
Average Purchase: =Format(Sum([Purchases])/ _
     Count([CompanyName]), "Currency")
Figure 21.42 rptSummary in Design view.
The Count() and Sum() functions both require information that isn’t available until the entire report has been processed in the first pass. As long as Access can find the arguments provided to these functions (CompanyName and Purchases) in the underlying recordset, the calculations proceed without any action by the user.
Assigning unique names to controls
If you use the Report Wizard or drag fields from the Field List when designing your reports, Access assigns the new text boxes the same names as the fields in the recordset underlying the report. For example, if you drag a field named Discount from the Field List, both the Name and ControlSource properties of the text box are set to Discount.
If another control on the report references the text box, or if you change the ControlSource of the text box to a calculated field, such as:
=IIf([Discount]=0,"N/A",[Discount])you’ll see #Error when you view the report. This happens because Access can’t distinguish between the control named Discount and the field in the underlying recordset named Discount.
You must change the Name property of the control to something like txtDiscount so that Access can tell the difference between the control’s name and the underlying field.