
Future Trends in the Gas Turbine Industry
Abstract
The future of gas turbine systems design development and the gas turbine business is steered by several factors. Business and political factors are a far greater influence on technology than the average engineer feels comfortable acknowledging. The major change in the gas turbine and gas turbine systems industries over the past several years has been the changes in turbine fuels strategy. In the power generation and land-based turbine sector, coal has lost its “number 1” place in the USA, due mostly to the advent of natural gas fracking exploration and production. Coal still remains number 1 in countries like China and much of Eastern Europe, because of those countries huge coal reserves. Oxy-fuel combustion potentially can be used in plants based on both conventional and advanced technology. Studies have shown that plants equipped with oxy-fuel systems could reach nominal efficiencies in the 30% range with today’s steam turbines when fueled with natural gas and when capturing the CO2. With anticipated advances in gasification, oxygen separation, and steam turbine technology, plants using oxy-fuel systems are expected to achieve efficiencies in the mid-40% range, with near-100% CO2 capture and near-zero NOx emissions.
Keywords
Oxy-fuel combustion; NOx emissions; design development; coal technologies; oxy-fuel systems; natural gas; carbon capture
“I am enough of an artist to draw freely on my imagination. Imagination is more important that knowledge. Knowledge is limited. Imagination encircles.”
—Albert Einstein
The future1 of gas turbine systems design development and the gas turbine business is steered by several factors. Business and political factors are a far greater influence on technology than the average engineer feels comfortable acknowledging. The reader is advised to read this chapter in conjunction with Chapter 14 on business.
What will steer the global scene in the gas turbine industry today?
There may be many answers to that question, however perhaps the most significant change in the gas turbine and gas turbine systems industries over the past several years, since I wrote and edited the first edition, has been the changes in turbine fuels strategy. In 2007 I wrote “A quick look at the world in 2007 indicates that oil and gas will continue to fuel the engine of global growth.” That referred primarily to power generation, still the world’s largest industry by far. In 2014, that is still true, but the details inherent within the fuel use chart, in specific countries such as the United States, have altered. In the power generation and land-based turbine sector, coal has lost its “number 1” place in the United States, due mostly to the advent of natural gas fracking exploration and production. Coal still remains number 1 in countries like China and much of Eastern Europe, because of those countries huge coal reserves.
Some Newer Technologies
Coal Fuel Combustion Related
This is an appropriate point at which to mention two areas of newer development with respect to coal being used as a fuel in gas turbines: oxy-combustion and hydrogen turbines.
Illinois’ new FutureGen project will now feature oxycombustion (not IGCC as originally planned).
Oxy-fuel combustion potentially can be used in plants based on both conventional and advanced technology. Studies have shown that plants equipped with oxy-fuel systems could reach nominal efficiencies in the 30% range with today’s steam turbines when fueled with natural gas and when capturing the CO2. With anticipated advances in gasification, oxygen separation, and steam turbine technology, plants using oxy-fuel systems are expected to achieve efficiencies in the mid-40% range, with near-100% CO2 capture and near-zero NOx emissions.
In the near-term, efforts are focused on the development of oxy-fuel turbine and combustor technologies for highly efficient (50–60%), near-zero emissions, coal-based power systems.
Hydrogen Turbines
With hydrogen turbines, turbine systems and components targeted for improvement include combustor technology, materials research, enhanced cooling technology, and coatings development. These technologies are considered key components of FutureGen, which will use technology developed from the core R&D program, including Advanced Turbines, to build and operate the world’s first near-zero emissions power plant that will produce electricity and hydrogen from coal while capturing and storing CO2 through sequestration. It is intended that the successful prototype would be a model for other near-zero emission coal plants that can produce electricity at no more than a 10% increase in cost over a conventional plant, and produce hydrogen at $4/million Btu (wholesale).
Fracking
Natural gas fracking as a process incorporates what could be technically sound technology. Whether it actually is practiced as such, is another matter however. It is often cheaper for oil companies to employ small contractors to conduct elements of the fracking process: the drilling, the explosions to create fissures in the gas-carrying rock, the water injection, the collection of waste water and the dumping of waste water. Small contractors may be less concerned about their corporate image or liability profile than major oil companies. Therefore, working the Marcellus shale in Pennsylvania, for instance, may yield waste water containing poisonous toxins, that some unnamed operator may haul to and dump in New York state, at such times as New York state law does not restrict them from doing so (and Pennsylvania’s does).
Media footage that shows water “catching on fire”2 has attracted the attention of the general public. One of the filmmakers (Josh Fox) who featured that type of event in his film admitted later that he knew the water could have been set alight with or without the neighboring fracking drill probe. In other words, the earth is a seismic place and natural gas occurs not just within rock formation but also at the junction of rock seams. Seismic disturbances, man-made or natural, can result in the natural gas migrating to a point where the gas dissolves partially in ground water.
The truth about fracking “done responsibly and well” or fracking “that causes a public hazard,” must therefore be decided on an individual basis. With oil companies chasing themselves to pay (unseen horizontal) drill holes through land, that may include housing developments, the time to assess the “after drilling” results (other than meter the gas produced) may not always happen.
Drilling sagas notwithstanding, natural gas from fracking burns in a gas turbine, much as conventionally produced natural gas does. The emissions do not alter appreciably in terms of the gas undergoing combustion in a gas turbine.
Improvement of Established Technologies
Steam turbines are significant in the gas turbine industry for two main reasons. First, development of higher efficiency steam turbines can, in some cases, discourage the use of gas turbines that can employ coal fuel, but using newer technologies, such as those discussed above. Second, higher temperature steam pushes the advancement of boiler materials. Even if the boiler is a relatively large one for a steam-only plant, this will benefit the boilers used in gas turbine CC operation.
Supercritical steam has been around since the 1950s, but USC (ultrasupercritical steam) has become the “norm” for many coal fuel users. Now researchers and manufacturers are exploring AUSC (advanced ultrasupercritical) steam.
Ultrasupercritical Steam
OEMs and research are taking the steam turbine towards ultrsupercritical steam (steam in excess of 700 degrees Celsius). Metallurgy is developed, often by government agencies, such as the US DOE or OEM’s given a grant (by the US DOE in the United States or the EU in Europe). See the appendix on steam turbines in Chapter 4.
Supercritical Steam
Higher temperature steam gives a power facility more heat to extract than lower temperature steam. Supercritical steam plants have been able to attain efficiencies of about 42%, based on LHV of the coal fuel used versus about 31% with some conventional steam and single-cycle gas turbine stations in existence. Condensing turbines extract the most possible heat from the steam. Reheat, single cycle or otherwise, is used to help attain supercritical steam conditions.
For instance, Shidongkou, China’s first supercritical steam plant has 2600 MW units and uses single-cycle reheat steam and condensing steam turbines to attain 42% thermal efficiency. This is a steam-turbine-only plant, but it illustrates that coal derived steam would work as well with a combined-cycle steam turbine. Put another way, for the same coal input, if the heating surfaces required in a subcritical boiler total 24,100 square meters, the figure for a supercritical boiler would be 15,810 square meters. (Also, if the boilers were the same 12 meters in diameter, the subcritical one would be about 10% taller.) These figures directly affect efficiency and thus fuel consumption and emissions in both combined-cycle and steam-turbine-only applications.
The cost of power production not counting environmental equipment is typically 5% lower for a supercritical steam plant versus an only-steam-turbine plant. With environmental equipment factored in, this percentage rises, depending on the environmental equipment required.
Efficient Steam Turbine Condensing
Because a condenser can seriously affect the back pressure on a turbine, its efficiency can considerably alter a plant’s overall efficiency (and therefore its fuel consumption). For instance, for a condenser backpressure of 45 mbar where, in a specific plant 3 MW electrical output power is “gained,” the corresponding “gain” for 80 mbar is 1 MW and for 115 mbar, 3 MW are lost.
Note also that it is important to the environment that cooling water be “returned to nature” as cool as possible, so condensers also have a direct effect on the environment.
Removal of Emissions After They have been Produced
After the fuel (coal, oil, distillate, or gas) has been burned, there are SOx, fly ash, and particulates, NOx, as well as dioxins and heavy metals, to be removed. Separate systems can handle each of these or combination solutions can be sought by a power company, depending on the plant configuration.
CO2 is vastly more expensive to remove from solution (after it has been produced) than to limit its production in the first place. The latter is done by raising cycle efficiencies to reduce the fuel burned.
Fuel System Variables and Versatility
Regardless of the emissions reduction method, the variables involved include type and grade of fuel and external atmospheric conditions.
As coal is gas’s greatest fuel rival, progress with coal fuel and steam turbines directly affect the gas turbine business. Fuel quality affects how “good” the coal is. Consider, for instance, the following grades of boiler coal used in China:
Source/Grade/LHV (lower heating value) in MJ/kg/ash % by weight.
Jiangxi/Anthracite/24/19
Datong/HV (high volatile) bituminous/28/13
Kailuan/HV bituminous/13/41
Hebi/LV (low volatile) bituminous/28/16
Shulan/brown/12/30
Although all these coals contain roughly between 1% and 2% of sulfur, the furnace, boiler, and associated environmental equipment for each obviously differ greatly, as does the thermal efficiency (amount of fuel required per unit of power).
Original equipment manufacturers use a combination of techniques for NOx reduction, each with their own trade name. Alstom’s, for instance, include a technique they call tangential firing (TF), which uses dedicated fuel and air compartments; TF with overfire air (OA), which subdivides the combustion air to reduce the excess oxygen provided and thus retard NOx formation; and low NOx concentric firing system (LNCFS). The latter is an extension of TF with OA as it delays the secondary air from mixing with the fuel.
Several OEMs now make trifuel burners, which are important with the fuel versatility required especially in newly industrializing countries. Mitusi Babcock’s trifuel burner, specifications for which claim below 10 ppm NOx formation minimum, have been retrofitted in Castle Peak, Hong Kong, a station owned by China Light and Power.
Carbon Capture
Carbon capture is a challenging and expensive prospect and increasingly countries are pooling their resources to improve current technology. China and the U.S.,3 which together burn more than 40% of the world’s coal, have agreed to jointly develop technology to capture carbon dioxide from power plants and take other steps to combat climate change. The agreement came during the U.S.-China Strategic and Economic Dialogue that started today in Washington. Talks are hosted by Treasury Secretary Jacob J. Lew and Secretary of State John Kerry and include counterparts Vice Premier Wang Yang and State Councilor Yang Jiechi.The two nations will implement “large-scale, integrated” demonstration projects aimed at capturing, utilizing or storing carbon dioxide, according to a statement released by the U.S. State Department. “These demonstrations will engage companies in both countries and allow for enhanced trade and commerce.” The countries will also work together to lower emissions from heavy-duty vehicles, increase energy efficiency in buildings and improve greenhouse gas data collection, according to the statement. Implementation plans for those targets will be ready by October, according to the statement.
Technologies that Reduce Required Infrastructure
Offshore platforms and underwater pipelines continue to be the primary means of tapping undersea petroleum based resources. That could change in the future. In 20174, the world’s largest floating gas factory for producing liquefied natural gas will go to work, north west of Australia. The “ship” does not power itself, it has to be towed, then moored. However, unlike offshore platforms, the Prelude can be moved after it has worked the Prelude field for an estimated 25 years. The project is a joint brainchild of Shell (who owns the Prelude field being tapped), Samsung and Technip.
Distributed energy is an effective way to reduce otherwise required infrastructure. The microturbine market, which can accept a wide range of fuels, including biomass, without the need for power transmission lines, is a good example (see Chapter 16).
One of the newer candidates being developed produces gas(Aeous fuel from waste5 (process belongs to Green and Smart Sdn. Bhd.) using an anaerobic digester to burn in gas engines made by GE. Local bamboo and wood will be the feedstocks. Not all gaseous fuel engines are gas turbines (as microturbines are): some of them are piston engines. However, when machinery increases a country’s distributed energy potential, that will affect the gas turbine market.
Resultant Energy/Fuels Usage Chart
The U.S. Energy Information Administration (EIA)6 has released its International Energy Outlook 2013. It projects that world energy use will climb 56% by 2040. That rise will be driven by growth in the developing world, including increased prosperity in China, according to the report. World net electricity generation is expected to increase by 93% by 2040, increasing from 20.2 trillion kilowatt hours in 2010 to 39 trillion kWh in 2040.
Renewable energy sources will be the fastest growing sources of electricity generation, increasing by 2.8% per year from 2010 to 2040. Natural gas and nuclear power are expected to be second-fastest growing sources of generation, increasing by 2.5% per year.
Coal-fired power generation is expected to remain the largest source of world power generation through 2040 despite increasing by an annual average of 1.8% per year, although the EIA notes the outlook for coal could be changed considerably by any future national policies or international agreements aimed at reducing or limiting the growth of greenhouse gas emissions. The EIA projects total world coal consumption to rise at an average rate of 1.3% per year.
The EIA notes that China, the U.S. and India are expected to account for around 75% of global coal usage in 2040, an increase from the 70% the three countries use in 2010. China is expected to account for around 55% of global coal usage in 2040, while the U.S. is expected to use around 9.2% and India around 10.2%.
About 80% of the increase in renewable power generation is expected to come from hydropower and wind power. Of the 5.4 trillion kWh expected to be added by 2040, 52% is expected to come from hydropower. 28% is expected to come from wind power projects.
The EIA also looks at world carbon dioxide emissions, projecting that total emissions will increase from 31.2 billion metric tons in 2010 to 36.4 billion metric tons in 2020 and 45.5 billion metric tons in 2040 for a total increase of 46%. Coal is expected to account for 20.6 billion metric tons, or around 45.3%, of CO2 emissions in 2040, while natural gas is expected to account for 10.1 billion metric tons, or around 22.2%, and liquid fuels are expected to account for 14.7 billion metric tons, or around 32.3%.
Europe tends to be more proactive in renewables technology if there is funding to support their efforts. Renewables have already started to have an effect on small sections of the global gas turbine market as the following example indicates.
E.ON7 announced idling of its 430 MW gas fired Malzenice plant in Slovakia, citing market conditions, in July 2013. Recntly EnBW announced the closure of four of its plants for similar reasons. E.ON SE said the move was prompted in light of low electricity prices. The Malzenice combined-cycle gas turbine was only commissioned less than three years ago at a cost of $522m. The German utility blamed the proliferation of renewable energies across vast parts of Europe for the decision to shut down the power plant as well as muted energy demand in an economy that is stagnating at best. E.ON said that the Malzenice plant operated for only around 5,600 hours, adding the plant is designed to produce power at least 4,000 hours to 5,000 hours per year.
Smart Grid
The power grid in the United States is about 100 years old. It delivers 1 million megawatts of generating capacity, along 200,000 miles of high voltage transmission lines and 5.5 million miles of distribution lines.8 It is however, an old outdated system that is not very clean environmentally.
In 2007, power plants in the United States emitted 2,500 million metric tons of carbon dioxide; total CO2 emissions nationwide were 6,022 million metric tons, 75.9 million more than in 2006.9
The United States’s electricity consumption is estimated to increase by 41% by 2030. All forms of fuel, renewable and fossil will be used to fill this gap. Renwables have the disadvantage that they do not produce power at a consistent constant rate.
Recent years have seen the initial construction in the United States of what it will take to finally place renewable energies in a competitive position with respect to the rest of the fossil fuel family: the smart grid. Basically this transmission grid offers high voltage transmission, ensuring that power generated, sometimes intermittently, by power generation sources like wind and solar, will be added to the “power available” mix. The customer can still be charged a price that reflects if the power he has chosen includes more expensive renewables.
This is very good news for the green crowd in the United States. I say “in the United States” because smart grids are not new and other countries are already comfortable with them. One might expect that with sophisticated European countries like Denmark, with their 50% overall wind generation mix, but those countries also include China.
There are enough renewable energies in the world that it could free itself of fossil fuel dependence in several decades, any time it chose to initiate that progress. However, using renewable, particularly in the United States, requires the development of several budding technologies, and large oil interests not hiding the successful ones they already bought out. The technological tone for the developing world is set by the United States for the most part, and the United States policy is set by lobbyists, who are frequently powerful enough they can threaten senators and congressional representatives with nonelection “the next time.”
Transmission and Distribution Technology Improvements
Some of the easier items to address in the drive for greater efficiency involve retrofitting modern transmission and distribution equipment, including:
• Reactive power compensation equipment, such as static var compensators
This requires administrative involvement mainly on a national level and less of the international technical involvement that revamping of the power plant machinery often needs. Action items here, among others, are:
• Improvement of training procedures to reduce outages and inefficiencies not due to equipment
• Review of the incentive system for SPPs
• Incentives added for SPPs, as these can take up the bulk of a demand curve’s peaking load in a mature economy
• Review of the transmission system available to take an SPP’s contribution to the national grid. Countries like Thailand offer SPPs incentive but their contribution is limited by transmission line size.
• Consideration of the location and performance of substations, although this is best done at design time. For instance, the IPP plant at Kuala Langat, Malaysia, is situated close to one of the national power company’s substations as well as next door to the mill that receives some of its steam
Fuels and their Emissions
The gas turbine is now a rather mature animal. Changes that result from its use in land, sea, and air applications result from growth of core engine technology (to produce larger power plants or fill a customer’s requirement), innovative repair developments, improved metallurgy and materials strategies and optimized electronic controls, instrumentation, and diagnostics to some extent.
The area of change that may produce more development than the other areas is that of fuel selection and emissions control. Both those two players, fuel and emissions, are frequently run by politics and economics. Consider the following figure.
Competition among fuels for power generation driven by changes in fuel prices.10
Technology aside, China, India, and Indonesia (collectively more than half the world’s population) have large reserves of coal and access to cheap residual oil that the Middle East is happy to sell. Based on the needs of their swelling population and economic growth, it is likely these giants, all their Asian neighbors, and the countries of South and Central America will change their overall required-fuels mix.
That said, in fairness, China has shown a great eagerness to keep up with the frontrunners in new technology. Even though she might continue to use her old coal plants for instance, China is extremely advanced and proactive in areas that include IGCC, for instance. China’s boiler technology (for GT CC or otherwise) is the best because she has worked hard on ultra supercritical steam with her own steam turbine manufacturers.
Fossil fuels will continue to reign supreme for probably the next 30–40 years, with renewables making a small but growing dent in the fuels pie. Certain proactive countries, like Brazil, justifiably concerned about their rain forest and its people, have developed an alternative to “big oil:” ethanol made from homegrown sugar cane. They are now energy independent. Note that the sugar cane ethanol produces about 8:1 times the energy required to produce it. With U.S. corn ethanol production, the ratio is 1:1.
The corn lobby in the United States is a strong one, however. The corn growers make more money with the ethanol train than they do selling the corn as food. Less food in the pipeline generally also mean some poor people somewhere go hungry.
Whatever happens, the gas turbine is going to be around for a very long time and will continue to improve efficiency, either on its own or in concert with cogeneration adaptations. It will continue as large conventional utility models or distributed energy size microturbines. It will burn an increasing number of fuels.
Those fuels, as we saw earlier, include gasified coal or syngas (IGCC); and the coal oxy-combustion process. Finally, the world has reached consensus that a greenhouse gas like carbon dioxide that collects, like a giant spherical sock just below the stratosphere, will warm up our planet. When that happens, the warming is not even, so climate change results: “We have more rain and didn’t need it,” “we have worse storms, who needs those,” “Our desert is growing maybe we ought to go to war for water next.” The United States held out on signing Kyoto, but now is doing all kinds of things, some of them strange (like burning natural gas instead of coal in ancient steam turbines), to bring down its level of carbon dioxide emissions.
Carbon storage and sequestration therefore now takes a prominent position in the United States, as it already had in countries like Norway (in their North Sea fields). This is particularly evident in projects such as Future Gen (which will be built in Illinois).
California is more proactive than the rest of the United States with respect to the environment, and is struggling to allow renewables to take over from fossil fuels in the state. If any state could pull this off in the United States, it is likely to be California. When California succeeds, this could create a model for some states, but much depends on a state’s individual culture. The study at the end of this chapter (authored by the California Environmental Council) has been shortened in this edition, (Case Study 1 in the previous edition), as some of the parameters the study used have altered, however elements of the study may still be of interest to the reader.
The oil and gas lobby is very strong in the United States. The oil and gas “fuel share” in the gas turbine sector, may fluctuate now and then, but may not alter appreciably in our lifetimes. Although 2013 saw an increase in natural gas prices in the USA, the fracking trend may outweigh any gains made by the coal gasification lobby in the USA.
Future Business Trends
The gas turbine’s technological progress depends on money just as much as it does human intellect. Without money no turbines are bought, no installations completed. Without actual sales and project investment, there is no working experience to affirm designs, point the way to improvements, or provide a “real-conditions test run” for validating a new feature. However, in turn, money does not “happen” without the right politics, international or domestic infrastructure, or trust among international original equipment manufacturers (OEMs). Therefore part of this chapter is devoted to explaining the business and financial climate in which gas turbines attempt to progress and prosper while maintaining legislated environmental requirements.
Those basic factors remain essentially unchanged in this second edition. Business acumen can add credibility to the text of “request(s) for funding.” A large part of that today is political correctness, which today includes “green awareness” in the United States. There is currently a demoncrat in office.
The gas turbine’s future is also dictated by the size and growth of the different industrial sectors that use gas turbines. Today, in order, those are power generation, energy production (including oil and gas), aviation (commercial, military, and commuter), marine (ferries, frigates, and other naval ships; cruise liners), and small (domestic, cars) use.
The order in which relevant factors affect the business and their relative importance depend on the demographic circumstances and how they work in concert.
The following factors are the main ones that affect the future of gas turbines in the short (up to 5 years), interim (the next 15 years), and long term (over 15 years).
1. Changing tides (financial, political, legislative, or technological) in the world, including:
(a) Advantages afforded certain practices because of political favors. The gas industry lobby may be more astute than many with respect to legal positioning. Consider one clause in the U.S. Federal Energy Policy Act of 2005.11 This bill exempts fluids used in the natural gas extraction process of Hydraulic fracturing from protections under the Clean Air Act, Clean Water Act, Safe Drinking Water Act, and CERCLA. It creates a loophole that exempts companies drilling for natural gas from disclosing the chemicals involved in fracking operations, normally required under federal clean water laws. The loophole is commonly known as the”Halliburton loophole” since former Halliburton CEO Dick Cheney was reportedly instrumental in its passage. The proposed Fracturing Responsibility and Awareness of Chemicals Act would ordinarily repeal these exemptions.
(b) The recession that started in the United States around 2008 brought about the demise of several development and research programs. Programs like FutureGen, now being constructed, were in holding pattern for years. The EEC did not escape lightly either. Siemens was awarded the EEC grant to work on higher temperature steam turbines, only to have their funding placed on hold.
(c) The change in priorities caused by wars. Although the Iraq war is over and plans are underway for the USA to pull its troops out of Afghanistan, war creates business alliances and dependencies that can last for decades after military conflict ends. Things get scarce in war-torn countries. The Iraq rebuilding efforts saw a surge in the market for “excess” and “mothballed” equipment lying around.
Companies that service the military look forward to better business when unrest in the Middle East or elsewhere erupts.
(d) The constant drive for profits. Many gas turbine and gas turbine service industries have undergone reductions in work force, with many of the casualties being engineers who work on gas turbine system optimization or related items.
(e) Global deregulation within the power generation business, the changing mix of IPPs (independent power producers), SPPs (small power producers), and MPPs (merchant power producers).
(f) The escalation of technology for distributed power and small power plants that will run a small farm, factory, and even a household.
This refers in part to microturbines in microturbines in hybrid application (with fuel cells or otherwise). The recession that came to roost at the end of the George W. Bush era and persists through 2013 is responsible for little progress being made in terms of further commercialization of these technologies. For instance, the cost per kilowatt for a fuel cell has not dropped appreciably.
Small companies that sell mini-wind turbines or photovoltaic generation systems maintain reasonable sales and survive, if their overhead is not too high. Legislation with local or state governments can help, if for instance, laws make it illegal for neighborhood associations to disallow installation of solar panels on roofs. This has happened in certain states within the United States. Also tax rebates, federal and state have been stepped up in some cases, to reward the installation of distributed renewables with households and businesses.
(g) Global business trends including international trading blocs, resource conservation, and financial crises. The United States’ recent recessions (the one prior to 2006 and the one after 2008) has cost many small companies dearly. Some promising technologies have been significantly compromised. One such player has been the turboexpander industry, where the few remaining players either joined forces or have gone under.
(h) The progress of large rival (rivals of fossil fuel) power technologies (including nuclear) and growing rivals (like wind and tidal power).
(i) The progress of support technologies to the small (or large) growing rivals, such as the development and construction of smart grids.
(j) Natural disasters in major financial center areas, like potentially a mega tsunami on the United States east coast or a crippling earthquake in Tokyo or on the U.S. west coast. Tokyo’s recent nuclear crisis caused Japan some severe hardships.
2. Environment related factors, including environmental legislation and national and international caucuses (such as Kyoto, Montreal, and Rio) and the technologies and priorities they promote.
3. OEM growth and diversification, particularly:
• OEM acquisitions, joint ventures, licensees, and resulting technological transfer
• OEM business affairs, including production backlogs and vendor alliances
• OEM technological research and development as well as support by and for government programs
• Significant (OEM or government agency funded) technological breakthroughs that will revolutionize the state of the industry
• Performance optimization trends in system or component design
4. OEM financial failures: sometimes promising new technologies are delayed in their progress due to conditions that include the recent economic crisis in the United States. A company called Catalytica that made flameless, ultra-low NOx combustors was one player that did not survive the onslaught.
5. The effect of powerful gas turbine or end-user lobby groups. For instance:
• Sugar cane ethanol (Brazil’s variety) is better for the environment than corn ethanol (which the United States plans to make), by an energy return for energy input ratio difference of 8:1. However, if the corn lobby is stronger than the sugar lobby in the USA, corn ethanol will still be made.
• What’s the use of developing heat pumps that use solar energy trapped in the ground (free) if you lack the muscle to force legislative subsidies that would make that product an affordable option?
• Why would you develop alternative energy technologies that could curtail much of the dependence on fossil fuels if you have no lobby to promote them? Actually, there is a good answer to that one. You develop it and then wait for an oil company to offer you millions to buy it, so it can stay “off the shelves.”
6. E-trading of energy (fuel), power (kW), emissions credits, and gas turbine spares.
7. New and unconventional fuel resources.
8. Distributed power: How large does a power plant need to be?
The short- and medium-term future of gas turbines will be largely dictated by the success of the OEMs in terms of their technology. Their business strengths will be dictated by all these factors and can change their finances over decades or in the short term. Further discussion on how the above eight factors can alter the course of the gas turbine world follows.
The Agents of Change
Politics
The lead time for a new gas turbine after production begins, is frequently upward of two years, so the beating the market takes when political unrest on a global scale occurs, is evident. That the major OEMs will survive the fray and be ready to meet the surge in orders, which reinstates itself after power generation development lags growth in GDP, is a given. Many small systems suppliers who survive from monthly order to monthly order may not be that fortunate. The small businesses that will thrive in all circumstances are those that the OEM needs for day-to-day business, such as repair shops that complete piecework the OEM does not want to spend liquid capital on support “in house.” Niche suppliers of specialized instrumentation, such as optical pyrometers, that are required for design development and operational investigation probably always will have enough business to maintain their overhead.
War will see some resurgence of orders. Rebuilding Iraq was one example. Current unrest in the Middle East, suggest that history may repeat itself. This may not always mean new gas turbine orders, though, due to the lead times involved. A service industries acquaintance mentioned several gas turbines ordered for Iraq that were “existing, old.” Several of these packages are all over the world, collecting dust because the customer “cancelled the order.” The already industrialized countries would not likely buy older models if they can afford to wait for the latest ones. However, a nation now officially out of Iraq while keen to be seen doing everything it can to rebuild that county’s damaged infrastructure is likely to buy “what still works.” In many cases, these old gas turbine packages were never installed, so they are operationally “new” (zero time).
Aviation as Affected by Politics
Commercial flying has seen a turndown due the events in global politics. The result has been felt all through the chain: airline to aircraft manufacturer to aircraft engine OEM to the OEM’s employees (layoffs and early retirement packages).
The military engine market saw more activity as recent politics revived some hitherto temporarily neglected military aviation programs. Not that this would necessarily help the progress of gas turbine technology as a whole, however. In the last 20 years, the level of technology with commercial aircraft engines crept ahead of their military engine counterparts. In short, at the turn of the century, war and political unrest essentially do little or nothing to promote gas turbine technology (as different from the second World War, which did much to pave market entry for the gas turbine).
Marine Sector
Gas turbines in commercial marine applications is a relatively new field and activity here has stayed steady. Installations on cruise ships and ferries increase.
Gas turbines in military marine applications (like the U.S. Navy’s LM2500 fleet) continues to stay an active business. GE, the OEM on this model, is one of the US military’s largest contractors. The very size of the LM2500 fleet promotes further sales, including applications in the non-military sector. The LM2500 fleet in North Sea offshore operations is a large one.
Land-Based Applications
Earlier in this chapter, I discussed the growing profile of coal in the gas turbine world. Technology’s direction with coal gasification advances and CSS will promote that.
Any niche-technology system that saves money was given a gracious hearing as oil soared above $70 a barrel in 2006. Not all the new players that this produced still survive today. The commercial industry still scrutinizes expenditures and overhead, cutting back on attendance at trade shows, perks, and even the corporate commuter jet fleet.
Meanwhile the government-sponsored programs for fuel cells, hybrid systems, the oil-free large gas turbine engine program and microturbine CHP systems continue steadily. Government sponsorship, via agencies such as the U.S. DOE continues, even if private industry contributions diminish.
Legislation, Financing, and Business Models
Global Deregulation in Power Generation
The largest economic sector in the world today is power generation. Oil companies now realize that they are prudent to get into the business as independent power producers and become their own best customer for their oil, gas, as well as nonconventional energy and fuel production. Smaller process and petrochemical plants decide to join in the fray, particularly if their incentives include:
• A potential fuel source that ordinarily would be a waste by-product in their process
• Tax incentives to become power producers
Gas turbine manufacturers such as Alstom stabilize their portfolios by buying major shares in mega-sized power companies. Alstom’s share in the Midlothian power plant was a case in point.
Government regulations everywhere are changing in terms of deregulation of the power business, environmental regulations, fair competition laws, and trading bloc requirements.
Smaller “guerilla” business units, termed merchant power producers, rent or buy stationary or portable turbine packages to supply power for what may be a limited period of time. They generally are short on permanent assets and technical expertise, but they nip persistently at the heels of large IPPs and national utilities, generally for quick profits before they vanish altogether or go to a different location.
IPP candidates have no shortage of countries that would be willing to receive their investment dollars. The catch then is to estimate gains both monetary and otherwise and the work involved beyond that of designing, building, and operating a power plant. What follows could never be exhaustive from a perspective of global IPP activity, but it does illustrate the main features of the IPP market, with particular reference to the continent of long-term maximum potential power demand growth—Asia.
Who and Where Are the IPPs?
The answer to this question is becoming infinitely more complex than it was only 10 years ago. The acronym IPP used to refer to firms that existed for the sole purpose for investing in and building power plants then selling the power to a national governing body. It still does, except the IPP ranks are swelling to include “small” power producers (SPPs).
Small producers include large industrial entities, such as refineries and manufacturing plants, that buy their own power production machinery (generally to avoid expensive brownouts or outages) and make their own power. In some countries, they sell their excess power back to the national grid. The limits of this sale generally are set by the size of the distribution lines available. This small power producer generally gets less of a tariff for its power than it pays for national grid supplied power. As such power producers increase, they lessen demand growth and therefore the required size of new large power plants.
IPP ranks are further being swelled by IPP joint venture companies, which can have as a major or controlling interest partner one of the turbine manufacturers, such as Alstom, Siemens, or GE. Interesting variations on a theme of joint ventures can be arranged contractually with OEMs. Consider the case of Malaysia. ABB (prior to being part of Alstom) made a turnkey delivery and transfer (BOT: build, operate, and transfer) arrangement on the Kuala Langat plant with the Genting Corporation and the Lumut plant with Segari Ventures. GE (General Electric) had a turnkey arrangement with the power plant owned by the Port Dickson group. The 51–49% joint venture that Siemens Westinghouse has with the YTL Corporation has Siemens the controlling partner. In the latter project, the number of Siemens and other expatriate staff will slowly dwindle to zero six years after commissioning. The national goodwill created by firms that assist newly industrialized countries (NICs) with attaining financial independence is immense and hard to measure.
Options for IPPs
• Build, operate, and own (BOO). The developer builds, operates, and owns the plant for its entire life. This owner generally secures a PPA (power purchase agreement) and a fuel purchase agreement before commencing construction.
• Build, operate, and transfer (BOT). The developer builds and operates the plant for a contractual number of years. Then, the plant is sold to another authority, often a government department or agency after that time.
• Repower (replace steam with gas or combined-cycle turbines)/refurbish, operate, and transfer (ROT). In these contracts, the developer may operate the plant for as long as it takes to recover its investment plus a designated profit margin. Another firm or government agency retains ownership of the plant.
• International purchase. Especially when caught in the crisis of unexpected growth, countries resort to the emergency strategy of buying power from a neighbor. Malaysia, in its early 1990s shortage crunch, bought power from Singapore. Malaysia sells some power to Thailand. Whom the power contract is with may have something to do with desired national fuel resource conservation policy. For instance, both Thailand and Singapore would like to buy a great deal more gas than Malaysia currently sells them. Why do some gas-rich countries “hoard” their gas reserves? Possibly because they are aware that any artificially low prices for natural gas will give way to larger profit margins in some years (enough to outdistance the diminishing value of unit currencies).
SE Asian Currency 1990s Crises and Subsequent Recovery
Currency problems in the late 1990s sent SE Asian currencies tumbling. Recent economic woes in the United States have allowed many currencies in and beyond SE Asia to recover much of that lost ground. However, the bottom line is that IPP investments generally yield 18–20% long term.
Overall Asian Investment
The number of IPP opportunities in Asia is immense—bigger than anywhere else in the world. Even once the current economic hassle sorts itself out, the catch is getting financing, and that depends on where the project is and what incentives or drawbacks go with the location.
Any global IPP scene summation must include China, the highest power demand growth area in the world, with India and Indonesia as close seconds.
China has potential investors wary for many reasons, which go beyond any current economic crisis. The Chinese frequently offer 16% ROI (return on investment). It took much gut wrenching to get it up from 13%. Other countries offer between 18 and 20%. Attractive, if their currency is stable.
Older problems in China include a non-globally traded currency, although moves have begun to slowly change that. The currency also carries some devaluation uncertainties. Tariff pricing issues are a further stumbling block.
Major drawbacks with development in India have been the lack of infrastructure and government corrupt practices. Consider though that “corrupt” is often in the eyes of the beholder. “Baksheesh” is a way of doing business in many countries and frequently Anglo-Saxon cultures (other than those restricted by the U.S. Corrupt Practices Act) just pay the “expediting fees” and do business.
All the main turbomachinery players—Alstom Power, GE, and Siemens Westinghouse—are in India, each with a long-term agenda in the power generation industry. GE arrived late, behind its traditional rivals, but its agenda is ambitious. As are Alstom’s (separately ABB and GEC Alstom when they first entered India) and Siemens Westinghouse’s (Siemens when they first entered India). GE picked a variety of local firms with relevant expertise to joint venture with for market entry. Siemens came in through Siemens India, and ABB came in alone.
India does not smile on 100% foreign ownership or joint ventures in non-high priority industries. Political waves have meant a great deal of stalled legislation and project approvals, even in critical industries such as power. As of 1995, however, the way was cleared for the first few “fast track” power projects. Support industries, such as telecommunications, have been opened to privatization, which helps add overall economic momentum.
Latin (South and Central) America
Global unrest due to situations and conjecture in Israel, Iraq, North Korea, and Afghanistan notwithstanding, some Latin American countries always experience their share of internal unrest. The responsible factors include politics, military coups, vandalism by guerrillas, drug cartels, poverty, and in Columbia for instance, “a culture of nonpayment among our clients.” Also someone like Venezuela’s Hugo Chavez can affect the United States adversely by tightening his country’s oil exports.
Other factors include slow progress of the privatization process and waste of power in an ineffective transmission system (as high as 29% at one power company in Columbia).
The Latin American countries are struggling to rebuild their infrastructure despite all handicaps. Large OEMs have the deep pockets to wait out the period it takes to get recoup their investment.
Africa
The situation is similar to that in Latin America, exacerbated by worse poverty and disease. Nonetheless, development of industry and power generation continues, particularly in countries such as Nigeria that have oil resources. Certain countries have proved to be models of relative stability, such as Ghana and Tanzania. South Africa.
Gas turbine-related development, however, is unlikely to reach the per capita levels currently prevalent in India and China in any foreseeable timeframe.
Global Financing Agencies
The capital available for and invested in a project ultimately gives gas turbine systems and technology the proving ground they require. With the world’s drastically changing economy bringing turmoil and political disarray, some of this finance is in short supply. The basic methods of raising it essentially are the same and deserve short mention. This subsection will make constant mention of China and India. This is logical, as the countries collectively hold about half the world’s people. Neither country is exactly devoid of unrest. However, both populations demonstrate an intellect and capacity for the study of technology. That bodes well for investing companies to find the trainable labor that gas turbine-related projects require. As an indicator, China took 10 years in the field of aviation technology to cover what had taken the Western world 60 years to develop.
Granting loans (by private banks or multilateral agencies, such as the World Bank) in most contemporary instances depends on the project supporting “sustainable development,” which in turn requires sound environmental practices. Approved projects have been cancelled in midstream on this basis alone. For instance ,in July 2013, the World Bank (WB)12 agreed to limit financing of coal-fired power plants to “rare circumstances” as part of a new energy strategy aimed at tackling climate change. The WB said in its “Energy Sector Directions Paper,” updated every 10 years, that it will amend its lending policies for new coal-fired power projects, restricting financial support to countries that have “no feasible alternatives” to coal, as it seeks to balance environmental efforts with the energy needs of poor countries.
The WB has traditionally argued that funding coal-fired power plants is sometimes necessary to bring energy to the world's poorest nations and to help them eradicate poverty, so while a tougher stance has been adopted, there still appears to be wriggle room in order to facilitate countries with no alternative in terms of energy security and the combating of poverty. Analysts say coal is often the cheapest energy source in places like Kosovo, where the WB is mulling whether to support the country's plans for a coal-fired power plant. In its latest paper (post 2000), the WB also backed increased support for hydroelectric power, reversing its decision to abandon those projects in the 1990s under pressure from aid groups that warned they would displace people.
A quick scan of the headlines in IEA’s regular email indicates that even as the USA is taking steps to shut down coal plants, the rest of the world is increasingly developing its coal-fired power generation. This is in part due to the fact that the US’ generation infrastructure has many rather old steam turbine facilities that are expensive to “refurbish.” The Sierra Club and other environmental agencies have also hurt the coal industry in the USA. At the same time however, projects like FutureGen are going ahead. Whether this project will herald more like it in the USA remains to be seen. The answer depends to some extent on the progress made with certain technologies, such as coal gasification.
The concerns of project developers follow those of their lenders. The same factors affect a project’s profitability. The factors, such as emissions taxes, may alter over time.
Political Incentives, Infrastructure, and SPPs
Political infrastructure does not always see fit to give incentives to SPP formation. Singapore Power used to be quite adamant about not buying excess power made by SPPs, such as oil and petrochemical firms. For instance, until the late 1990s, Singapore Power had been able to supply all its consumers profitably. It now allows IPP agreements and is likely to relent further in terms of purchases from SPPs. As a consequence of the initial policy, firms such as Petrochemical Corporation of Singapore (PCS) were careful to generate power that was just below their own requirement of about 25 MW, after they had installed their in-house Alstom GT 10, so there was no question of them supplying any to the national grid.
Other SE Asian countries had future SPP development stalled for a while as IPPs have long-tenured power purchase agreements in place. The government is obliged to buy the power they produce. For the most part, these IPPs have been running at base load since being commissioned around the late 1990s. Tenaga Nasional Berhad (TNB), Malaysia’s national power company, therefore has not seen much incentive for encouraging its own plants to retrofit cogeneration facilities, let alone encourage SPPs.
Thailand, on the other hand, will take everything it can get. It had created an incentive structure for receiving power from SPPs by the mid 1990s. This is excellent planning, particularly in its recent predicament with devalued currency and a sudden dearth of willing international IPP investors. The Electrical Generating Authority of Thailand (EGAT) is the authority that buys SPPs’ excess power. Thailand provides good incentives for SPPs, as is illustrated by the Esso refinery in Sriracha, Thailand. It has two ABB GT35s for its power needs and sells the excess to the national grid. Unfortunately, this is limited by the transmission lines available for the purpose, only 15 kV rated, as in the case in some areas of Thailand.
Thailand’s first trash burning plant contract (20 MW) was let to Kvaerner in the 1990s. Thailand is likely to see far more of these plants; many of them will probably be IPP facilities or SPPs who need steam produced from the trash fuel for their other processes.
Thailand also is progressing on biomass burning in around 20 MW increments, using yet another fuel (rice husks, bark, and other plant material) of which it is not short. Other SE Asian countries, such as Vietnam, have used biomass on a small family-sized scale for centuries before their oil and gas resources, as well as the potential for power generation revenues, brought the major OEMs to their countries.
Merchant Power Producers
The latest trend in the fast moving business of independent power producers is that of merchant power producers. An MPP is an IPP that has no long-term contract for sales of most of the power it produces; in other words, no measurable financial security at the time of making the decision to build the plant. MPPs’ business and negotiating skills therefore have to be superior, as does their credibility, or they will make little or no profit. New MPPs can compete with established IPPs whose contracts are running out, on level turf.
MPPs mark a trend that is barely five years old. It was fostered by the fact that deregulation creates intense global competition in this industry. Deregulation in turn mutually fosters decentralization, which causes rural industry and power demand to grow. A good example is Brazil, which managed to get inflation below 10%, down from 2500% annually. The net effective spending power of its people rose accordingly, creating a middle class with appliance and gadget hunger to match. This also contributes to small rural industries, which now have enough stable capital to invest in industries such as small mining rural plants.
These plants need power in quantities that make a great deal of sense for small- to medium-sized power plants owned by IPPs or MPPs. The plants owned by national companies generally are much larger and more centrally located. Power purchased from them often is an inefficient proposition, because of tariff structures, transmission losses, or both.
MPP contracts are being signed on an almost daily basis now. MPPs build small- to medium-sized facilities that require less of an outlay than some of the massive IPP plants built (which had a guaranteed power purchaser or purchasers).
IPP strategy, in face of competition from MPPs, is for raised efficiency, optimized operation, automation that reduces required personnel, and anything else that cuts cost per fired hour. Some of the optimization stems from the growing trend in tougher environmental legislation. In England, an IPP facility at Dagenham (an English-Canadian joint venture) purchased a retrofitted engine condition monitoring system that helps optimize CO2 emissions taxes, in the 1990s. Plants in Scandinavia and other European countries were ahead of the curve and already equipped to cut costs.
The Oil Company Model Thus Far
Some 30 years or so ago, the only consideration for an oil company to produce its own power was the size of its power requirement or the remoteness of its facility. Commissioned about 20 years ago, the first 170,000 barrels-a-day Syncrude oil sands plant in northern Alberta needed to run machinery in a $3.5 billion (in 1976 dollars) plant, as well as support the massive startup load of its mining draglines. It required its own power plant, as did Esso’s Norman Wells oil production operations in Canada’s remote north. Efficiency was less of a power production machinery selection criteria than availability. No one talked about combined cycles or cogeneration much. Also, if the government tariff for power it bought back from the operator was not advantageous, that was not considered a major issue. Power companies felt enough in control of turning healthy profits to discourage potential SPPs.
This is changing drastically but at varying rates throughout the world. The burden of emissions regulations and, in progressive countries such as Sweden, high taxes on weight of emissions, has made burgeoning industries of retrofit and environmental engineering. Faced with increased difficulties in turning a profit, many formerly smug national power companies are allowing “independents” (power producers that make only power) as well as SPPs (that may be refineries, process plants, and mills) to enter the fray.
Some nonremote oil company facilities produce what power it takes to help them get their products delivered. Take Elf, U.K., for instance, which produces all the power it requires at its Flotta terminal and sells any excess back to the national grid. Offshore platforms always have made their own power. Occasionally, as with the BP Forties field in the North Sea, if platforms are close enough together, the oil company may lay down underground cables for platforms to share power produced by one of them. However, underground cables are expensive to lay. Also, changes in production flow could occur, as is the case with Forties and Brent after their fields were found to be larger than thought. Power to platforms could get interrupted if the “main” platform were to shut down its generation turbines for any reason.
Today, there is a proactive movement by oil companies to get involved with the power generation business internationally. It does provide an end market for the fuels they provide. If and when this is done by an operating plant for its own power consumption (with excess being sold to the national grid), such as Syncrude, it also provides consolidation of specific resources, such as specialist staff services and repair facilities. A number of contemporary projects involve oil companies in joint venture plans, with governments and other power companies, for actual ownership in power plants.
BP Gas, not always the most assertive of the oil companies in terms of power generation, nevertheless, admits that it currently is considering several power project joint ventures, including ones in Vietnam and Columbia.
Shell International acquired 50% of InterGen, a joint venture between Bechtel Enterprises Ltd. and Shell Generating Ltd. One of InterGen’s ventures, the 770 MW station at Rocksavage, England, was opened on July 31, 1998. Only recently did Shell officially recognize the need to use major increases in power generation capability to make its 1996-initiated “fuels to power” strategy effective. Another proactive example of oil companies providing a market for their fuel with power plant investments was thus set.
Exxon Mobil’s publicly stated strategy on power generation, particularly in lucrative SE Asian markets, is assertive and focused. The former Exxon’s statement read:
Pursue attractive power generation investment opportunities worldwide to grow earnings while capitalizing on synergies with other Exxon businesses.
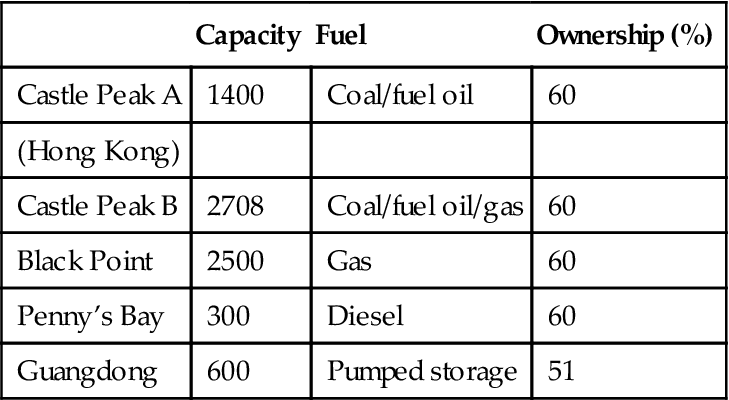
Maximize the long-term value of current power interests in Hong Kong.
Exxon had noted the global trend toward deregulation and therefore the emergence of power investment opportunities in many countries. The first area of major interest selected was Hong Kong. Exxon Energy Limited (EEL) holds 60% ownership of three power stations in Hong Kong. China Light and Power (CLP) operates the stations and owns the remaining 40%. CLP also owns all transmission and distribution facilities in Kowloon and the New Territories. EEL also owns 51% the company, which has off-take rights to half the capacity of a pumped storage station in Guangdong Province, China.
Exxon Mobil’s generating facilities in China are listed in Table 18–1.
Positioning with Respect to Technology
The Gas Turbine’s Main Rivals
Nuclear Power
Nuclear power’s pitfalls can (as many recent crises in that industry segment demonstrate) include (but are not confined to):
• Inadequate or complacent management in some firms (the now defunct Ontario Hydro is a case in point)
• Waste fuel management technology
• Politics revolving around waste fuel management (like the unpopularity of Yucca Mountain with locals in the United States)
The management of these issues can make the difference between whether a nuclear power plant provides economic power or not. The best illustrations of this fact are acquired by looking at some of the recent events in the nuclear industry in some of the countries attempting to sell their nuclear technology to newly industrialized countries in SE Asia: Canada, Finland, Japan, the United Kingdom, and the United States.
The Ontario Hydro debacle or the far worse messes of Three-Mile Island and Chernobyl will not stop the growth of nuclear power, as sector estimates for different countries’ growth indicates. It is worth pointing out, however, that, of all forms of power generation, nuclear power by fission is one that leaves the public at considerable potential risk. Unlike the case with fossil plants, nuclear plants may not provide a gradual warning of future problems.
Nuclear reactors that use the fusion process avoid the waste problem that fission reactors have. Some current estimates to get fusion reactors into commercial operation state 2030 as an approximate realistic target date.
Fossil fuel poor countries will continue to advocate nuclear fission power. Japan is still the world’s second largest economy, with power needs to match. It imports all but 0.4% of its oil, 5.6% of its coal, and 4% of its gas; hence, its emphasis on nuclear power. Its recent nuclear disaster was a setback, but not enough for a national moratorium on nuclear.
Japan needs to import the fuel but otherwise can consider nuclear power a semi-domestic industry. It consumes about 140 GW of power and 30% of that is nuclear provided. By 2010, nuclear’s sector share climbed to 42%.
Public Opinion of Nuclear Power
The global domestic sector currently is about 20% of overall global activity. One might be tempted to think that isolated individual consumers, such as households or small farms that install mini-hydro or windmill facilities, might not affect the large power producer’s territory. This is totally untrue, as illustrated by the two nuclear plants in Sweden that were cancelled when 200,000 households installed individual geothermal heat pumps. Not everyone has the Swedes’ characteristic environmental verve, however.
Some Lessons Learned with Large Nuclear Power Plants
One lesson learned from the severe ice storms suffered by Canada and the United States early in 1998 is that smaller IPP installations might prove less of an Achilles heel to overall power demand than a few large national power plants.
Problem-riddled national nuclear industries in Canada, the United States, and Japan are testament to overly optimistic life prognoses of nuclear fission reactors. They have and will continue to be decommissioned. This can result in several smaller IPPs taking up the slack.
Coal-Fired Thermal Units (Gas Turbines and Steam Turbines)
Energy estimates in years of fuel left in global reserves vary according to their source. In the late 1990s, the world was thought to have about 70 years worth of natural gas supply left. New deep-sea exploration moved that figure up to 90 years. Then fracking technology appeared on the scene and few people would swear to the new figure. That said, many countries have a great deal of coal and mining it (or turning it into coal gas with steam) is well known and predictable. Developments that use coal syngas are on the rise everywhere. Much as legislation may point out that natural gas causes only half the greenhouse gases and global warming that coal does, countries that have coal want to use their coal.
Besides, countries that have an abundance of natural gas, such as Malaysia, are thinking in terms of its export more than its domestic consumption. At a power generation conference in 1996, Malaysia’s Prime Minister, Dr. Mahathir Mohammed, stated that he would like to see less “dependence on gas turbines.” Translated, that is likely to have meant, “we can burn cheap coal, imported or otherwise and sell our natural gas at a profit to Japan, Thailand, and so forth . . . also if we put off selling it, the prices are sure to go up.”
Frequently, in countries like the United States, fuel-burning facilities, such as power plants, “share” or exchange their pollution allocations to meet a legislated area average.
After-the-fact retrofits to help environmental emissions cost 300% what they cost to put them in at initial installation stage, so they are not popular with plant owners.
Now new technologies being reinforced with projects that that the EEC began long before FutureGen have appeared and make coal a viable gas turbine fuel, if still not a preferred one.
The Economics of Coal
Coal, particularly in developing areas, is the fuel of choice. Apart from the size of known global reserves, there are other economic reasons. To look at these in more detail, it is worth considering SE Asia, where more than half the world’s population lives. Coal is their most common fuel.
Gas is cleaner but expensive if you do not own it. Poor in natural resources, Japan currently maintains most of its stringent environmental standards by burning expensive LNG and continuing to develop nuclear power.
The Philippines, despite the Camago Malampaya gas field discovery, nevertheless has a long-term energy policy that places coal uppermost in its priorities. The offshore field has gas reserves enough to keep 3000 MW (1 MW = 1000 kilowatts) of electrical generation capacity running for 15–25 years. Nonetheless, the 25 GW (1 GW = 1000 MW) of anticipated power generation new installation before 2010 breaks down into 60% of coal-fueled power, 10% hydro power, and the rest gas. Coal takes the lead because it is still the cheapest and most abundant fuel that the country can use.
Back in 1995, Indonesia started a national policy to reduce its dependence on oil. Instead, it exports its oil and will base power growth mainly on coal and hydro resources. Currently Indonesia’s 10 GW are fueled thus: 25% gas, 20% hydro, 20% diesel, 35% coal, and 5% others, including geothermal. It is intended that, by 2020, 50% or higher will be coal and 40% oil and gas. Indonesia, in the early 1990s, was gifted with Finnish technology and joint venture capital aimed at developing its vast natural peat resources as a fuel. Therefore, Indonesia has yet another economic reason to curtail the burning of natural gas and oil, its cleaner fuels, and concentrate more on coal (and peat on a smaller scale).
New trifuel (coal/oil/gas) burner technology (for boiler and steam plant designs) can limit NOx (or oxides of nitrogen that combine with water to make acid rain) levels to below 20 ppm (parts per million, by volume). This standard is good enough for the most stringent environmental NOx standards in the world.
Despite an increase in China’s natural gas and liquid fueled facilities, it is expected that 75% of that power will be, as it now is, coal fired. China is the world’s largest market for coal-fired stations, and power is its largest industry sector. China releases over 7 million tons of SO2 (sulfur dioxide, which combined with water also adds to the acid rain problem) to the atmosphere annually. Coal burning, of course, is the main culprit.
As a consequence of fast changing environmental standards, the wealthier nations of SE Asia are retrofitting scrubbers (to clean up coal emissions) as fast as they can. Countries with a higher standard of living, like Taiwan and Korea, have more stringent standards. Those standards are progressively tightened every five to seven years to produce still cleaner emissions.
Coal Gasification and Coal Gas
Coal gasification technology (to use coal gas instead of natural gas in gas turbines) is on the upswing. Gas turbines then will grow in popularity.
This is because, despite the world’s tendency to promote steam units due to its desire to use coal, once coal gasification is widely commercialized, the gas turbine population will increase and help make coal-burning steam plants redundant. Users also want to take advantage of the higher efficiencies offered by the gas turbine and gas turbine CC systems. A higher efficiency by 20% (IGCC versus conventional steam turbine) means one uses 20% less fuel.
Coal gas now also can be produced by underground coal gasification. Basically, the process is simple. Two boreholes from the surface are drilled. One supplies oxygen and water; the other removes the gas produced. The former is generally drilled vertically; the other follows the curvature of the coal seam. The process can “work” coal seams up to 1 km deep. What the process essentially does is avoid all the cost and dangers of underground mining and results in a gaseous coal product suitable for power generation, with the ash and several other unwanted constituents in the ground.
The prevalent tendency is to think “steam” and “steam turbine” or “thermal unit” at the mention of the words coal fuel. Since coal fields in the middle to late twenty-first century may look more like oil fields than current mining establishments, the vision is probably outdated.
Commercially, Siberia and Uzbekistan are the only countries that have used this process. However, recently, a European Union (EU) project in Spain demonstrated the feasibility of this process. The EU, like the rest of the world, is looking for a hedge against natural gas prices soaring when escalating requirements and security of supply raise gas prices.
The process can mine deep coal seams that would be uneconomic to mine using conventional methods. Some of these coal seams, interestingly enough, have been found when companies were drilling for oil and gas.
Now this in-situ conversion of coal into gas gives the gas turbine world a potentially plentiful source of fuel. The acronym UCG (underground coal gasification) has been coined. The Spanish project’s coal gas had a heating value of 11 MJ/cubic meter. Optimization could yield 16 MJ/cubic meter.
“Renewables”
These include turbines driven by wind and tidal power. Their profile is growing globally.
Other regenerables include wave energy and biomass energy. Wave energy is in its infancy. Biomass, including peat, are not yet widespread on a large scale.
Using Technology to Advantage
Fuel Technologies
The gas turbine continues to burn a widening range of fuels including but not limited to:
Designers continue to improve the gas turbine’s technology with respect to burner residence time, flame temperature, cooling, reading hot section temperatures, and so on.
Repowering
Repowering is a major activity in Europe and the United States. The incentives are adherence to Kyoto objectives, but the higher efficiencies available with gas turbine options can make IPPs far more competitive. Although emissions taxes are not yet reality in Asia, they are in Europe, and the trends will eventually spread. They should, particularly if we look at the economic gains in an example such as the Peterhead station in Scotland. The two boiler, two GE 115 MW Frame 9E station had been designed to operate on heavy fuel oil, LNG, sour gas, and natural gas. In 1998, the decision was made to increase plant capacity with three Siemens Westinghouse V94.3 combined cycle units. The V94.3 is a scaled-up version of the V84.3, which can run at both 60 and 50 cycles. The economics of the situation are heavily influenced by fuel sources now made available by the U.K.’s gas supplies. It is important to note, however, that station efficiency will jump from 38% to between 50 and 55%. NOx emissions will be reduced by 85%.
Another major reason for the repowering trend is that what was thought to be 60 years worth of natural gas left in global supply terms was “updated” to 70 years plus recently. Evidence from ongoing exploration indicates that this figure will climb. Despite China’s anxiety to use its coal and the Middle East’s desire to use its residual oil, the trend toward gas turbines burning cleaner fuels will continue as lending agencies increasingly tie up their loans with environmental standards as conditions. As gas turbines get better at burning atomized coal, residual fuel, and other erosive or corrosive fuels, use of the gas turbine will increase. As will use of these fuels—at least until emissions taxes are felt as heavily as they are in countries like Sweden. NOx and SOx taxes will become the norm fairly early in the new millennium, as they are a source of tax revenue from power companies. Deregulation will tend to favor establishing these taxes worldwide. A CO2 tax will soon follow in their wake and, with it, the operational economics that may make more-expensive natural gas start to approach competitiveness with residual fuel and coal. Operational economics consider overall costs per running hour, which includes factors such as TBO (time between overhauls, which extends with cleaner fuels) and longevity of components. The gas turbine then is in the ascendant, the remaining question is, whose turbine?
The primary reason that gas turbine packages are bought is good financial purchase packages (GE, for instance, excels in the financial arena), not technology. However, good service features (which technology dictates), fuel price, flexibility in terms of choices, and parts longevity are high on that list, too.
Desalination
A complacent world is getting alarmingly short of fresh drinkable water at a pace that accelerates in proportion to global industrial activity. I ought to say, some countries instead of world, although it may as well be the world. The larger powers have more of all basic resources, including water, and wake up calls, such as part of California’s ground level sinking as it drains its usable water, go relatively unsung in terms of widespread public alarm. On the other hand, gains in fossil fuel reserves, whether by exploration or some new technology, get greater press.
We always take for granted what we have in abundance. So it is with the Middle East and her fuel reserves. Always water hungry, however, a new technology that may as yet be underestimated in terms of global reach, now gives the fossil fuel rich moguls a reason to care about efficiency. No doubt, this technology will spread.
The Middle East has fuel resources in abundance—natural gas, clean oil, and residual oil—and technology available that will help it burn each of its options with what it terms “acceptable” (not optimum values in most Western countries) efficiency. This technology also helps it achieve its major operational objective, which is to extend time between overhauls and therefore parts life (as defined by life cycle analysis, LCA) over the previous generation of power-producing machinery it operated. Saving fuel for its own sake is not as critical to this market as it is to areas that do not have natural gas and oil in abundance. However, a new reason that the Middle East has for caring about efficiency has emerged in the last decade: desalination. The Middle East is very short of fresh water.
How Desalination Works
There are many different techniques for desalination. Among the main ones are the multistage flash (MSF) process and reverse osmosis. Qatar’s technology showpieces include the Ras Abu Fontas B power and desalination plant, which cost $1 billion to build. Dubai, in the United Arab Emirates (UAE), has a 60-million-gallon per day desalination plant at Jebel Ali. The plant’s eight MSF units are part of a cogeneration power facility, and the fresh water would have been at least as much incentive in the Middle East as the increased total thermal efficiency. The desalination equipment in both cases was supplied by Weir Westgarth. Weir Westgarth designed the MSF process. The principle of the system is simple: Water and steam in a closed system can be made to boil at temperatures lower than at standard temperature and pressure by reduction of the system pressure. MSF plants contain a series of closed chambers—as many as 20, each held at a lower pressure than the preceding one.
Heated saltwater is passed through the overall system. In each chamber, some of the saltwater vaporizes into steam. Moisture droplet separators remove saltwater droplets. The steam condenses to fresh water when faced with cold tubes and is collected for storage. The last chamber’s brine is quite cool, and it is used as the coolant fluid. Then it starts to pick up the latent heat of condensation and increases in temperature. Only a small amount of additional heat investment is required to prepare this stream for entry into the first flash chamber. One source of this steam, of course, is low-pressure steam from a power station.
The key to the reverse osmosis (RO) process is a suitable semipermeable membrane. Improvements in membrane technology now mean that the process can apply to industrial-scale plants. Common contemporary membrane selections are made of a cellulose-based polymer or a polyamide layer applied to a microporous polymer film. This membrane is bonded to a porous polyester sheet for structural stiffness. This composite is rolled into a spiral. Spun hollow fine fibers are the finished product. The semipermeable layer is on the outside of the fibers. The total thickness of the composite is about 24 microns. The outside diameter of the tube is about 95 microns, making for a large surface area for rejecting salt. The fibers are made into bundles that are sealed with epoxy in a fiberglass pressure container.
The Global Drive for Desalination
The main forces behind the optimized commercialization of desalination technology are ironies in the light of conditions in the Middle East. Concern regarding seawater contamination of fresh water aquifers in more freshwater-rich countries was one. (Seawater takes the place of fresh water as the aquifer pressure drops with water extraction.) The need to give nuclear energy a better image (by using its waste heat to produce fresh water) was another.
With respect to the first concern, desalination alleviates use of underground fresh water aquifers, which then reduces the risk of seawater seeping in to make up the balance of fresh water pumped out of the ground. Japan is gas and oil poor. A major user of nuclear power, it has been instrumental in promoting the use of desalination processes in conjunction with its nuclear facilities. The water is produced only in enough quantities to be used by the plants themselves. However, the Nuclear Power Technology Development section of the International Atomic Energy Agency (IAEA) has been seeking to promote large-scale desalination in conjunction with nuclear power production since 1989. The IAEA no doubt hopes that a fresh water supply would overcome the general public’s reluctance to be situated close to a nuclear station: Water rises in cost if it has to be transported further.
Interestingly, despite the IAEA agreeing that MSF is promising, it does not contemplate using it for any of its large-scale attempts at fresh water production because of its inflexibility at partial load operation. MSF’s tendency to corrosion and scaling versus other desalination techniques does not help either.
Metallurgical Selections
The amount of seawater handled for a given membrane selection and seawater temperature varies directly as the applied pressure. Gulf seawater typically contains 19,000 ppm of salt. Typical temperature gradients are 20–30°C. Metallic corrosion at 30° is four times what it would be at 20° (double the rate of corrosion for each 5°C rise in temperature). This then requires corrosion-resistant alloy selections for the pumps.
To design for a 25-year pump life for a Danish nuclear plant, Alfa Laval used copper nickel alloys in the evaporator and titanium for the heat transfer tubing.
Of course, desalinated water requires fewer chemical additives for water treatment. This is an advantage in terms of overall system cost.
Environmental International Caucuses
The effects of international caucuses such as Kyoto, Rio and Montreal, include additionally stringent environmental legislation. The massive acid rain damage noted in the 1970s and 1980s made NOx and SOx emissions the first major emissions priority. Scandinavian coutnries, such as Sweden were quick to assess taxes per unit weight of NOx or SOx.
Carbon dioxide emissions were very much part of Kyoto, but only in early 2006 did the mainstream U.S. media (Time magazine) began the cry of “be worried . . . be very worried” with respect to global warming. Acknowledged U.S. presidential concern began towards the end of the Goerge W. Bush era. The overall effects of growing concern are evident with the revival of projects such as FutureGen and the growing list of new technologies or existing ones being optimized. They are covered in some detail in Chapters 7 and 11 of this book, also indirectly, to some extent in Chapters 10 and 12. For further details on carbon dioxide removal and sequestering, see Chapter 11, Environmental Technology.
With matters relating to the cost of environmental controls, the European countries have always been more proactive than the United States. However, things are changing as is evident with an increase in international joint ventures, such as the one between China and the United States, aimed at sharing technology on carbon capture (see earlier in this chapter).
OEM Changing Fortunes
OEM Acquisitions, Joint Ventures, and Licensees
Which “Parent” Philosophy Governs Which Model?
“Parent” companies also are changing rapidly. As we saw in the introductory to the chapter, due to acquisitions, mergers, joint ventures, and engineers who work for more than one OEM, it gets hard to recognize certain gas turbine models from their insides.
Certain key developments are well known; and it is easy to identify where, when, and by whom they might have been originally designed. For instance, the SEV (sequential environmental) burner was an ABB (Asea Brown Boveri) design, designed when the company was ABB, not Brown Boveri (as it once was), and not ABB Alstom, later Alstom, as it later became. The wide chord fan blade was a Rolls Royce original. Steam cooling in closed-cycle loops to support H technology, which was a success both in design and full load test, was probably a Mitsubishi first. This may be debated by some, but note that “first” refers to no leakage on a full load test. The Cyclone, Tempest, Tornado, and Typhoon were grassroots designs engineered by European Gas Turbine (before ABB bought it) when it was EGT, not in its formerly Ruston days. Now these models are owned by Siemens. Sooner or later, every OEM has a variation on a theme or a better alternative for which it may not have done the grassroots development.
Grassroots model development is expensive. The very fact that the Cyclone was developed in the first place indicates that the manufacturers foresaw potential market share in a power bracket that would also equate to a Solar Mars. At this power range, the compressors partnered with mechanical drive gas turbines tend to require adherence to API (American Petroleum Institute) specification. It could have been anticipated that this would put the OEM on equal footing with manufacturers like Solar, who currently has the lion’s portion of the installed mechanical drive market share in sectors such as SE Asia’s oil and gas production market. It similarly dominates in the installed-machinery oil and gas production market in the United States and Canada. Solar’s historical advantage was based partly on market entry timing and partly on the fact that their smaller compressors did not always need API specification adherence to win contracts.
Licensee Growth and Development
When a licensee does well, the company that licenses it to build gas turbines also gains strength.
General Electric is a major conglomerate with a large stable of licensees for different gas turbine product lines. They include Nuovo Pignone, GEC, Stewart and Stevenson, and Kvaerner.
Consider the growth of Kvaerner. Kvaerner, originally founded in 1853, made steel products. This was extended to include high-head Francis and Pelton type turbines: current unit sizes exceed 400 MW. The 1956 agreement signed with General Electric licensed Kvaerner to build marine steam turbines and later industrial and aero-derivative gas turbines.
Kvaerner’s client base is largest in Scandinavia but they now market aggressively in SE Asia, as an individual company and also in joint venture agreements. Kvaerner bought John Brown, another licensee of GE, in April 1996. John Brown was already seasoned in Asia and its plants included one of the earliest combined-cycle plants in the world, built in Hong Kong and commissioned in 1972. John Brown has been renamed Kvaerner Energy Limited. Its consortium with Kvaerner is called Kvaerner Energy Thermal Power.
Asian projects include a combined-cycle plant in China. The 330 MW station in Zhenai, Zhejiang province, China, is heavy-oil fueled and then requires technology similar to that employed by the plant in Shunde, Guangdong province, that runs two ABB (now Alstom) 13D-3s in combined-cycle mode. In the case of the 13Ds, the design already incorporates the low turbine inlet temperatures (TITs) required to make the turbine run successfully on residual or bunker oil.
In Kvaerner’s case, the GE-9E combustors are adapted for burning residual. The fuel is washed and chemically treated. It is also heated, with steam from the steam turbine, to lower its viscosity so that it flows well enough for fuel injection. As with all residual fuel applications, expensive high-quality distillate is required on startup and shutdown to avoid the fuel nozzles clogging. Deposits build up on turbine blades and have to be washed off regularly or the effect gas path area will eventually clog. The frequency of the washes depends on the turbine design and fuel quality. In this plant’s case, washing is about once weekly.
The plant cost over $100 million to build. When necessary, it can be operated in simple-cycle mode. The plant is run 16 to 18 hours a day for at least 300 days a year, adding up to 5000 to 6000 hours a year.
In 1995, Kvaerner opened an office in Kuala Lumpur, Malaysia. Its first contract was for one LM2500 gas turbine driver for an Ebara compressor, which will be used in Shell’s Central Luconia project in Sarawak.
A Kvaerner-built foil cat that serves the route between Hong Kong and Macau runs on Kvaerner supplied gas turbines. Kvaerner services some of the Indonesian navy’s LM2500s in its overhaul and repair facility in Agotnes, Norway.
OEM Business Strategy Including Production Backlogs and Vendor Alliances
The state of all manufacturers’ backlogged orders is proof that the power business in booming with unprecedented vigor. Although manufacturers are strict about not making predictions regarding future order numbers, indications are that the backlog condition will escalate in the next few years. Many customers, new and old, have stopped looking at individual design features that can directly affect their costs per fired hour, even if they know how to assess them. They just take whichever machine they can get delivered the quickest. If that machine has problems due to ironing out new design updates, the customers need to compensate for this by writing “guarantee points” into the contract (the manufacturer promises a certain availability for the first year, collects bonus points for meeting targets, demerit points for not doing so, and raises the availability figure with increasing experience with any one model).
Even large customers who have their own engineering staff are opting for “power by the hour” contracts with the OEM and leaving all parts replacement decisions to the OEM. This may prove to be expensive, as OEMs make the bulk of their profits with aftersale spares and service. Yet, increasingly U.S. customers expect their OEMs to also do their service, rather than staff up to do their own or even their own assessment of the effectiveness of overhauls.
The power producer mix is shifting to include OEMS, oil companies that are also becoming IPPs, SPPs, and hungry MPPs anxious for a quick return. The demand for gas turbines in all sizes and system formats (simple or combined cycles) keeps climbing.
The strategy of major OEMs has also been to acquire all the turbine systems accessories and support companies they can. GE is a good illustration of this. By staying abreast of these developments, customers can turn their OEM’s diversification and growth in their favor.
Another noteworthy trend among the OEMs is the development of power options that use renewable resources for fuel. It is a considerable goodwill factor in their annual statements bottomline, something that is increasingly acknowledged within the United States. This sometimes can be rewarded with public awards for performance and service. To what extent gas turbine OEMs allow their renewables portfolio to flourish depends on which of their lines (and profitability) will decline if they do. Their overall publicity campaign (e.g., “ecoimagination” ads) support their decisions regarding profitability mix, government contracts sought, and gains in political alliances. OEMs have continued to buy companies, stakes in new technology development, and e-trading businesses, all of which will affect the turbine market, in the United States and globally.
OEM Development Programs with the U.S. Government (DOE)
This has been well illustrated in this book with several case studies of the work done by the OEMs under U.S. DOE (Department of Energy) sponsorship.
Oil and Gas Production Portfolios Help OEMs
Examples of this include: GE Energy Rentals bought Jenbacher, an Austrian natural gas power generation reciprocating engines. GE Power Systems purchased Nuovo Pignone (which makes compressors, gas and steam turbines, pumps, and an assortment of process and power accessories), Gemini (which makes reciprocating compressors for natural gas applications), and Thermodyn (which makes small compressors and steam turbines for oil and gas as well as power generation).
The larger OEMs’ philosophy seems now to be to maintain a presence with both the fuel supplier and the customer base for their own machines.
OEMs Communications Infrastructure Grows Portfolio
A case in point is this: GE bought Young Generators in April 2000, a company that is a leading provider of power generation rental equipment and services for the motion picture, broadcast, and events businesses. This increases GE’s reach with respect to temporary distributed power solutions. “Outage Optimizer” is another Internet service provided by GE. It helps turbine owners plan outages for their machines, evaluate service bids, and purchase them online.
Service Company Acquisitions
Most OEMs have secured technology transfer agreements with highly sophisticated companies that developed specialized repairs: coatings, blade tip robotic welding, powder metallurgy, online wash systems, and so forth. Despite items such as online trading in used or reconditioned parts, sometimes an OEM may make these available to a specific customer only if that client knows enough to ask for the option. (Not all these developments end up as general service bulletins.) To a smaller company, this “current options” information can save a great deal of money. It is always worth a customer’s while to investigate the OEM’s current state of technology share agreements to pursue every last advantage possible in the fight to drive down costs.
Accuracy in Reading the Target Market
The end customer must consider an interesting twist to the market equation. It is a consideration tied irrevocably to the changing manufacturing partners, as this affects the largest questions on the purchaser’s mind: How much will good service cost me? Who will provide it? What are their service and engineering philosophies—old, new, negotiated compromise?
Consider that what was ABB Stal’s (now Siemens by acquisition) grass-roots designed GTX-100, 43 MW has not yet made a dent in LM6000 territory. Reasons may include GE’s financial services competence with structuring deals or perhaps a preference for an aeroderivative’s modular design over an industrial one. Will the GTX eventually take a sizable market share because of its ability to withstand dirtier fuels and a wider range of heating values?
Reading Renewables
Smart grid development and legislation will really help the progress of renewables in the United States. The rest of the world, including the developing world, like China, has already been proactive in this field for years.
Staying current with environmental legislation helps direct where OEMs must eventually head. OEMs are aware that the century of renewable energy fuels is anywhere from three to five decades ahead, and they are quietly getting ready. Siemens, for instance, is working hard on fuel cell (and many other energy products) development even as it develops different coal gasification technologies. Mitsubishi develops wind turbines (and other energy products) even as it develops its gas and steam turbines. While not in a hurry to abandon their conventional technologies, all of them want to be able to sell their client base fuel cells and tidal turbines when those markets turn profitable. An informed customer will use this to tailor contemporary demand curves within his control to best advantage when in negotiations with the OEM.
End-User Associations
End-user associations exist for practically every model in the gas turbine world. For instance, the Alstom-11N population has their own meeting, the GE-7E people meet every year, and every military helicopter engine has its own CIP (component improvement program) meeting. One needs to find one’s own crowd and stay abreast of their global community’s problems.
The paradigm “You get what you negotiate” is true with overhaul contracts as much as anything else. When the contracts cross international boundaries, this may be even more accurate. Increasingly, customers need to investigate contract term options with the worldwide client base of their particular original equipment manufacturer.
Overhaul contracts are negotiated on a variety of bases. The end user must pick what best befits its application. Power by the hour is one of the most common bases for contracts.
Others specify hot section overhaul only, with everything else on an as-needed basis. The term used by some for this kind of contract is hot gas path inspection protection plan. A monthly charge applies per machine.
Some power producers turn over overhaul and repair entirely to the OEM or an OEM company.
The end user’s aim ought to be to get the best cost per fired hour. The end users with sufficient experience with repair and overhaul achieve this with a combination of OEM-bought parts and maintenance, independent repair vendor-bought parts and maintenance, some maintenance from in-house end-user staff, and constant experience comparisons with other end users in the business via end-user associations.
Two of the most valuable items on which end users can compare notes are independent contractors and spare parts price/power by the hour price variations.
The Independent Contractor Factor
End-user associations force OEMs to accommodate machinery owner priorities and preferences by sheer weight of numbers. Another powerful and growing asset in the quest to reduce overhaul costs is the independent overhaul contractor workforce.
Frequently, the main executives at independent overhaul contractors are ex-OEM employees who may have designed or pioneered the technology they now are “going independent on.” Such contractors have an edge over others with “reverse engineering,” the term used to describe working out the steps in the manufacture of a component just by having one physically to work with, without benefit of the OEM’s drawings or designs.
Some such contractors will also confidently tackle “re-engineering,” which is actually engineering the manufacture of a component again. Metallurgy, heat treatment, coatings, and so forth may differ from the original in a re-engineered component. Typically, a component is re-engineered to save money, improve its operation or life, or all of these. It requires extreme engineering competence and confidence to do this. It also requires considerable technical competence on the part of the end user to assess such a contractor’s ability to match its claims. When it can, however, the end user stands to save a great deal of money. Therefore, as lost revenue is always a source of ire to the OEM, a further bargaining asset for the end user is available.
Such independent overhaul contractors have made considerable strides in the United States and western Europe. This is starkly contrasted against their minimal potential in countries that are, or recently were, communist. An entrepreneur in this sector once mentioned his frustration when visiting Vietnam, when he invited end users to a free seminar on his firm’s range of services. Some of the end users, used in their domestic industrial culture to being totally dependent on the OEM, expected to be paid for listening to the seminar.
In newly industrialized countries (NICs), such contractors have been viewed with interest for some time. Growing “trial usage” of their services is underway. These firms are anxious to break into territory traditionally occupied exclusively by the major OEMs. See Chapter 12, Maintenance, Repair, and Overhaul, for further details.
Varying Spare Parts and Service Prices
Spare parts, whether paid for singly or as part of a power-by-the-hour contract, are a major component of overhaul costs.
End users sometime stumble upon major differences in prices internationally. A U.S. IPP representative investigating joint venture potential for a company in Pakistan once found that spare parts prices may vary by as much as 300%. To the consumer-power culture in the United States, this seems a large differential. However, the OEM may have built in allowance for “expediting payments” in the chain of customs command in the country in question, which are totally acceptable in the local culture. Also, if the end user is not yet seasoned in the use of the models in question, its expectations of what the warranty may normally exclude (such as component failures resulting from faulty operation) might not be the same as everywhere else. Some OEMs understandably mark up prices for that user to accommodate this difference.
Distributed Power: How Large Does a Power Plant Need to Be?
The Age of the Personal Turbine
The age of the personal turbine (PT) will probably arrive in a few decades. LG, a Korean company, and the German Fraunhofer Institute for Solar Energy Systems (ISE) just launched a product that is a fuel cell system integrated into a laptop computer. A mini fuel cell, hydrogen fuel tanks, and electronics have replaced the computer battery. This may be one a series of steps to the day when we carry our personal turbine/computer (PT/PC) to our car, plug it in, drive to and from work, come home, plug it in, and have our own personal heating system incorporated in this PT, the size of a CD player. Massive transmission line systems may become redundant dinosaurs in many locations.
For more information, see Chapter 16, Microturbines, Fuel cells, and Hybrids.
The Power Mix
The mix (of fuel types) and targets will vary with changing politics and governments, particularly in countries like the USA. Nevertheless, even when under a Republican government, the USA’s target(s) of “renwables in the mix” continue to rise. Politics does not always coincide with technological data. When President George W. Bush was in office, he gained one ally in Australia, inexplicably, given Australia’s previous reputation for caring about their environment. Australia’s prime minister opted to “toe the Bush [U.S.] line” claiming “thousands of Australian jobs will be lost” if his country meets the Kyoto protocol. As it turns out, Australia is closer to the Kyoto targets it negotiated than most countries. The implication to its people of meeting Kyoto is the cost of abating 20 million tons of CO2. This works out to an insignificant $1.95 (2002 prices) rise in their annual power bill: an all-time storm in a kangaroo’s teacup.
The target by 2020 for both the USA and the EU is currently 20% renewables in the mix. How a country gets there varies. Denmark plans to have 50% wind power in her mix by 2020 and to have all her energy from renewables by 2050.
Within a country like the USA, the strategy and policy of individual states will also vary. Consider the case of California. “Established in 2002 under Senate Bill 1078, accelerated in 2006 under Senate Bill 107 and expanded in 2011 under Senate Bill 2, California’s Renewables Portfolio Standard (RPS) is one of the most ambitious renewable energy standards in the country. The RPS program requires investor-owned utilities, electric service providers, and community choice aggregators to increase procurement from eligible renewable energy resources to 33% of total procurement by 2020. The California Public Utilities Commission (CPUC) and the California Energy Commission jointly implement the RPS program.13
California’s history with respect to renewable is an interesting one and the state has stuck to its stated values overall, despite being poorer in resources such as clean natural gas or oil than states like Texas, for instance. Some of the milestones in California’s arrival at it’s stuff-of-dreams “33% by 2020 target” follow.14
In 2002, California established its Renewables Portfolio Standard (RPS) Program, with the goal of increasing the percentage of renewable energy in the state’s electricity mix to 20 percent of retail sales by 2017. The 2003 Integrated Energy Policy Report recommended accelerating that goal to 20 percent by 2010, and the 2004 Energy Report Update further recommended increasing the target to 33 percent by 2020. The state’s Energy Action Plan supported this goal. In 2006 under Senate Bill 107, California’s 20 percent by 2010 RPS goal was codified. The legislation required retail sellers of electricity to increase renewable energy purchases by at least 1 percent per year with a target of 20 percent renewables by 2010. Publicly owned utilities set their own RPS goals recognizing the intent of the legislature to attain the 20 percent by 2010 target.
On November 17, 2008, Governor Arnold Schwarzenegger signed Executive Order S-14-08 requiring that “...[a]ll retail sellers of electricity shall serve 33 percent of their load with renewable energy by 2020.” The following year, Executive Order S-21-09 directed the California Air Resources Board, under its AB 32 authority, to enact regulations to achieve the goal of 33 percent renewables by 2020.
In the ongoing effort to codify the ambitious 33 percent by 2020 goal, SBX1-2 was signed by Governor Edmund G. Brown, Jr., in April 2011. In his signing comments, Governor Brown noted that “This bill will bring many important benefits to California, including stimulating investment in green technologies in the state, creating tens of thousands of new jobs, improving local air quality, promoting energy independence, and reducing greenhouse gas emissions.”
This new RPS preempts the California Air Resources Board’s 33 percent Renewable Electricity Standard and applies to all electricity retailers in the state including publicly owned utilities, investor-owned utilities, electricity service providers, and community choice aggregators. All of these entities must adopt the new RPS goals of 20 percent of retails sales from renewables by the end of 2013, 25 percent by the end of 2016, and the 33 percent requirement being met by the end of 2020.
Timeline of California’s Renewables Portfolio Standard
• 2002: Senate Bill 1078 establishes the RPS program, requiring 20% of retail sales from renewable energy by 2017.
• 2003: Energy Action Plan I accelerated the 20% deadline to 2010.
• 2005: Energy Action Plan II recommends a further goal of 33% by 2020.
• 2006: Senate Bill 107 codified the accelerated 20% by 2010 deadline into law.
• 2008: Governor Schwarzenegger issues Executive Order S-14-08 requiring 33% renewables by 2020.
• 2009: Governor Schwarzenegger issues Executive Order S-21-09 directing the California Air Resources Board, under its AB 32 authority, to adopt regulations by July 31, 2010, consistent with the 33% renewable energy target established in Executive Order S-14-08.
• 2011: Senate Bill X1-2, signed by Gov. Edmund G. Brown, Jr., codifies 33% by 2020 RPS.
Brief extracts from a study entitled Does Califorinia Need Liquefied Natural Gas (LNG)? (Excerpt from 2006 study).15
(Author’s note: The following excerpts from the study named ‘Does California Need Liquiefied Natural Gas (LNG)?’ are included in its entirety in Edition 1 of Gas Turbines as Case 1).
Our analysis shows that renewables and energy efficiency could produce 133% to 381% of the projected additional gas demand in California by 2016.
This report looks critically at natural gas supply and consumption projections and concludes that California’s energy efficiency and renewable energy mandates could readily meet expected additional natural gas demand and, therefore, eliminate the need for LNG import terminals along our coast (Figures 18–1 and 18–2 are included from Edition 1 of Gas Turbines, however, the reader is cautioned to check the current levels of fluctuation in natural gas vs. coal/coal gas demand).
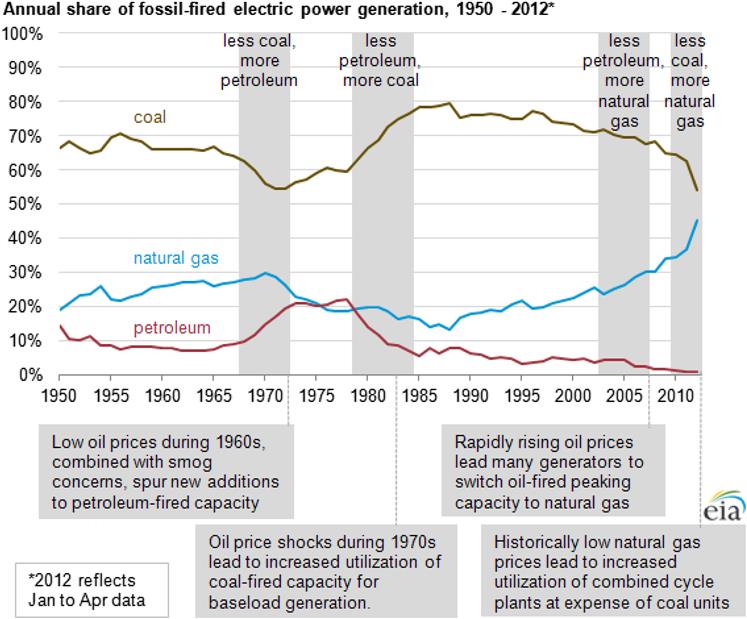
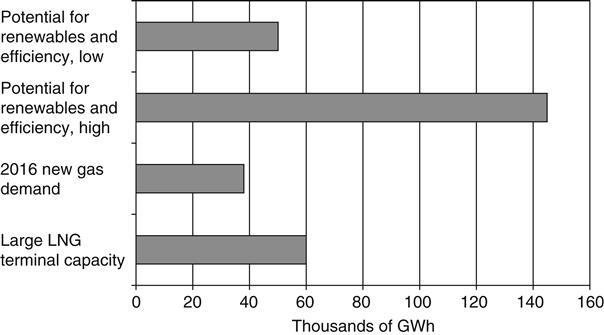
California’s Renewable Energy Potential
Table 18–2 depicts the energy production under the mandated, or likely to be mandated, renewable energy goals in California.
TABLE 18–2
California’s Current and Prospective Renewable Energy Mandates [18-2]
| Mandate | Generation (GWh) | 2016 New Gas Demand | Equivalent Large LNG Terminals |
| 20% by 2010 | 29,533a | (Already included) | 49% |
| 30% by 2016 | 32,781b | 87% | 55% |
| 33% by 2020 | 47,323c | 125% | 79% |
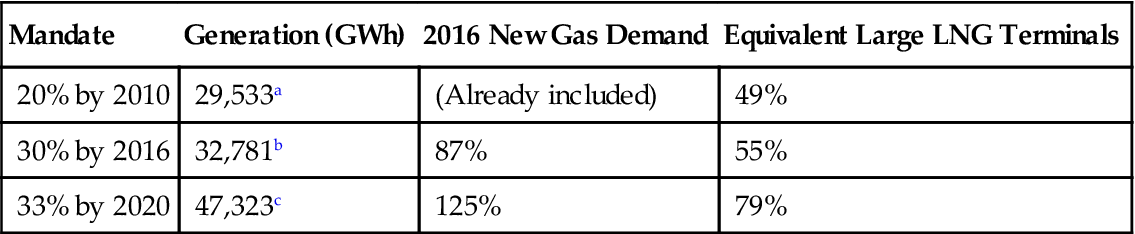
a20% of projected 2010 electricity demand.
bThis figure does not include the 20% by 2010 amount, so represents new generation above the 20% RPS goal
cThis figure represents the total new generation by 2020, not already accounted for in the 2010 RPS goal.
Is California’s Renewable Energy Market Viable?
The following sections discuss estimates of California’s renewable energy potential, from the Energy Commission and other reliable sources. Table 18–3 summarizes the potential from the various renewable resources in California.
TABLE 18–3
California’s Renewable Energy Potential [18-2]
| Resource | Estimated Generation by 2017a (GWh) | 2016 New Gas Demand | Equivalent Large LNG Import Terminals |
| Wind | 19,760b | 52% | 33% |
| Solar PV | 4,139c | 11% | 7% |
| Solar thermal | NAd | NA | NA |
| Concentrating solar | 18,615e | 49% | 31% |
| Geothermal | 22,654f | 60% | 38% |
| Biomass/landfill gas | 35,000g | 93% | 58% |
| Small hydroelectric | 2,947h | 8% | 5% |
| Ocean power | 4,728i | 12% | 8% |
| Totals | 107,843 | 285% | 180% |
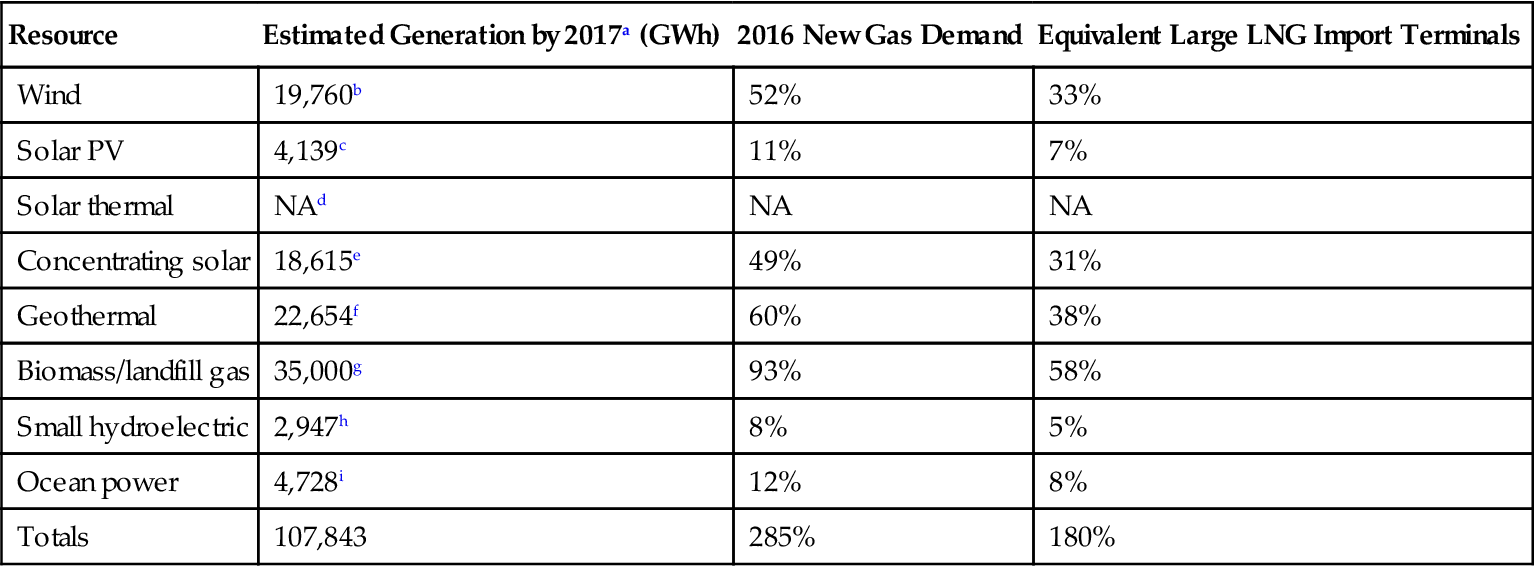
aWe project new generation through 2017, instead of 2016, which is the time frame for the Energy Commission’s natural gas assessment, because state agencies have done a considerable amount of work looking at potential by 2017, which was the original date for achieving the 20% RPS. Due to the large leeway our numbers provide in meeting future natural gas demands from renewable energy, this one year discrepancy should not be that important.
bCalifornia Energy Commission, Renewable Resources Development Report, 2003 (RRDR), p. 98 (estimating 6644 MW of new wind projects throughout California by 2017). The CPUC report, Achieving a 33% Renewable Energy Target (Nov. 2005), finds a larger potential of 6960 MW in California (it also includes consideration of nearby out-of-state resources as a separate figure), plus a separate figure for potential from repowering wind turbines at Altamont Pass (p. 39). We use the lower estimate for present purposes because the CPUC report does not state that this full potential could be developed by 2016, the timeframe for our analysis.
cBased on the California Solar Initiative’s stated goal, with rebates likely to be approved by the California Public Utilities Commission in January 2006, of 3000 MW of new solar, in addition to the approximately 150 MW already installed in California. This production figure assumes a 15% capacity factor. The CPUC report Achieving a 33% Renewable Energy Target finds a 5000 MW capacity for solar PV (p. 41). We find the lower figure more realistic at this time, but are optimistic that 5000 MW or more will be installed, given the rapid pace of innovation in this technology.
dThe California Energy Commission does not currently provide an estimate of solar thermal potential in California, either in its 2005 draft solar power assessment or its 2003 renewable resources development report. We hope this oversight will be corrected soon, as solar thermal technologies have vast potential for displacing natural gas and electricity demand, as evidenced by the fact that the largest source of renewable energy in the world (other than large hydroelectric, which is not considered renewable in California) is solar thermal, due largely to the numerous installations in China.
eThe California Energy Commission estimates 1 million MW of concentrating solar potential in its 2005 draft staff paper on California solar resources, but we don’t believe, for obvious reasons, that anywhere near this amount of CSP will be built by 2017 or even 2027. We have assumed that 10 systems like the 850 MW CSP facility recently approved for SCE by the PUC could be built by 2017, leading to a total of 8,500 MW of CSP by 2017, and 18,615 GWh per year by 2017, at a 25% capacity factor. The CPUC report Achieving a 33% Renewable Energy Target finds a similar potential, at 10,200 MW (p. 41).
fCalifornia Energy Commission, California Geothermal Resources, CEC-500-2005-070, April 2005, p. 7. The GWh total assumes, as the CEC does, a 90% capacity factor for 2862 MW. The CPUC report Achieving a 33% Renewable Energy Target (Nov. 2005) finds a similar figure of 2565 MW of potential in California (p. 40).
gCalifornia Energy Commission, Biomass Resources in California: Preliminary 2005 Assessment (April 2005), p. v. The figure cited is the low estimate in that report. The CPUC report Achieving a 33% Renewable Energy Target finds a much lower potential, at 1,775 MW, equivalent to 13,994 GWh (p. 40). The report explained this discrepancy: “Biomass power in general has favorable economics. But the development potential of biomass is contingent on securing long-term fuel supplies, with each project requiring a narrow range of fuel specification. Biomass projects tend to be of modest scale and linked geographically to local fuel sources. For these reasons, biomass was only projected to supply 10% of the renewable energy needs” (p. 42). We use the higher estimate due to our expectation that reliable baseload capacity will be developed where it is economically feasible, making biomass generation very attractive where feedstock is available, and due to the more detailed (and more convincing) analysis in the CEC’s Biomass Resources report.
hCalifornia Energy Commission, draft report, “California Small Hydropower and Ocean Energy Resources” (May 2005), p. 4.
iIbid., p. 16. We ignore the secondary sites identified in this report and assume that only 25% of the primary site potential identified by the Energy Commission will be developed by 2017.
Wind
In 2004, California generated 4258 GWh of electricity using wind power, 1.5% of the gross system power and equivalent to about 7 of a large LNG import terminal.
Expanding wind power capacity from the 2,096 MW of capacity in 2004 to about 8,540 MW in 2017, as is expected by the Energy Commission, would produce 19,760 GWh per year, equivalent to 33% of a large LNG import terminal. The technical potential for wind power is of course much larger—the Energy Commission recently estimated 127,000 MW of potential in the state.
Solar
Solar energy is another renewable resource that is easily accessible in many parts of California with significant expansion potential. The technical potential for photovoltaic and concentrating solar power systems in California exceeds 17 million MW. The state currently has about 60,000 MW of generation capacity.
Geothermal
Though wind and solar resources have perhaps the largest potential in California, geothermal, biomass, and small hydroelectric facilities currently contribute more to California’s total renewable energy resource base. Geothermal power contributed 13,571 GWh, or about 4.9% of the gross system power in 2004.
Biomass and Waste to Energy
Biomass energy is generated from organic wastes such as woody agricultural wastes and forest thinnings. Biomass power plants provided 5997 GWh of electricity in California in 2004–about 2.2% of the gross system power. In its 2005 updated biomass assessment, the Energy Commission found an additional technical potential of 4700 MW of biomass power by 2017, using current technologies.
Small Hydroelectric
Small hydroelectric plants (30 MW capacity or less) are considered renewable due to the relatively small amount of water required for their operation and consequent minimal environmental impacts when compared to large hydroelectric projects. In 2004, about 1.7% of the electricity generated in California was produced by small hydroelectric plants. Small hydroelectric power potential is estimated at 2280 GWh from new facilities,16 plus 667 GWh from water pipelines among municipal water utilities and irrigation districts.
Ocean Power
The ocean is also a viable resource for energy production, especially in California. Wave power along the coast—from surface wave energy conversion alone—has a technical potential of 18,912 GWh, at primary sites only.
Additional Supplies of Natural Gas in North America
(Author’s note: This study was made without consideration of the now prevalent fracking “gold rush” that has captured the United States as a whole, if not California to the same degree. The reader needs to consider the following in that light).
It is certainly possible that the state will not meet its renewable energy mandates by 2010, let alone the likely new mandate of 3% by 2020. It is even possible that the CPUC’s ambitious and funded energy efficiency programs with the investor-owned utilities will not produce expected savings.
However, even if the state slips in meeting its own mandates, California need not be overly concerned about natural gas supplies, as significant additional supplies will come online in North America in the next decade from a number of sources:
• Domestic U.S. natural gas production is expected to increase over the next decade, while Canadian imports are projected to decrease. However, the decrease from Canada is projected to be more than offset by increases in U.S. production.16
• A consortium of oil companies has proposed a natural gas pipeline from Alaska and Canada to the contiguous United States. This project will provide 1.5–2.0 trillion cubic feet of natural gas per year and should be completed by 2016. If completed, this pipeline would forestall the apparent peak in North American natural gas production by a number of years because it would provide access to otherwise stranded natural gas resources.
• An additional pipeline, from the MacKenzie region of Canada’s Yukon, is expected to be online by 2013. (Authors Note: As Canadian pipelines come online that forestalls by the number of years the anticipated declines in Canadian production. Also check http://www.capp.ca/canadaIndustry/oil/Pages/PipelineMap.aspx for current updates).
Tables 18–4 and 18–5 summarize the energy efficiency and renewable energy potential in California.
TABLE 18–4
Summary of Energy Efficiency and Renewable Energy Mandates [18-2]
| Low Estimate | High Estimate | |
| Energy efficiency mandates (GWh) | 12,881 | 12,881 |
| Renewable energy mandates (GWh) | 29,533 | 64,781a |
| Total (GWh) percent of a large LNG import terminal | 42,414 | 77,662 |
| 71% | 129% |
aThis figure represents 32,781 GWh of new generation by 2016 plus 32,000 GWh already included in the Energy Commissions’ natural assessment, representing new renewable generation by 2010.