
In this chapter, you will learn about. . .
The Operations Function
The Evolution of Operations and Supply Chain Management
Globalization
Productivity and Competitiveness
Strategy and Operations
Organization of This Text
Learning Objectives of This Course
Web resources for this chapter include
OM Tools Software
Internet Exercises
Online Practice Quizzes
Lecture Slides in PowerPoint
Virtual Tours
Excel Exhibits
Company and Resource Weblinks
www.wiley.com/college/russell

Operations management designs, operates, and improves productive systems—systems for getting work done. The food you eat, the movies you watch, the stores in which you shop, and the books you read are provided to you by the people in operations. Operations managers are found in banks, hospitals, factories, and government. They design systems, ensure quality, produce products, and deliver services. They work with customers and suppliers, the latest technology, and global partners. They solve problems, reengineer processes, innovate, and integrate. Operations is more than planning and controlling; it's doing. Whether it's superior quality, speed-to-market, customization, or low cost, excellence in operations is critical to a firm's success.
• Operations management: the design, operation, and improvement of productive systems.
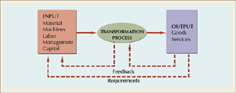
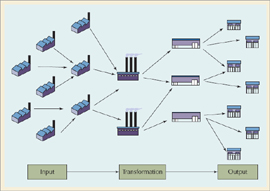
Operations is often defined as a transformation process. As shown in Figure 1.1, inputs (such as material, machines, labor, management, and capital) are transformed into outputs (goods and services). Requirements and feedback from customers are used to adjust factors in the transformation process, which may in turn alter inputs. In operations management, we try to ensure that the transformation process is performed efficiently and that the output is of greater value than the sum of the inputs. Thus, the role of operations is to create value. The transformation process itself can be viewed as a series of activities along a value chain extending from supplier to customer.
• Operations: a function or system that transforms inputs into outputs of greater value.
The input–transformation–output process is characteristic of a wide variety of operating systems. In an automobile factory, sheet steel is formed into different shapes, painted and finished, and then assembled with thousands of component parts to produce a working automobile. In an aluminum factory, various grades of bauxite are mixed, heated, and cast into ingots of different sizes. In a hospital, patients are helped to become healthier individuals through special care, meals, medication, lab work, and surgical procedures. Obviously, "operations" can take many different forms. The transformation process can be
• Value chain: a series of activities from supplier to customer that add value to a product or service.
physical, as in manufacturing operations;
locational, as in transportation or warehouse operations;
exchange, as in retail operations;
physiological, as in health care;
psychological, as in entertainment; or
informational, as in communication.
Activities in operations management (OM) include organizing work, selecting processes, arranging layouts, locating facilities, designing jobs, measuring performance, controlling quality, scheduling work, managing inventory, and planning production. Operations managers deal with people, technology, and deadlines. These managers need good technical, conceptual, and behavioral skills. Their activities are closely intertwined with other functional areas of a firm.
ALONG THE SUPPLY CHAIN
What Do Operations and Supply Chain Managers Do?
Operations managers are the improvement people, the realistic, hard-nosed, make-it-work, get-it-done people; the planners, coordinators, and negotiators. They perform a variety of tasks in many different types of businesses and organizations. developing and implementing balanced scorecards and benchmarking reports; designing clinical studies of new medication effectiveness; and conducting training sessions on process mapping and analysis. Claire Thielen improves quality, productivity, and information in the health-care industry.


Ada Liu is a division manager for Li & Fung, a global sourcing company. She coordinates global production and distribution for major players in the garment industry. For one particular trouser order, she had the fabric woven in China (for their unique dyeing process), chose fasteners from Hong Kong and Korea (for their durability), and sent the raw materials to Guatemala for sewing (for their basic skills, low cost, and proximity to the United States). If problems should arise, Liu can reroute the order to one of its 7,500 suppliers in 37 countries. Ada Liu is a supply chain expert for Li & Fung.
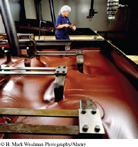
Erin Hiller is a food technologist at a major chocolate manufacturer. She supports product, process, and cost improvement activities across various product lines in the manufacturing facilities. She undertakes, initiates, and coordinates projects for determining process capabilities, reducing waste and rework, and improving both quality and productivity. She evaluates new and emerging technologies and determines whether they would be beneficial to the product lines and manufacturing operations. Erin Hiller keeps operations up-to-date and running smoothly for making chocolate.
Sources: Claire Theilen, LinkedIn, accessed January 10, 2010; Joanne Lee-Young, "Furiously Fast Fashions." The Industry Standard Magazine, (June 22, 2001); Job posting, http://jobview.monster.com/ Food-Technologist-Confectionery-Chocolate-Experience-Job, accessed January 10, 2010 (fictional name).
Let's meet Claire Thielen, director of informatics at ARAMARK Healthcare; Ada Liu, division manager for Li & Fung Trading Company; and Erin Hiller, food technologist at a major chocolate manufacturer.
Claire Thielen is a health-care professional who specializes in decision support, process improvement, and organizational performance. She facilitates interdisciplinary teams as they pursue continuous quality improvement projects and analyzes methods and systems for managing information. Her projects include determining staffing patterns and workflow for computerized scheduling systems; consolidating policies, procedures, and practices for hospital mergers;
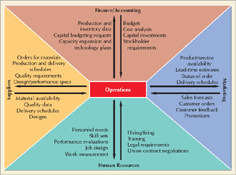
The four primary functional areas of a firm are marketing, finance, operations, and human resources. As shown in Figure 1.2, for most firms, operations is the technical core or "hub" of the organization, interacting with the other functional areas and suppliers to produce goods and provide services for customers. For example, to obtain monetary resources for production, operations provides finance and accounting with production and inventory data, capital budgeting requests, and capacity expansion and technology plans. Finance pays workers and suppliers, performs cost analyses, approves capital investments, and communicates requirements of shareholders and financial markets. Marketing provides operations with sales forecasts, customer orders, customer feedback, and information on promotions and product development. Operations, in turn, provides marketing with information on product or service availability, lead-time estimates, order status, and delivery schedules. For personnel needs, operations relies on human resources to recruit, train, evaluate, and compensate workers and to assist with legal issues, job design, and union activities. Outside the organization operations interacts with suppliers to order materials or services, communicate production and delivery requirements, certify quality, negotiate contracts, and finalize design specifications.
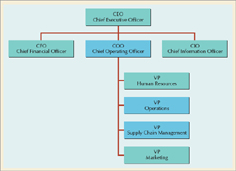
As a field of study, operations brings together many disciplines and provides an integrated view of business organizations. Operations managers are in demand in business, industry, and government. Chief operating officers (COOs) run major corporations as shown in Figure 1.3, Vice-presidents of Operations and Supply Chain Management oversee scores of departments, facilities, and employees. Typical jobs for new college graduates include business process analyst, inventory analyst, project coordinator, unit supervisor, supply chain analyst, materials manager, quality assurance specialist, production scheduler, and logistics planner. Even if you do not pursue a career in operations, you'll be able to use the ideas you learn in this course to organize work, ensure quality, and manage processes. Regardless of your major, you can apply some aspect of operations management to your future career—as did Mark, Nicole, John, Vignesh, Margie, and Anastasia who tell their stories in Figure 1.4 and the OM Dialogues dispersed throughout the text. Let's hear first from Mark Jackson, marketing manager for Pizza Hut.

MARK JACKSON,

As regional marketing manager for Pizza Hut, I'm responsible for 21 stores. It's my job to make sure each store is operating properly and, when new products come out, to see that they are given the attention they deserve. I also coach managers and employees about their job and their relationship with the customer.
You would think that a marketing manager's job would be concerned solely with advertising, special promotions, store signage, customer service, and the like. But we also deal with quality, forecasting, logistics, and other operational issues. Marketing and operations are almost inseparable in services. We can come out with a new product and spend mega bucks advertising it, but if the product is not made or delivered properly, all is lost.
The most important aspect of quality is consistency—so that the customer gets the same pizza at any Pizza Hut from whichever cook happens to be on shift. We have exact standards and specifications for our products, and it's important that operating procedures be followed.
Scheduling is somewhat of a headache because of staff turnover and individual limitations on working hours. Some of that is alleviated in our new system where we allow employees to request days off up to six months in advance. They can put requests into the system when they clock in each day, and they can view upcoming schedules.
Our forecasting system keeps historical data on sales by hour and day of the week five years back. Forecasts are weighted averages of past demand—usually 60% of the past two weeks' sales and 40% of the past six weeks' sales. A manager can freeze the forecast and make manual adjustments, such as increasing demand during a home football game weekend or when a local festival is under way. Managers can also enter notes into the system when unusual occurrences affect demand, like a snowstorm. When the forecast is set, it generates a labor plan for the week, along with prep plans for salad, dough, breadsticks, and so forth. The labor plan just specifies the number of workers needed; it is up to the manager to do the detailed scheduling of individuals.
After quality, it's all about speed of delivery—whether to the customer's table or to the customer's home. We have initiatives such as Ready for Revenue where we presauce and pre-cheese in anticipation of customer orders, and Aces in Their Places where we make sure the best people are scheduled and ready to go for peak demand periods. As for delivery, we keep track of percent of deliveries under 39 minutes and percent of deliveries to promise. We found we could significantly reduce the number of drivers needed (and keep the same customer satisfaction numbers) by promising delivery within 39 minutes rather than 30. We also are more efficient now that dispatching divides our delivery areas into delivery pods and uses computerized estimates of transit time.
Now that you are aware of how operations might relate to your interests, let's take a brief look at how the field of OM has evolved to its present state.
Although history is full of amazing production feats—the pyramids of Egypt, the Great Wall of China, the roads and aqueducts of Rome—the widespread production of consumer goods—and thus, operations management—did not begin until the Industrial Revolution in the 1700s. Prior to that time, skilled craftspersons and their apprentices fashioned goods for individual customers from studios in their own homes. Every piece was unique, hand-fitted, and made entirely by one person, a process known as craft production. Although craft production still exists today, the availability of coal, iron ore, and steam power set into motion a series of industrial inventions that revolutionized the way work was performed. Great mechanically powered machines replaced the laborer as the primary factor of production and brought workers to a central location to perform tasks under the direction of an "overseer" in a place called a "factory." The revolution first took hold in textile mills, grain mills, metalworking, and machine-making facilities.
Around the same time, Adam Smith's Wealth of Nations (1776) proposed the division of labor, in which the production process was broken down into a series of small tasks, each performed by a different worker. The specialization of the workers on limited, repetitive tasks allowed them to become very proficient at those tasks and further encouraged the development of specialized machinery.
The introduction of interchangeable parts by Eli Whitney (1790s) allowed the manufacture of firearms, clocks, watches, sewing machines, and other goods to shift from customized one-at-a-time production to volume production of standardized parts. This meant the factory needed a system of measurements and inspection, a standard method of production, and supervisors to check the quality of the worker's production.
• Craft production: the process of handcrafting products or services for individual customers.
• Division of labor: dividing a job into a series of small tasks each performed by a different worker.
• Interchangeable parts: the standardization of parts initially as replacement parts enabled mass production.
Advances in technology continued through the 1800s. Cost accounting and other control systems were developed, but management theory and practice were virtually nonexistent.
In the early 1900s an enterprising laborer (and later chief engineer) at Midvale Steel Works named Frederick W. Taylor approached the management of work as a science. Based on observation, measurement, and analysis, he identified the best method for performing each job. Once determined, the methods were standardized for all workers, and economic incentives were established to encourage workers to follow the standards. Taylor's philosophy became known as scientific management. His ideas were embraced and extended by efficiency experts Frank and Lillian Gilbreth, Henry Gantt, and others. One of Taylor's biggest advocates was Henry Ford.
Henry Ford applied scientific management to the production of the Model T in 1913 and reduced the time required to assemble a car from a high of 728 hours to 1½ hours. A Model T chassis moved slowly down a conveyor belt with six workers walking alongside it, picking up parts from carefully spaced piles on the floor and fitting them to the chassis.[1] The short assembly time per car allowed the Model T to be produced in high volumes, or "en masse," yielding the name mass production.
American manufacturers became adept at mass production over the next 50 years and easily dominated manufacturing worldwide. The human relations movement of the 1930s, led by Elton Mayo and the Hawthorne studies, introduced the idea that worker motivation, as well as the technical aspects of work, affected productivity. Theories of motivation were developed by Frederick Herzberg, Abraham Maslow, Douglas McGregor, and others. Quantitative models and techniques spawned by the operations research groups of World War II continued to develop and were applied successfully to manufacturing and services. Computers and automation led still another upsurge in technological advancements applied to operations. These events are summarized in Table 1.1.
From the Industrial Revolution through the 1960s, the United States was the world's greatest producer of goods and services, as well as the major source of managerial and technical expertise. But in the 1970s and 1980s, industry by industry, U.S. manufacturing superiority was challenged by lower costs and higher quality from foreign manufacturers, led by Japan. Several studies published during those years confirmed what the consumer already knew—U.S.-made products of that era were inferior and could not compete on the world market. Early rationalizations that the Japanese success in manufacturing was a cultural phenomenon were disproved by the successes of Japanese-owned plants in the United States, such as the Matsushita purchase of a failing Quasar television plant in Chicago from Motorola. Part of the purchase contract specified that Matsushita had to retain the entire hourly workforce of 1000 persons. After only two years, with the identical workers, half the management staff, and little or no capital investment, Matsushita doubled production, cut assembly repairs from 130% to 6%, and reduced warranty costs from $16 million a year to $2 million a year. You can bet Motorola took notice, as did the rest of U.S. industry.
The quality revolution brought with it a realization that production should be tied to consumer demand. Product proliferation, shortened product lifecycles, shortened product development times, changes in technology, more customized products, and segmented markets did not fit mass production assumptions. Using a concept known as just-in-time, Toyota changed the rules of production from mass production to lean production, a system that prizes flexibility (rather than efficiency) and quality (rather than quantity).
The renewed emphasis on quality and the strategic importance of operations made some U.S. companies competitive again. Others continued to stagnate, buoyed temporarily by the expanding economies of the Internet era and globalization. Productivity soared as return on investment in information technology finally came to fruition. New types of businesses and business models emerged, such as Amazon, Google, and eBay, and companies used the Internet to connect with customers and suppliers around the world. The inflated expectations of the dot-com era came to an end and, coupled with the terrorist attacks of 9-11 and their aftermath, brought many companies back to reality, searching for ways to cut costs and survive in a global economy. They found relief in the emerging economies of China and India, and began accelerating the outsourcing of not only goods production, but services, such as information technology, call centers, and other business processes. The outsourcing of business processes brought with it a new awareness of business-to-business (B2B) services and the need for viewing services as a science.
• Scientific management: the systematic analysis of work methods.
• Mass production: the high-volume production of a standardized product for a mass market.
• Quality revolution: an emphasis on quality and the strategic role of operations.
• Lean production: an adaptation of mass production that prizes quality and flexibility.
Table 1.1. Historical Events in Operations Management
With more and more activities taking place outside the enterprise in factories, distribution centers, offices and stores overseas, managers needed to develop skills in coordinating operations across a global supply chain. The field of supply chain management was born to manage the flow of information, products, and services across a network of customers, enterprises, and supply chain partners. In Figure 1.1, we depicted operations as a transformation process. Extending that analogy in Figure 1.5, supply chain management concentrates on the input and output sides of transformation processes. Increasingly, however, as the transformation process is performed by suppliers who may be located around the world, the supply chain manager is also concerned with the timeliness, quality, and legalities of the supplier's operations.
• Supply chain management: managing the flow of information, products, and services across a network of customers, enterprises, and suppliers.
The era of globalization was in full swing in 2008 when a financial crisis brought on by risky loans, inflated expectations, and unsavory financial practices brought the global economy to a standstill. Operations management practices based on assumptions of growth had to be reevaluated for declining markets and resources. At the same time, concerns about global warming (worldwide) and health-care operations (domestically) ramped up investment and innovation in those fields.
It is likely that the next era in the evolution of OM will be the Green Revolution, which some companies and industries are embracing wholeheartedly, while others are hesitant to accept. We discuss green initiatives at length later in the text. The next section presents a brief discussion of globalization.
The Green Revolution is the next era in OM.
Two thirds of today's businesses operate globally through global markets, global operations, global financing, and global supply chains. Globalization can take the form of selling in foreign markets, producing in foreign lands, purchasing from foreign suppliers, or partnering with foreign firms. Companies "go global" to take advantage of favorable costs, to gain access to international markets, to be more responsive to changes in demand, to build reliable sources of supply, and to keep abreast of the latest trends and technologies.
Falling trade barriers and the Internet paved the way for globalization. The World Trade Organization (WTO) has opened up the heavily protected industries of agriculture, textiles, and telecommunications, and extended the scope of international trade rules to cover services, as well as goods. The European Union (EU) required that strict quality and environmental standards be met before companies can do business with member countries. Strategic alliances, joint ventures, licensing arrangements, research consortia, supplier partnerships, and direct marketing agreements among global partners have proliferated.
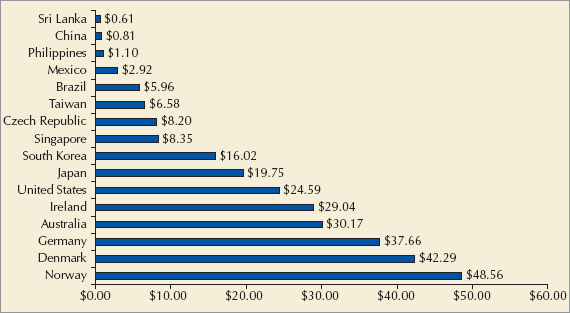
Figure 1.6. Hourly Compensation Costs for Production Workers (in U.S. Dollars): Source: Bureau of Labor Statistics, International Comparisons of Hourly Compensation Costs in Manufacturing 2007, Washington, DC: March 26, 2009, p. 23.
Figure 1.6 shows the hourly wage rates in U.S. dollars for production workers in nine countries. Wage rates in Norway are the highest at $48.56 an hour, with comparable rates in Denmark. The United States and Japan pay workers $24.59 and $19.75 an hour, respectively, while China and Sri Lanka exhibit the lowest wage rates of $0.81 and $0.61 an hour. To put the wage differentials in perspective, a U.S. worker receives roughly the equivalent sum of money for working one hour as a Sri Lankan worker earns in a 40-hour week ($24.40). China's wage rate is $32.40 a week. Not surprisingly, much of the world has moved its manufacturing to Asia, in particular to the large and populous country of China.
China accounts for 20% of the world's population and is the world's largest manufacturer, employing more production workers than the Unites States, United Kingdom, Germany, Japan, Italy, Canada, and France combined. Its 1.3 billion people represent not only an immense labor market, but a huge consumer market as well. As China's industrial base multiplies, so does its need for machinery and basic materials, and as more companies move to China, so do their suppliers and their supplier's suppliers. Although initially the preferred location for the production of low-tech goods such as toys, textiles, and furniture, China has become a strategic manufacturing base for nearly every industry worldwide.
The scale of manufacturing in China is mind-boggling. For example, Foxconn (the trade name of Taiwan's Hon Hai Precision Industry Company) has two enormous industrial complexes in mainland China. The Guangdong Province site employs and houses approximately 270,000 workers, with its own dormitories, restaurants, hospital, police force, chicken farm, and soccer stadium. There are 40 separate production facilities "on campus," each dedicated to one of its major customers such as Apple, Dell, Motorola, Sony, Nintendo, and HP. Foxconn is the world's largest electronics manufacturer and China's largest exporter. It also represents a shorter supply chain because it makes components as well as assembles final products. Currently, Foxconn is making a bid to enter the retail market in China and is expanding production into Mexico to better serve the U.S. market.
Figure 1.7 shows the gross domestic product (GDP) per capita for the United State and the largest emerging economies. China's GDP per capita is about 12% of the U.S. level. However, as shown in Figure 1.8, China's trade as a percent of GDP is almost triple that of the United States. Having a producer economy and healthy trade balance is an advantage in a global slump. China has problems with pollution, quality, and corruption but is steering its way out of the recession and entering into what it calls "the decade of China."
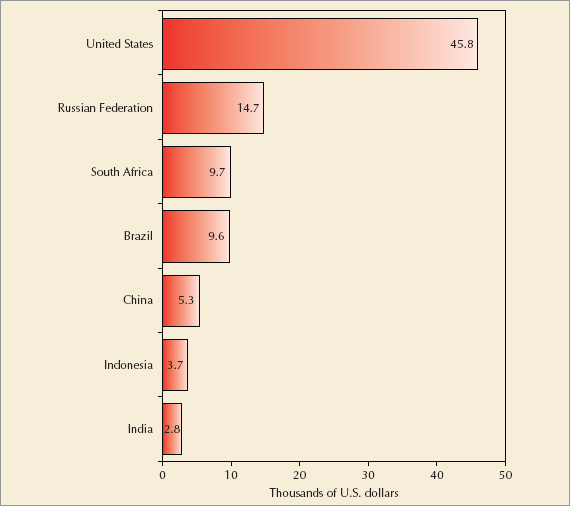
Figure 1.7. GDP per Capita: Source: U.S. Department of Labor, A Chartbook of International Labor Comparisons, Washington, DC: March 2009, p. 39.
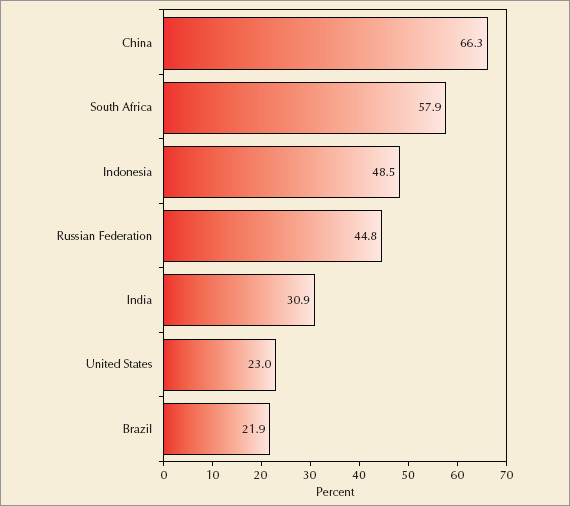
Figure 1.8. Trade in Goods as a Percent of GDP: Source: U.S. Department of Labor, A Chartbook of International Labor Comparisons, Washington, DC: March 2009, p. 43.
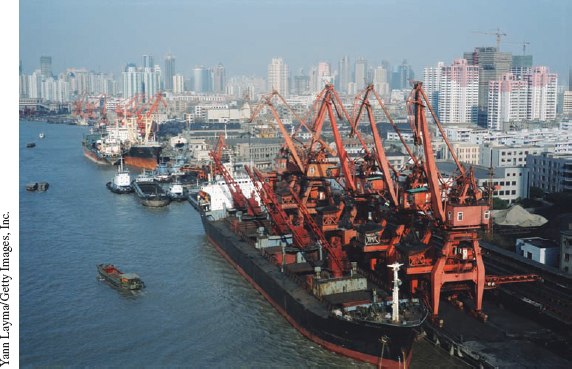
With over 18 million people, 5,000 skyscrapers, and the world's largest deep sea container port, Shanghai is China's largest city, and the financial heart of the burgeoning economy.
While China's manufacturing prowess may seem unbeatable, many companies have sought to reduce the risk of sourcing from only one country by expanding trade relationships with other low-cost countries, particularly India, Bangladesh, Pakistan, Vietnam, and to a lesser extent, Indonesia and Eastern Europe. Because of its proximity to the United States, Mexico and several Central American countries are popular sources for shorter lifecycle products.
Whether or not a company decides to do business with China, every company must consider the implications of the "China factor" on their profitability and competitive position. Managing global operations and quality in a far-reaching supply chain is an added challenge for operations and supply chain managers. Keeping domestic production competitive is an even bigger challenge. The New Balance "Along the Supply Chain" box shows how one company has met that challenge.
ALONG THE SUPPLY CHAIN
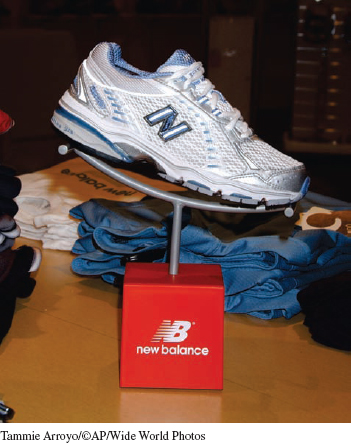
The Balancing Act at New Balance
Boston-based New Balance Corporation is a nonconformist in many ways. It refuses to hire superstars to endorse its product, it shuns style in favor of performance, it holds fast to its emphasis on running shoes, and it is committed to manufacturing at least some of its product in the United States. New Balance currently has five factories in the United States, the last of its kind of makers of athletic shoes. It also has wholly-owned subsidiaries in 13 countries and a number of licensees, joint ventures, and distributors all over the globe.
Of its domestic production, owner Jim Davis says "it's part of the company's culture to design and manufacture here." Producing close to their customers also allows quick turnarounds on new designs and order fulfillment. At New Balance's factory in Norridgewock, Maine, well-trained employees make $14 an hour working in small teams performing half-a-dozen different jobs and switching tasks every few minutes. They operate computerized sewing equipment and automated stitchers that allow one person to do the work of 20.
New Balance is able to remain competitive at home by creatively adapting new technologies to shoemaking and constantly training their employees in teamwork and technical skills. Employees start with 22 hours of classroom training on teamwork and get constant training on the factory floor. They work in teams of five or six, sharing tasks and helping one another to make sure everything gets done. Many of the ideas for process improvement come from shop floor workers.
Says Davis, "In Asia, their labor is so inexpensive that they waste it. Ours is so dear that we come up with techniques to be very efficient." Borrowing technology from apparel manufacturers, New Balance purchased 70 see-and-sew machines for $100,000 each and set up on-site machine shops to grind the 30 templates needed for a typical shoe. Making each set of templates takes about a week, but they allow workers to produce a pair of shoes in 24 minutes, versus 3 hours in China. Labor cost per shoe is $4 an hour in Maine compared to $1.30 in China. The $2.70 labor cost differential is a manageable 4% of the $70 selling price.
Staying involved with the manufacturing process helps New Balance develop better designs, improve quality, and innovate their processes, capabilities the company would lose if it outsourced all of its production. But staying in one country is not advantageous either, especially when a 10% market share of athletic shoes in China would be the equivalent of 100 million customers. New Balance relaunched a China strategy to prepare for the 2008 Beijing Olympic Games. To sell in China, it is necessary to produce there.
The company's earlier foray into outsourcing on the mainland was not a good experience. In one of the most notorious cases of counterfeiting, New Balance's own supplier flooded the market with unauthorized New Balance footwear and continued to do so even after the contact was canceled. New Balance spent millions of dollars in legal fees and lost millions more in sales without a satisfactory resolution to the problem. Today, the company has reduced the number of Asian suppliers and monitors them more closely. New Balance continues the balancing act between domestic and foreign production, and strives to produce closer to its markets, wherever in the world they might be.
Think about the differences between New Balance and Nike. How has each company chosen to compete? What types of shoes might New Balance want to make in its own factories? What types of shoes might it outsource?
Sources: Gabriel Kahn. "A Sneaker Maker Says China Partner Became Its Rival," The Wall Street Journal (December 19, 2002), pp. A1, A8; "New Balance Shoots for Second in Local Market," China Daily (November 13, 2003); "A Balancing Act," Business and Industry (February 11, 2004), p. 22; Anne Thompson, "Companies Buck the Outsorcing Trend," NBC News (May 12, 2006); New Balance Web site, http://www.newbalance.com/usa/
Although we may think of globalization more in the context of products than services, there has been a dramatic rise in the global outsourcing of services as well. It began with backoffice work such as accounting, claims processing, and computer programming. Now it extends to call centers, brokerage firms, financial analysis, research and development, engineering, medical diagnosis, architectural design, and more advanced work in information technology. As much as China is known as the world's manufacturer, India is renowned for its export of services.
India has an enormous resource of highly skilled engineers, scientists, and technically trained workers available at less than half the cost of those located in developed countries.
In 2009, India exported $47 billion in IT services, a number that is expected to reach $200 billion by 2020. Indian companies, such as WIPRO, Infosys, and Tata Consultancy Services, are world leaders in software development and business processes, with plenty of room to expand. Some of that expansion is taking place in client countries, such as the United States. At the same time, multinational companies are setting up shop and expanding in India. IBM, the largest multinational company in India, employs 70,000 IT workers and is hiring an additional 5,000 workers in 2010.
China and India are not the only popular outsourcing venues. Increased outsourcing competition comes from other low-cost countries such as the Philippines, Vietnam, Malaysia, Mexico, Brazil, and Eastern Europe. In addition, many companies are bringing their supply chain closer to home, a concept known as near-sourcing.
All this means that the dynamic nature of global competition is accelerating, and companies need to fight harder to remain competitive. Operations and supply chain managers are an important part of that fight, whether it's maintaining overseas operations, coordinating supply chains, negotiating contracts, or monitoring quality. In the next section, we explore the concepts of competitiveness, and its surrogate, productivity.
A global marketplace for products and services means more customers and more intense competition. In the broadest terms, we speak of competitiveness in reference to other countries rather than to other companies. That's because how effectively a nation competes in the global marketplace, affects the economic success of the nation and the quality of life for its citizens. The OECD (Organization for Economic Cooperation and Development) defines competitiveness as "the degree to which a nation can produce goods and services that meet the test of international markets while simultaneously maintaining or expanding the real incomes of its citizens." The most common measure of competitiveness is productivity. Increases in productivity allow wages to grow without producing inflation, thus raising the standard of living. Productivity growth also represents how quickly an economy can expand its capacity to supply goods and services.
Productivity is calculated by dividing units of output by units of input.
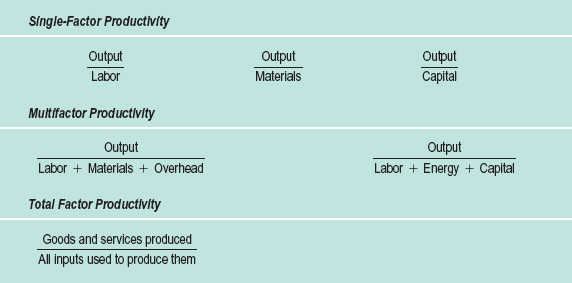
Output can be expressed in units or dollars in a variety of scenarios, such as sales made, products produced, customers served, meals delivered, or calls answered. Single-factor productivity compares output to individual inputs, such as labor hours, investment in equipment, material usage, or square footage. Multifactor productivity relates output to a combination of inputs, such as (labor + capital) or (labor + capital + energy + materials). Capital can include the value of equipment, facilities, inventory, and land. Total factor productivity compares the total quantity of goods and services produced with all the inputs used to produce them. These productivity formulas are summarized in Table 1.2.
• Competitiveness: the degree to which a nation can produce goods and services that meet the test of international markets.
• Productivity: the ratio of output to input.
Calculating Productivity
Osborne Industries is compiling the monthly productivity report for its Board of Directors. From the following data, calculate (a) labor productivity, (b) machine productivity, and (c) the multifactor productivity of dollars spent on labor, machine, materials, and energy. The average labor rate is $15 an hour, and the average machine usage rate is $10 an hour.
Units produced | 100,000 |
Labor hours | 10,000 |
Machine hours | 5,000 |
Cost of materials | $35,000 |
Cost of energy | $15,000 |
Solution
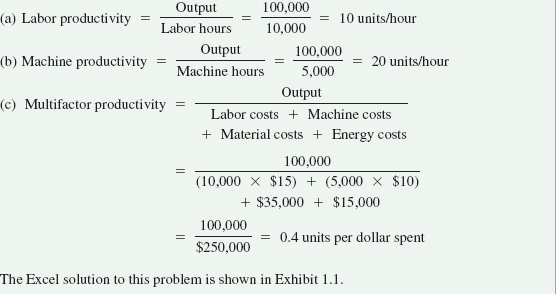
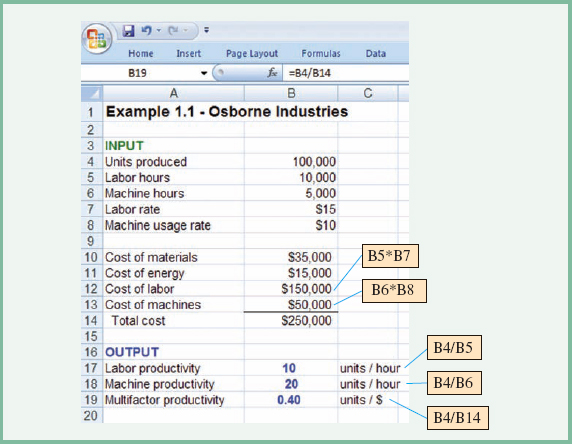
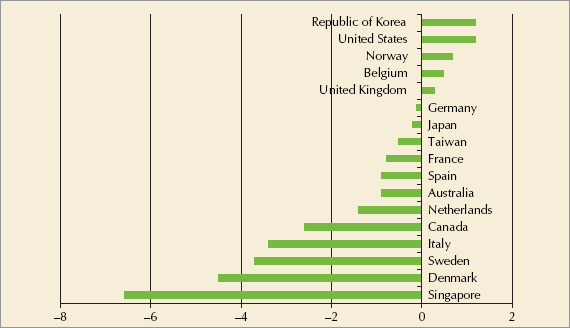
Figure 1.9. Productivity Growth, 2008 (output per labor hours): Source: U.S. Bureau of Labor Statistics. International Comparisons of Manufacturing Productivity and Unit Labor Costs—2008, Washington, DC: October 22, 2009, p. 3.
The most common input in productivity calculations is labor hours. Labor is an easily identified input to virtually every production process. Productivity is a relative measure. Thus, productivity statistics provided in government reports typically measure percent changes in productivity from month to month, quarter to quarter, year to year, or over a number of years.
Productivity statistics can be misleading. Examining the formula for productivity, output/input, it becomes apparent that productivity can be increased in different ways. For example, a country or firm may increase productivity by decreasing input faster than output. Thus, although the company may be retrenching, its productivity is increasing. Seldom is this avenue for increasing productivity sustainable.
Figure 1.9 shows the growth rate in productivity for select countries for 2008, a year of global recession. Only five countries exhibited positive growth rates, led by Korea and the United States with increases of 1.2%. Examining the outputs and inputs more closely in Figure 1.10, we find that Korea and the United States achieved those increases in very different ways. Korea saw small increases in both its output and the input required to produce that output. The recession in the United States caused a decrease in both output and input; however, the cut in input (i.e., labor hours) was more severe, thereby producing a slight increase in productivity.
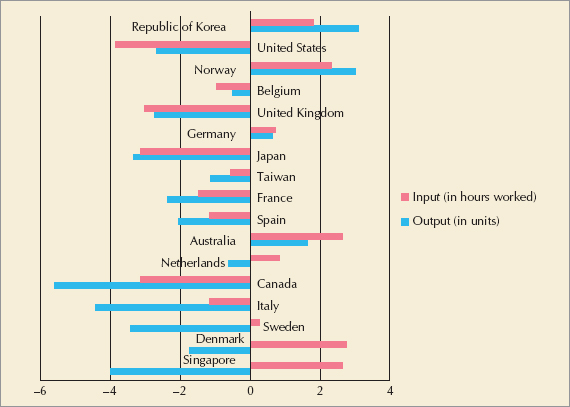
Figure 1.10. Percent Change in Input and Output, 2008: Source: U.S. Bureau of Labor Statistics. International Comparisons of Manufacturing Productivity and Unit Labor Costs—2008, Washington, DC: October 22, 2009, p.3.
Productivity statistics also assume that if more input were available, output would increase at the same rate. This may not be true, as there may be limits to output other than those on which the productivity calculations are based. Furthermore, productivity emphasizes output produced, not output sold. If products produced are not sold, inventories pile up and increases in output can actually accelerate a company's decline.
As the business world becomes more competitive, firms must find their own path to sustainable competitive advantage. Effectively managed operations are important to a firm's competitiveness. How a firm chooses to compete in the marketplace is the subject of the next section: Strategy and Operations.
Strategy is how the mission of a company is accomplished. It unites an organization, provides consistency in decisions, and keeps the organization moving in the right direction. Operations and supply chain management play an important role in corporate strategy.
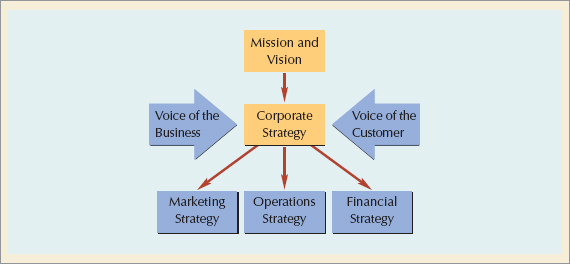
As shown in Figure 1.11, the strategic planning process involves a hierarchy of decisions. Senior management, with input and participation from different levels of the organization, develops a corporate strategic plan in concurrence with the firm's mission and vision, customer requirements (voice of the customer), and business conditions (voice of the business). The strategic plan focuses on the gap between the firm's vision and its current position. It identifies and prioritizes what needs to be done to close the gap, and it provides direction for formulating strategies in the functional areas of the firm, such as marketing, operations, and finance. It is important that strategy in each of the functional areas be internally consistent as well as consistent with the firm's overall strategy.
Strategy formulation consists of five basic steps:
Defining a primary task
Assessing core competencies
Determining order winners and order qualifiers
Positioning the firm
Deploying the strategy
• Strategy: provides direction for achieving a mission.
The primary task represents the purpose of a firm—what the firm is in the business of doing. It also determines the competitive arena. As such, the primary task should not be defined too narrowly. For example, Norfolk Southern Railways is in the business of transportation, not railroads. Paramount is in the business of communication, not making movies. Amazon's business is providing the fastest, easiest, and most enjoyable shopping experience, while Disney's is making people happy! The primary task is usually expressed in a firm's mission statement.
• Primary task: what the firm is in the business of doing.
Mission statements clarify what business a company is in—for Levi Strauss it's "branded casual apparel"; for Intel it's supplying "building blocks to the Internet economy"; for Binney & Smith (Crayola) it's "colorful visual expression"; for Currency Doubleday it's "ideas that link business with life's meaning"; for eBay it's "trading communities"; and for Merck it's "preserving and improving human life." Mission statements are the "constitution" for an organization, the corporate directive, but they are no good unless they are supported by strategy and converted into action. Thus, the next step in strategy formulation is assessing the core competencies of a firm.
Core competency: what the firm does better than anyone else.
Core competency is what a firm does better than anyone else, its distinctive competence. A firm's core competence can be exceptional service, higher quality, faster delivery, or lower cost. One company may strive to be first to the market with innovative designs, whereas another may look for success arriving later but with better quality.
Based on experience, knowledge, and know-how, core competencies represent sustainable competitive advantages. For this reason, products and technologies are seldom core competencies. The advantage they provide is short-lived, and other companies can readily purchase, emulate, or improve on them. Core competencies are more likely to be processes, a company's ability to do certain things better than a competitor. Thus, while a particular product is not a core competence, the process of developing new products is. For example, while the iPod was a breakthrough product, it is Apple's ability to turn out hit product after hit product (e.g., iPhone, iPad, MacBook, etc.) that gives it that competitive advantage.
Core competencies are not static. They should be nurtured, enhanced, and developed over time. Close contact with the customer is essential to ensuring that a competence does not become obsolete. Core competencies that do not evolve and are not aligned with customer needs can become core rigidities for a firm. Walmart and Dell, seemingly unstoppable companies in their field, went astray when they failed to update their competencies to match changes in customer desires. For Dell, the low cost and mail order delivery of computers did not match the customer's desire to see and test computers before purchase, or to receive personalized after-purchase customer service. For Walmart, the obsession with lower costs led to image problems of a behemoth corporation with little regard for employees, suppliers, or local communities. Customers preferred to pay slightly more for the better designed products of more community-involved companies like Target. To avoid these problems, companies need to continually evaluate the characteristics of their products or services that prompt customer purchase; that is, the order qualifiers and order winners.
A firm is in trouble if the things it does best are not important to the customer. That's why it's essential to look toward customers to determine what influences their purchase decision.
•Order qualifiers: what qualifies an item to be considered for purchase.
•Order winner: what wins the order.
Order qualifiers are the characteristics of a product or service that qualify it to be considered for purchase by a customer. An order winner is the characteristic of a product or service that wins orders in the marketplace—the final factor in the purchasing decision. For example, when purchasing a DVD or Blu-ray player, customers may determine a price range (order qualifier) and then choose the product with the most features (order winner) within that price range. Or they may have a set of features in mind (order qualifiers) and then select the least expensive player (order winner) that has all the required features.
Order winners and order qualifiers can evolve over time, just as competencies can be gained and lost. Japanese and Korean automakers initially competed on price but had to ensure certain levels of quality before the U.S. consumer would consider their product. Over time, the consumer was willing to pay a higher price (within reason) for the assurance of a superior-quality Japanese car. Price became a qualifier, but quality won the orders. Today, high quality, as a standard of the automotive industry, has become an order qualifier, and innovative design or superior gas mileage wins the orders.
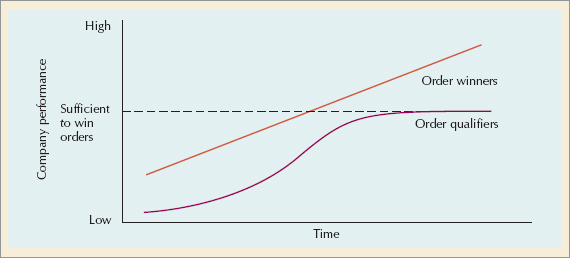
Figure 1.12. Order Winners and Order Qualifiers: Source: Adapted from Nigel Slack, Stuart Chambers, Robert Johnston, and Alan Betts, Operations and Process Management, Prentice Hall, 2006, p. 47.
As shown in Figure 1.12, order qualifiers will only take a firm so far. The customer expects the qualifiers, but is not "wowed" by them. For example, a low price might be a qualifier, but reducing the price further may not win orders if the features or design are not adequate. At a minimum, a firm should meet the qualifiers. To excel, the firm needs to develop competencies that are in tune with the order winners. Marketing helps to identify these qualifiers and winners. Oftentimes, these characteristics are in the purview of operations and supply chain management, such as cost, speed to the market, speed of delivery, or customization. Other characteristics such as product or service design are supported by operations and supply chain management, but are not completely under their control.
No firm can be all things to all people. Strategic positioning involves making choices—choosing one or two important things on which to concentrate and doing them extremely well. A firm's positioning strategy defines how it will compete in the marketplace—what unique value it will deliver to the customer. An effective positioning strategy considers the strengths and weaknesses of the organization, the needs of the marketplace, and the positions of competitors.[2]
Positioning: how the firm chooses to compete.
Let's look at firms that have positioned themselves to compete on cost, speed, quality, and flexibility.
Eliminate all waste.
Companies that compete on cost relentlessly pursue the elimination of all waste. In the past, companies in this category produced standardized products for large markets. They improved yield by stabilizing the production process, tightening productivity standards, and investing in automation. Today, the entire cost structure is examined for reduction potential, not just direct labor costs. High-volume production and automation may or may not provide the most cost-effective alternative. A lean production system provides low costs through disciplined operations.
More than ever before, speed has become a source of competitive advantage. The Internet has conditioned customers to expect immediate response and rapid product shipment. Service organizations such as McDonald's, LensCrafters, and Federal Express have always competed on speed. Now manufacturers are discovering the advantages of time-based competition, with build-to-order production and efficient supply chains. In the fashion industry where trends are temporary, Gap's six-month time-to-market can no longer compete with the nine-day design-to-rack lead time of Spanish retailer, Zara.
Speed: Fast moves, fast adaptations, tight linkages.
A LONG THE SUPPLY CHAIN
There are two basic approaches to strategy. Do what everyone else does, only better; or do something entirely different. Trader Joe's has chosen the "differentiation" strategy. TJ is a specialty grocery store chain located primarily in urban areas that stocks unusual goods at value prices. The stores are small, cramped, and low-rent; not at all what you would expect for upscale shoppers. With only about 10% of the stock of a traditional supermarket, selection is limited; but what a selection it is—unusual recipes, high quality ingredients, imported wines and cheeses, health foods, exotic products from around the world, and private label specialties. The stock is constantly changing, with new products being brought in as others are phased out. This creates a "treasure hunt" type atmosphere that encourages frequent visits from loyal customers. The stores are fun and quirky, too. The staff gives excellent, if irreverent, service with the feel of a mom-and-pop store (only Mom and Pop wear Hawaiian shirts).
Behind this strategy is an operations and supply chain network that is cost conscious and efficient. Product selection is carefully tended to. Every item sold in TJ is tested, tasted, or used by one of its buyers or employees. TJ stocks fresh items only in season and does not worry about running out of items or replenishing stock within a certain time frame. Scarcity helps to create the adventuresome atmosphere. The supply chain is simpler without national brands and general merchandise to contend with, but it does involve more legwork for TJ buyers to personally find, vet, and purchase the merchandise to be sold. This sometimes involves making single purchases of large amounts (often sell-outs) or traveling across the globe to find those special items.
The stores themselves are rustic, with hand-painted signs and chalkboards to announce daily specials. Store managers are called captains; assistant managers are known as first mates. Company policy is for full-time employees to make at least the median household income for their communities. Store captains can make six figures annually. Turnover among full-time crew is a mere 4%. Seventy percent of the crew are part-time; part-timers can earn health-care benefits, a draw for creative types who wouldn't normally seek supermarket jobs.
TJ doesn't accept coupons, issue loyalty cards, or feature weekly sales. Instead it adopts an everyday, low-price strategy, with the highest margin in the industry. Advertising is local and folksy. The TJ model attempts to make grocery shopping an enriching experience rather than a weekly chore to be avoided.

TJ has a well-crafted strategy, matching the product offerings to its customer base, creating a culture of customer service and excitement, and building an operations and supply chain network that provides value (and a treasure, perhaps) for the customer.
How is TJ able to offer upscale products at bargain prices?
How does TJ compare with Whole Foods or Costco?
Is TJ strategy scalable? In other words, as the company grows, will it be able to maintain the same focused strategy?
Sources: Christopher Palmeri, "Trader Joe's Recipe for Success." BusinessWeek (February 21, 2008); Irwin Speizer, "The Grocery Chain That Shouldn't Be." Fast Company (December 19, 2007); Len Lewis. The Trader Joe's Adventure: A Unique Approach to Business into a Retail and Cultural Phenomenon (Chicago: Dearborn Trade Publication, 2005).
Most companies approach quality in a defensive or reactive mode; quality is confined to minimizing defect rates or conforming to design specifications. To compete on quality, companies must view it as an opportunity to please the customer, not just a way to avoid problems or reduce rework costs.
• Quality: a way to please the customer.
To please the customer, one must first understand customer attitudes toward and expectations of quality. One good source is the American Customer Satisfaction Index compiled each year by the American Society for Quality and the National Quality Research Center. Examining recent winners of the Malcolm Baldrige National Quality Award and the criteria on which the award are based also provides insight into companies that compete on quality.
The Ritz-Carlton Hotel Company is a Baldrige Award winner and a recognized symbol of quality. The entire service system is designed to understand the individual expectations of more than 500,000 customers and to "move heaven and earth" to satisfy them. Every employee is empowered to take immediate action to satisfy a guest's wish or resolve a problem. Processes are uniform and well defined. Teams of workers at all levels set objectives and devise quality action plans. Each hotel has a quality leader who serves as a resource and advocate for the development and implementation of those plans.
Marketing always wants more variety to offer its customers. Manufacturing resists this trend because variety upsets the stability (and efficiency) of a production system and increases costs. The ability of manufacturing to respond to variation has opened up a new level of competition. Flexibility has become a competitive weapon. It includes the ability to produce a wide variety of products, to introduce new products and modify existing ones quickly, and to respond to customer needs.
• Flexibility: the ability to adjust to changes in product mix, production volume, or design.
National Bicycle Industrial Company fits bicycles to exact customer measurements. Bicycle manufacturers typically offer customers a choice among 20 or 30 different models. National offers 11,231,862 variations and delivers within two weeks at costs only 10% above standard models. Computerized design and computer-controlled machinery allow customized products to be essentially mass produced. The popular term for this phenomenon is mass customization.
• Mass customization: the mass production of customized products.
"The difficulty is not in knowing what to do. It's doing it," said Kodak's former CEO, George Fisher. Implementing strategy can be more difficult than formulating strategy. Strategies unveiled with much fanfare may never be followed because they are hard to understand, too general, or unrealistic. Strategies that aim for results five years or so down the road mean very little to the worker who is evaluated on his or her daily performance. Different departments or functional areas in a firm may interpret the same strategy in different ways. If their efforts are not coordinated, the results can be disastrous.
Consider Schlitz Brewing Company, whose strategy called for reduced costs and increased efficiency. Operations achieved its goals by dramatically shortening its brewing cycle—and, in the process, lost 6 of every 10 customers when the clarity and taste of the beer suffered. The efficiency move that was to make the company the most profitable in its industry instead caused its stock value to plummet from $69 per share to $5 per share. Schiltz has since been sold to Pabst Brewing Company who combed through company documents and interviewed retired Schlitz brewmasters and taste-testers to derive and reintroduce the original 1960's "with gusto" formula.
Strategy deployment converts a firm's positioning strategy and resultant order winners and order qualifiers into specific performance requirements.
Companies struggling to align day-to-day decisions with corporate strategy have found success with two types of planning systems—policy deployment and the balanced scorecard.
Policy deployment, also known as hoshin planning, is adapted from Japan's system of hoshin kanri, which is roughly translated from Japanese as "shining metal pointing direction"—a compass.
•Policy deployment: translates corporate strategy into measurable objectives.
Policy deployment tries to focus everyone in an organization on common goals and priorities by translating corporate strategy into measurable objectives throughout the various functions and levels of the organization. As a result, everyone in the organization should understand the strategic plan, be able to derive several goals from the plan, and determine how each goal ties into their own daily activities.
Is your company pointed in one direction? AT&T uses the analogy of migrating geese to explain the concept of policy deployment. Naturalists believe the instinctive V-formation allows the geese to follow one leader and migrate in a cohesive unit toward their destination. Policy deployment does the same thing—it enables business leaders to mobilize the organization toward a common destination, aligning all employees behind a common goal and a collective wisdom.

Suppose the corporate strategic plan of competing on speed called for a reduction of 50% in the length of the supply chain cycle. Senior management from each functional area would assess how their activities contribute to the cycle, confer on the feasibility of reducing the cycle by 50%, and agree on each person's particular role in achieving the reduction. Marketing might decide that creating strategic alliances with its distributors would shorten the average time to release a new product. Operations might try to reduce its purchasing and production cycles by reducing its supplier base, certifying suppliers, using e-procurement, and implementing a just-in-time (JIT) system. Finance might decide to eliminate unnecessary approval loops for expenditures, begin prequalifying sales prospects, and explore the use of electronic funds transfer (EFT) in conjunction with operations' lean strategy.
• Hoshins: the action plans generated from the policy deployment process.
The process for forming objectives would continue in a similar manner down the organization with the means of achieving objectives for one level of management becoming the target, or objectives, for the next level. The outcome of the process is a cascade of action plans (or Hoshins) aligned to complete each functional objective, which will, in turn, combine to achieve the strategic plan.
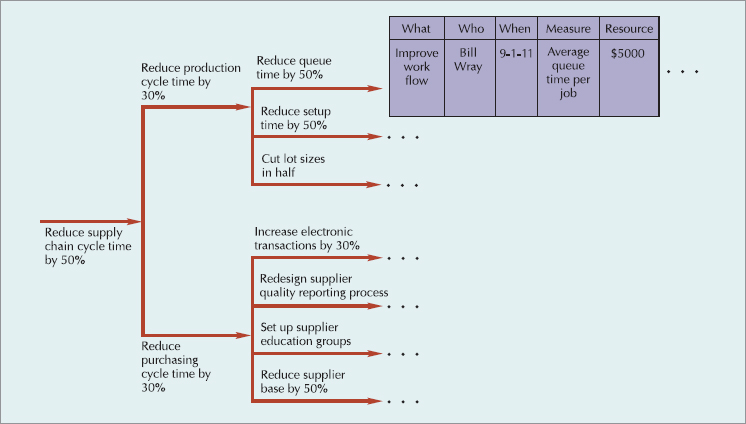
Figure 1.13 shows an abbreviated operations action plan for reducing supply chain cycle time. Policy deployment has become more popular as organizations are more geographically dispersed and culturally diverse.
The balanced scorecard, developed by Robert Kaplan and David Norton,[3] examines a firm's performance in four critical areas:
• Balanced scorecard: a performance assessment that includes metrics related to customers, processes, and learning and growing, as well as financials.
Finances—How should we look to our shareholders?
Customers—How should we look to our customers?
Processes—At which business processes must we excel?
Learning and Growing—How will we sustain our ability to change and improve?
It's called a balanced scorecard because more than financial measures are used to assess performance. Operational excellence is important in all four areas. How efficiently a firm's assets are managed, products produced, and services provided affects the financial health of the firm. Identifying and understanding targeted customers helps determine the processes and capabilities the organization must concentrate on to deliver value to the customer. The firm's ability to improve those processes and develop competencies in new areas is critical to sustaining competitive advantage.
Table 1.3 is a balanced scorecard worksheet. The worksheet selects areas of the strategy map to incorporate in annual objectives for the company. The objectives are then operationalized with
Table 1.3. The Balanced Scorecard Worksheet
Dimension | Objectives | Key Performance Indicator | Goal for 2011 | KPI Results to Date | Score | Mean Performance |
|---|---|---|---|---|---|---|
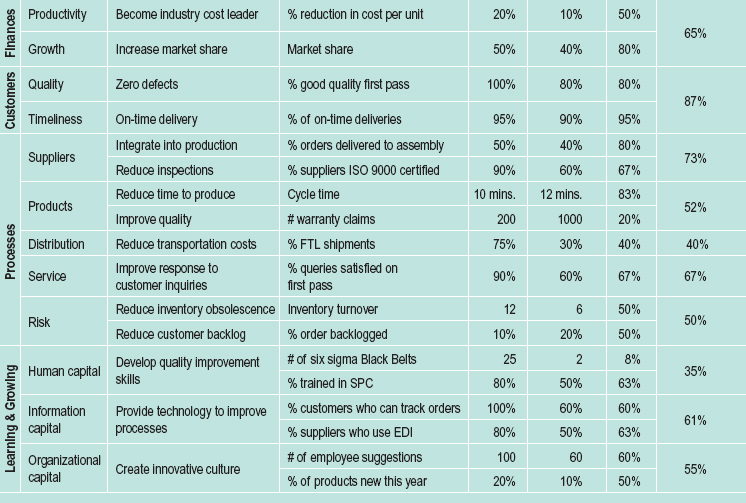 | ||||||
• Key performance indicators (KPI):
a set of measures that help managers evaluate performance in critical areas.
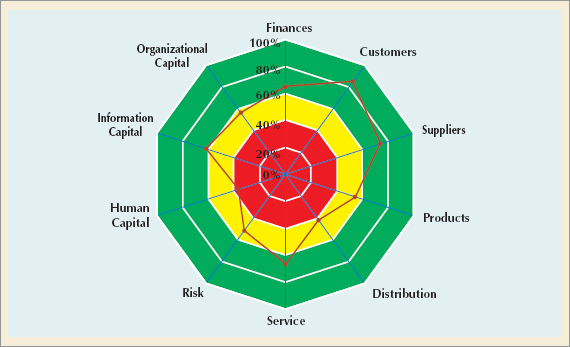
key performance indicators (KPI). The goals for the year are given, and the KPI results are recorded. The score converts the different performance measures into percentage completed. For example, if the goal is to achieve 12 inventory turns a year and the company manages only 6, then the goal is 50% achieved. The mean performance column averages the score for each dimension. The scorecard performance can be visualized in many ways, two of which are illustrated in Figures 1.14 and 1.15.
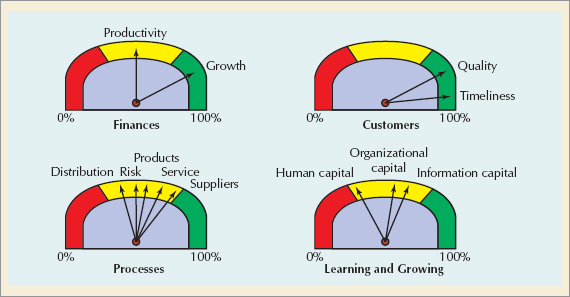
Figure 1.14 is a radar chart of the balanced scorecard. Goals 0% to 40% achieved appear in the red "danger" zone, 40% to 80% achieved are in the yellow "cautionary" zone, and 80% to 100% achieved are in the green "moving ahead" zone. In this example, the company is in the danger zone for human capital and distribution, but is doing well with growth, quality, timeliness, and service. Figure 1.15 shows the same information in an alternative format. The dashboard presents each scorecard perspective in a different graphic. The red zone is set at 25% or less goal achievement, yellow from 25% to 75%, and green in excess of 75%, although different limits can be set for each perspective. The company excels in growth, quality, and timeliness, and is not in danger on any measure. Note that different limits can be set for each gauge, and measures other than percentages can be used. Dashboards are popular ways for managers to quickly interpret the massive amounts of data collected each day and in some cases can be updated in real time.
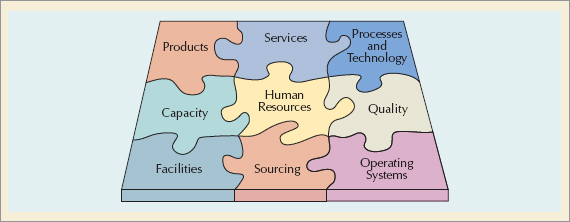
The operations function helps strategy evolve by creating new and better ways of delivering a firm's competitive priorities to the customer. Once a firm's competitive priorities have been established, its operating system must be configured and managed to provide for those priorities. This involves a whole series of interrelated decisions on products and services, processes and technology, capacity and facilities, human resources, quality, sourcing, and operating systems. As shown in Figure 1.16, all these decisions should "fit" like pieces in a puzzle. A tight strategic fit means competitors must replicate the entire system to obtain its advantages. Thus, the competitive advantage from an integrated operating system is more sustainable than short-lived products or technologies. Beginning with quality, the remaining chapters in Part I put together the pieces of the operations strategy puzzle.
The organization of this textbook reflects the emergence of supply chain management as an integral part of the study of operations. The first half of the text concentrates on issues and decisions that are common to most enterprises—ensuring quality, designing products and services, analyzing processes, designing facilities, developing human resources, and managing projects. The second half emphasizes activities that are influenced by and are most likely shared with entities along the supply chain—sourcing and logistics, forecasting demand, establishing inventory levels, coordinating sales and operations, developing resource plans, leaning operations and supply chains, and scheduling work. A diagram of the chapters in each half of the text is shown in Table 1.4. Please note that your professor may elect to cover these topics in a different order than presented in the text. This is perfectly understandable given the interdependency of decisions in operations and supply chain management.
Table 1.4. Organization of the Text
Part I—Operations Management | |
|---|---|
Introduction to Operations and Supply Chain Management | |
Quality Management | |
Statistical Process Control | |
Product Design | |
Service Design | |
Processes and Technology | |
Capacity and Facilities Design | |
Human Resources | |
Project Management | |
Part II—Supply Chain Management | |
|---|---|
Supply Chain Management Strategy and Design | |
Global Supply Chain Procurement and Distribution | |
Forecasting | |
Inventory Management | |
Sales and Operations Planning | |
Resource Planning | |
Lean Systems | |
Scheduling | |
The learning objectives of this course are threefold:
To gain an appreciation of the strategic importance of operations and supply chain management in a global business environment and to understand how operations relates to other business functions. Regardless of your major, as you pursue a career in business, you will need to understand the basic issues, capabilities, and limitations of the operations function. By the conclusion of this course, you will be able to describe the impact of operations and supply chain management on other functions within a firm, as well as on the competitive position of the firm. You will also be more aware of the global nature of operations and the complexity of supply chains.
To develop a working knowledge of the concepts and methods related to designing and managing operations and to create value along the supply chain. In this course, you will learn the basic steps involved in bringing a product to market from its design through production and delivery. You will also learn such skills as how to forecast demand, lay out a facility, manage a project, work with suppliers, and schedule work.
To develop a skill set for continuous improvement. From this course, you will gain the ability to conceptualize how systems are interrelated, to organize activities effectively, to analyze processes critically, to make decisions based on data, and to push for continual process improvement. These skills will serve you well in whatever career you choose.
Operations can be viewed as a transformation process that converts inputs into outputs of greater value.
Operations management is the study of processes directly related to the creation and distribution of goods and services. Increasingly, these operations are taking place outside of the boundaries of a traditional enterprise. Thus, while today's managers need to understand how to efficiently manage operations within their own firm, they also need to develop skills in coordinating operations across a global supply chain. This text teaches students how to analyze processes, ensure quality, create value, and manage the flow of information, products and services across a network of customers, enterprises, and supply chain partners.
Firms choose to compete in different ways. A firm's strategy defines how it will compete in the marketplace—its own best way. Strategy formulation involves defining the primary task, assessing core competencies, determining order winners and order qualifiers, and positioning the firm. An effective strategy meets the order qualifiers and excels on the order winners. A competitive position is not sustainable unless the operating system that supports it is configured and managed effectively.
Policy deployment is a planning system that helps align day-to-day operating decisions with the company's overall strategy. The balanced scorecard reinforces a firm's strategy by providing customer-oriented and process-oriented measures of performance, in addition to traditional financial measures.
Decision making for the future can be scary at best. Fortunately, there are quantitative tools available for making decisions under uncertain conditions. The supplement to this chapter reviews several of them for us.
balanced scorecard a performance assessment that includes metrics related to customers, processes, and learning and growing, as well as financials.
competitiveness the degree to which a nation can produce goods and services that meet the test of international markets.
core competencies the essential capabilities that create a firm's sustainable competitive advantage.
craft production the process of handcrafting products or services for individual customers.
division of labor dividing a job into a series of small tasks each performed by a different worker.
flexibility in operations, the ability to adjust to changes in product mix, production volume, or product and process design.
hoshins the action plans generated from the policy deployment process.
interchangeable parts the standardization of parts initially as replacement parts; enabled mass production.
key performance indicators a set of measures that help managers evaluate performance in critical areas.
lean production an adaptation of mass production that prizes quality and flexibility.
mass customization the mass production of customized products.
mass production the high-volume production of a standardized product for a mass market.
operations a function or system that transforms inputs into outputs of greater value.
operations management the design and operation of productive systems.
order qualifiers the characteristics of a product or service that qualify it to be considered for purchase.
order winner the characteristic of a product or service that wins orders in the marketplace.
policy deployment a planning system for converting strategy to measurable objectives throughout all levels of an organization.
positioning determining how a firm will compete in the marketplace.
primary task the task that is most central to the operation of a firm; it defines the business that a firm is in and is often expressed in a mission statement.
productivity the ratio of output to input.
quality revolution an emphasis on quality and the strategic role of operations.
scientific management the systematic analysis of work methods proposed by Frederick Taylor in the early 1900s.
speed fast moves, fast adaptations, tight linkages.
strategy a common vision that unites an organization, provides consistency in decisions, and keeps the organization moving in the right direction.
supply chain management managing the flow of information, products, and services across a network of customers, enterprises, and supply chain partners.
value chain a series of activities from supplier to customer that add value to a product or service.
1-1. What activities are involved in the operations function? How does operations interact with other functional areas?
1-2. What constitutes "operations" at (a) a bank, (b) a retail store, (c) a hospital, (d) a cable TV company?
1-3. Briefly describe how operations has evolved from the Industrial Revolution to the Internet Revolution.
1-4. What is competitiveness? How is it measured? How has the Internet affected competitiveness?
1-5. Investigate the role of government in improving industrial competitiveness. Begin with the U.S. Council on Competitiveness at www.compete.org. Find a similar site for at least one other country. Compare their priorities and initiatives.
1-6. Describe the global activities of a corporation of your choice. How many foreign plants do they have? Where are they located? How much of their business is foreign? Are any global strategies evident?
1-7. Choose an industry on which you will be the class "expert" for the duration of this course. Write an initial profile of major players, customers, structure, and competitive issues.
1-8. Find an interesting Web site related to the operations function in a firm with which you are familiar. Write a summary of what you find.
1-9. Look for articles related to supply chain online or at Fortune, BusinessWeek, or CNN. How do they relate to the primary topics discussed in this chapter?
1-10. The World Bank ranks countries in terms of globalization. Go to the research section of www.worldbank.com and choose four countries to compare.
1-11. The World Trade Organization has its advocates and its adversaries. Find out more about the organization by visiting its Web site at www.wto.org. What kinds of activities does the organization support? What rules and regulations does it enforce? Who are its member states, and how is membership achieved?
1-12. Cultural differences can make it difficult to do business in other countries. Go to www.worldbusinessculture.com and choose a country to explore. Share your discoveries with your professor and classmates in a one- to two-page write-up.
1-13. Much of the negotiation in trade agreements centers on ethical/legal issues such as intellectual property protection, bribery and payoffs, and copyright and patent infringement. Transparency International at www.transparency.org publishes a bribery index by country. Report on which countries and industries are most susceptible to bribery.
1-14. Ethics is easier when there are laws to fall back on. Search the Internet for information on the Foreign Corrupt Practices Act. Briefly describe what it entails. Then find two companies that explicitly state a code of conduct on their Web page, and in particular, reference the Foreign Corrupt Practices Act. How does each company approach the issue?
1-15. Gather mission or vision statements from four different companies. What do they tell you about the organizations? Is their mission or vision reflected in the way they do business?
1-16. List and explain the five steps of strategy formulation. Follow the steps to outline a strategy for a company or organization with which you are familiar.
1-17. Explain the concept of core competencies in your own words. Provide examples of a core competency for a bank, a retail store, and an auto manufacturer.
1-18. What is your core competency? Make a list of the core competencies you will need to compete successfully in the job market. Design a strategy for developing the competencies that you do not have and capitalizing on the competencies that you do have.
1-19. What is the difference between an order winner and an order qualifier? Tell how you have used the two concepts in a purchasing decision.
1-20. Discuss the requirements from an operations perspective of competing on (a) quality, (b) cost, (c) flexibility, (d) speed, (e) innovation, and (f) service. Give examples of manufacturing or service firms that successfully compete on each of the criteria listed.
1-21. What role should operations play in corporate strategy?
1-22. Name several strategic decisions that involve operations and supply chain management.
1-23. Why do companies need policy deployment? What does it do?
1-24. What is the balanced scorecard? How does it relate to operations?
1-25. Examine the annual reports of a company of your choosing over three years. Use quotes from the reports to describe the company's overall strategy and its specific goals each year. How well do you think the company deploys its strategy?
1-26. Use either policy deployment or a balanced scorecard to map out a personal strategy for your future.
1-1. Tried and True Clothing has opened four new stores in college towns across the state. Data on monthly sales volume and labor hours are given below. Which store location has the highest labor productivity?
Store | Annandale | Blacksburg | Charlottesville | Danville |
|---|---|---|---|---|
Sales volume | $40,000 | $12,000 | $60,000 | $25,000 |
Labor hours | 250 | 60 | 500 | 200 |
1-2. Tried and True's accountant (from Problem 1-1) suggests that monthly rent and hourly wage rate also be factored into the productivity calculations. Annandale pays the highest average wage at $6.75 an hour. Blacksburg pays $6.50 an hour, Charlottesville $6, and Danville $5.50. The cost to rent store space is $1800 a month in Annandale, $2000 a month in Blacksburg, $1200 a month in Charlottesville, and $800 a month in Danville.
Which store is most productive?
Tried and True is not sure it can keep all four stores open. Based on multifactor productivity, which store would you close? What other factors should be considered?
1-3. At last year's bass tournament, Jim caught 12 bass in a four-hour period. This year he caught 15 in a six-hour period. In which year was he most productive? If the average size of the bass last year was 20 lb and the average size this year was 25 lb, would your decision change?
1-4. It is time for the annual performance review of Go-Com's account executives. Account values and hours spent each week acquiring and servicing accounts are shown below. Each agent works approximately 45 weeks out of the year, but the time spent on accounts each week differs considerably. How would you rate the performance of each individual? Which agent is most productive? Which agents show the most potential?
Agents | Albert | Bates | Cressey | Duong |
|---|---|---|---|---|
New accounts | $100,000 | $40,000 | $80,000 | $200,000 |
Existing accounts | $40,000 | $40,000 | $150,000 | $100,000 |
Labor hours | 40 | 20 | 60 | 80 |
1-5. The Bureau of Labor Statistics collects input and output data from various countries for comparison purposes. Labor hours are the standard measure of input. Calculate the output per hour from the following data. Which country is most productive?
Labor Hours | Units of Output | |
|---|---|---|
United States | 89.5 | 136 |
Germany | 83.6 | 100 |
Japan | 72.7 | 102 |
1-6. Omar Industries maintains production facilities in several locations around the globe. Average monthly cost data and output levels are as follows.
Calculate the labor productivity of each facility.
Calculate the multifactor productivity of each facility.
If Omar needed to close one of the plants, which one would you choose?
Units (in 000s) | Cincinnati | Frankfurt | Guadalajara | Beijing |
|---|---|---|---|---|
Finished goods | 10,000 | 12,000 | 5,000 | 8,000 |
Work-in-process | 1,000 | 2,200 | 3,000 | 6,000 |
Costs (in 000s) | Cincinnati | Frankfurt | Guadalajara | Beijing |
|---|---|---|---|---|
Labor costs | $3,500 | $4,200 | $2,500 | $800 |
Material costs | $3,500 | $3,000 | $2,000 | $2,500 |
Energy costs | $1,000 | $1,500 | $1,200 | $800 |
Transportation costs | $250 | $2,500 | $2,000 | $5,000 |
Overhead costs | $1,200 | $3,000 | $2,500 | $500 |
1-7. Rushing yardage for three Heisman Trophy candidates is given below. Which candidate is the most productive running back? How did you measure productivity?
Candidates | Hall | Walker | Dayne |
|---|---|---|---|
Rushing yards | 2110 | 3623 | 6925 |
No. of carries | 105 | 875 | 1186 |
No. of touchdowns | 15 | 20 | 70 |
1-8. Carpet City recorded the following data on carpet installations over the past week. Use the data to calculate the average rate (in yards per hour) at which carpet can be installed.
Installation | 1 | 2 | 3 |
|---|---|---|---|
Square yards | 1225 | 1435 | 2500 |
No. of workers | 4 | 3 | 5 |
No. of hours per worker | 3 | 5 | 6 |
1-9. Merrifield Post Office is evaluating the productivity of its mail processing centers. The centers differ in the degree of automation, the type of work that can be performed, and the skill of the workers.
Center | 1 | 2 | 3 |
|---|---|---|---|
Pieces processed/hr | 1000 | 2000 | 3000 |
No. of workers/hr | 10 | 5 | 2 |
Hourly wage rate | $5.50 | $10 | $12 |
Overhead rate/hr | $10 | $25 | $50 |
Calculate the multifactor productivity for each center.
Workers in Center 1 are scheduled to receive a 10% pay raise next month. How will that affect productivity?
A new processing machine is available for Center 3 that would increase the output to 5000 pieces an hour at an additional overhead rate of $30 an hour. Should Merrifield install the new processing machine?
1-10. Posey Ceramics makes ceramic vases for a chain of department stores. The output and cost figures over the past four weeks are shown here. Labor costs $10 an hour, and materials are $4 a pound. Calculate the (a) labor productivity (in hrs), (b) material productivity (in lbs), and (c) multifactor productivity for each week. Comment on the results.
Week | 1 | 2 | 3 | 4 |
|---|---|---|---|---|
Units of output | 2000 | 4000 | 5000 | 7000 |
No. of workers | 4 | 4 | 5 | 6 |
Hours per week per worker | 40 | 48 | 56 | 70 |
Material (lbs) | 286 | 570 | 720 | 1000 |
1-11. Jake and his friends sell newspaper ads for the Campus Times to supplement their income each year. From the data below, determine which person is the most productive.
Jake | Josh | Jennifer | John | |
|---|---|---|---|---|
No. ads sold | 100 | 50 | 200 | 35 |
No. hours spent | 40 | 15 | 85 | 10 |
1-12. Nicholas is the facilities manager for Green Market Groceries. The store is remodeling and wants to determine which brand of freezer to use for its frozen goods section. The freezers vary by size, cabinet type, accessibility, refrigerant, and interliner. These variables affect both the purchase cost and the operating cost (e.g., energy consumption) of each freezer. Currently, the cost of energy per kilowatt hour (kwh) is $0.10. Green Market expenses capital purchases over a three-year period. Given the cost and capacity data below, calculate the "productivity" (i.e., the cubic feet of freezer space per dollar) for each freezer alternative. Which freezer brand would you recommend to Nicholas?
Alaskan Seal | Brr Frost | Cold Case | Deep Freeze | |
|---|---|---|---|---|
Purchase cost | $3270 | $4000 | $4452 | $5450 |
Daily energy consumption [kwh] | 3.61 | 3.88 | 6.68 | 29.07 |
Volume (cu ft) | 25 | 35 | 49 | 72 |
Visualize This
Visualize This (VT) is a small start-up company specializing in virtual reality and computer visualizations. Located in the research park of a major university, the company was founded by Isaac Trice, a university professor, and staffed with the brightest of his former students. By all accounts the technology is cutting edge. Facilities include a lab of 14 high-end computer workstations adjacent to a CAVE (computer-aided virtual environment) and a small office. A conference room and central lobby are shared with other tenants in the building. Originally the company had partnered with the Swedish firm Salvania to create virtual environments for medical and industrial design. Trice and his staff would develop the software for each application, create a visual database supported with engineering or medical data, and run design sessions for their clients in the CAVE. Salvania provided the capital, generated the clients, and handled the business end of the operations.
In its first two years of business, VT completed four projects. With each project, VT advanced its skills in visualization and developed customized tools to help its clients design intricate products. The clients were pleased but did not anticipate repeating the intensive design process for several years. Unfortunately, Salvania was unable to remain solvent and dissolved its partnership with VT. VT was able to keep its workstations (whose salvage value was low), but gave up its rights to the CAVE and furloughed all but three employees. To stay afloat, VT needed new clients and a steady stream of income. Trice hit the streets and came back with the following possibilities:
Designing computer-based training sessions for bank tellers of an international finance institution
Conducting software certification for the sales staff of a large software vendor
Designing virtual reality tours through history for a major museum
Developing Web-based virtual models for a women's clothing retailer
Creating virtual catalogues in which a customer can enlarge, rotate, and dissect a product online.
"This isn't what I had in mind for my company," Trice lamented as he shared the list with his employees. "I wanted to be developing the next generation of visualization tools in concert with the brightest minds in industry, not digitizing pictures of products and making them turn around, or teaching people to use software that's not even our own!"
That said, Trice and his staff of three began going through the list analyzing the pros and cons of each alternative.
Help Professor Trice formulate a strategy for his company by going through the steps of strategy formulation. For ideas, search the Internet for other companies that provide visualization solutions.
What capabilities does VT need to develop in order to pursue the strategy developed in question 1?
How can Trice reconcile his goals for the organization with the needs of the marketplace?
Compare the processes required to satisfy each customer on Trice's client list. Consider the mix of equipment and personnel, the length and scope of each project, and the potential for future business. How do the requirements differ from the projects already completed by VT?
Which projects would you recommend to VT? Why?
Whither an MBA at Strutledge?
Strutledge is a small private liberal arts school located within 50 miles of a major urban area in the southeast United States. As with most institutions of higher education, Strutledge's costs are rising, and its enrollments are decreasing. In an effort to expand its student base, build valuable ties with area businesses, and simply survive, the Board of Regents is considering establishing an MBA program.
Currently no undergraduate degree is given in business, although business courses are taught. The dean of the school visualizes the MBA as an interdisciplinary program emphasizing problem solving, communication, and global awareness. Faculty expertise would be supplemented by instructors from local industry. The use of local faculty would better connect the university with the business community and provide opportunities for employment of the program's graduates.
In terms of competition, a major state-funded university that offers an MBA is located in the adjacent urban area. Strutledge hopes that state budget cutbacks and perceptions of overcrowded classrooms and overworked professors at public institutions will open the door for a new entrant into the market. The Board of Regents also feels that the school's small size will allow Strutledge to tailor the MBA program more closely to area business needs.
Several members of the Board are concerned about recent reports of the dwindling value of an MBA and are wondering if a better niche could be found with another graduate degree, perhaps a master of science in business or something in the education or health-care field.
What action would you recommend to the Board of Regents?
How should Strutledge go about making a strategic decision such as this?
Weighing Options at the Weight Club
The Weight Club started out as a student organization of 25 individuals who gathered together to discuss fitness goals and lift weights in the campus gym. When budget cutbacks cut gym hours and equipment availability, the students began to look elsewhere for a facility they could organize and control as they wished. They found an empty store in a small, abandoned strip mall, rented it for next to nothing, asked its members to pay dues, and began sponsoring weight-lifting contests to raise money for equipment. Off-campus now, they could recruit members from the town as well as the university. Their members had many talents, and they began sponsoring cheerleading training and other specialized training programs for athletes.
Growth of the student-run organization was phenomenal. Within six years the club had more than 4000 members from inside and outside of the university community. The facility itself extended over three additional storefronts in the now bustling mall, housing more than 50 pieces of aerobic equipment, two complete sets of Nautilus equipment for circuit training, an entire floor of free weights, a separate room for heavy weights, and a large exercise room for a full range of aerobic, step, kick boxing, and stretch and tone classes. Graduate students found the facility an excellent source of subjects for projects ranging from nutrition to exercise to lifestyle changes (after heart attacks, for instance). Members were often able to take advantage of these additional services "free of charge."
The Weight Club clientele began to change as more nonuniversity students joined (from moms in the morning hours to teenagers after school and businesspersons after work). This diversity brought with it numerous requests for additional services such as child care, personal trainers, children's classes, massages, swimming and running facilities, locker rooms and showers, food and drink, sportswear, gymnastics, hotel and corporate memberships, meetings, and sponsored events.
Currently, all members pay the same $25 monthly usage fee with no other membership fees or assessments for additional services (like exercise classes). The staff consists predominantly of student members, many of whom have financed their way through school by working at the Weight Club. The organization is run by a founding member of the original weight club, who will finally graduate this year. Two other founding members have already graduated but work full time in the area and help administer the club whenever they can, serving as an informal "board of directors." In general, this arrangement has worked well, although decisions are made by whoever is behind the desk at the time, and there is no long-range planning.
The Weight Club has no significant competition. The three remaining "administrators" wonder if they need to make any changes.
Help the Weight Club get a handle on its operations and plan for the future by creating a balanced scorecard. Make a list of possible objectives for the Weight Club in terms of finance, customers, processes, and development (i.e., learning and growing). Add key performance measures and set goals for the year. Visit an exercise facility near you for ideas as you complete this assignment.
AT&T Quality Steering Committee. Policy Deployment: Setting the Direction for Change. Indianapolis: AT&T Technical Publications Center, 1992.
Christensen, Clayton. The Innovator's Dilemma. New York: Harper Business, 2003.
Engardio, Pete, and Dexter Roberts, "The China Price." Business Week (December 6, 2004).
Friedman, Thomas. The World is Flat. New York: Farrar, Straus and Giroux, 2005.
Hammer, Michael. Beyond Reengineering. New York: Harper-Collins, 1996.
Hayes, Robert, Gary Pisano, David Upton, and Steven Wheelwright. Operations Strategy and Technology: Pursuing the Competitive Edge. Hoboken, NJ: John Wiley, 2005.
Hill, Terry. Manufacturing Strategy: Test and Cases, 3rd ed. Homewood, IL: Irwin, 2000.
Jones, Patricia, and Larry Kahaner. Say It and Live It: The 50 Corporate Mission Statements That Hit the Mark. New York: Currency Doubleday, 1995.
Kaplan, Robert, and David Norton. Strategy Maps: Converting Intangible Assets into Tangible Outcomes. Boston: Harvard Business School Press, 2004.
King, Bob. Hoshin Planning: The Developmental Approach. Springfield, MA: GOAL/QPC, 1989.
Leonard-Barton, Dorothy. Wellsprings of Knowledge: Building and Sustaining the Sources of Innovation. Boston: Harvard Business School Press, 1995.
Manufacturing Studies Board. Towards a New Era in Manufacturing: The Need for a National Vision. Washington, DC: National Academy Press, 1986.
Peters, Tom. Thriving on Chaos. New York: Alfred A. Knopf, 1987.
Porter, Michael. On Competition. Boston: HBSP, 2008.
Quade, Walter. "Beginner's Guide to the Asian Supply Chain." Inside Supply Management (March 2004), pp. 8–9.
Skinner, Wickham. Manufacturing: The Formidable Competitive Weapon. New York: John Wiley, 1985.
Skinner, Wickham. "Three Yards and a Cloud of Dust: Industrial Management at Century End." Production and Operations Management 5(1; Spring 1996):15–24.
Voss, Christopher. "Operations Management—from Taylor to Toyota—and Beyond." British Journal of Management 6 (December 1995), S17–S29.
Womack, James, Daniel Jones, and Daniel Roos. The Machine that Changed the World. New York: Macmillan, 1990.
[1] David Halberstam, The Reckoning (New York:William Morrow, 1986), pp. 79–81.
[2] These factors can be depicted in a SWOT matrix, which lists the current strengths (S) and weaknesses (W) internal to the company, and the opportunities (O) and threats (T) external to the company.
[3] See Robert S. Kaplan and David P. Norton, "Transforming the Balanced Scorecard from Performance Measurement to Strategic Management." Accounting Horizons (March 2001), pp. 87–104; and Robert S. Kaplan and David P. Norton, "Having Trouble with Your Strategy? Then Map It," Harvard Business Review (September/October 2000), pp. 167–176.