
Self-organizing maps (SOMs) are a type of neural network that cluster and categorize the data without supervision. An SOM starts from a random set of groupings and competitively updates the values in the network to eventually match those in the distribution of the training data. In this way, it learns the clusters in the data by looking at the attributes of the data.
Incanter has an easy-to-use implementation of SOMs. We'll use it here to look for clusters in the Iris dataset.
First, we'll need to have these dependencies in our project.clj file:
(defproject d-mining "0.1.0-SNAPSHOT"
  :dependencies [[org.clojure/clojure "1.6.0"]
                 [incanter "1.5.5"]])
We'll also need to have these libraries loaded into our script or REPL:
(require '[incanter.core :as i]
         '[incanter.som :as som]
         'incanter.datasets)
We'll use the Iris dataset for this recipe:
(def iris (incanter.datasets/get-dataset :iris))
Incanter includes the SOM algorithm in its core library. We'll use it from there:
- To cluster this dataset, we'll use the
incanter.som/som-batch-trainfunction on a matrix of our data. This time, we'll use all measurement attributes, so the SOM will map the four-dimensional attribute vectors onto two dimensions:(def iris-clusters (som/som-batch-train (i/to-matrix (i/sel iris :cols [:Sepal.Length :Sepal.Width :Petal.Length :Petal.Width])))) - Now we can get the indexes of the data rows that are in each cluster by looking at the
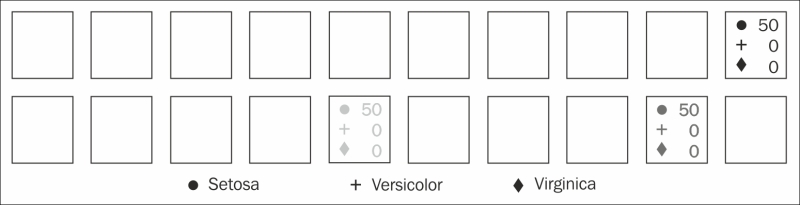
:setskey ofiris-clusters. Then we can pull the species from each cluster's rows to look at the frequency of each species in each cluster:user=> (doseq [[pos rws] (:sets iris-clusters)] (println pos : (frequencies (i/sel iris :cols :Species :rows rws)))) [4 1] : {virginica 23} [8 1] : {virginica 27, versicolor 50} [9 0] : {setosa 50}
So we can see that setosa and versicolor are each put into their own clusters, and half of the virginica are in their own cluster and half are with the versicolors.
SOMs use a neural network to map data points onto a grid. As the neural network is trained, the data points converge into cells in the grid, based on the similarities between the items.
We can get the size of the output map using the :dims key:
user=> (:dims iris-clusters)
[10.0 2.0]
We can use this information, combined with the cell frequencies, to graph the clustering of data in the SOM:
One of the downsides of SOMs is that the network's weights are largely opaque. We can see the groupings, but figuring out why the algorithm grouped them the way it did is difficult to define.
- The Incanter documentation at http://clojuredocs.org/incanter/incanter.som/som-batch-train has more information about the
som/som-batch-trainfunction and its parameters - Tom Germano has a more in-depth discussion of SOMs at http://davis.wpi.edu/~matt/courses/soms/