
To show the distribution of our data, we generally use a histogram. In this recipe, we'll use a histogram to display the distribution of lengths in the abalone dataset.
We'll use the same dependencies and plugins in our project.clj file as we did in the Creating scatter plots with NVD3 recipe. Also, we'll use the framework we've created in the recipes in this chapter upto the Creating scatter plots with NVD3 recipe.
For the data, we'll use the abalone dataset from the Creating histograms with Incanter recipe. I've transformed the data to JSON, and you can download it from http://www.ericrochester.com/clj-data-analysis/data/abalone.json. Save it to the resources/data/ directory in your web application.
We'll create the handler and the routes and then we'll spend most of this recipe in adding the ClojureScript to create the graph. To do this, perform the following steps:
- For the handler, we'll pass the options for this chart to the
d3-pagefunction, as shown here:(defn hist-plot [] (d3-page "Histogram" "webviz.histogram.histogram();" [:div#histogram.chart [:svg]])) - We'll add that and the data URL to the routes:
(defroutes
  site-routes
  (GET "/histogram" [] (hist-plot))
  (GET "/histogram/data.json" []
       (redirect "/data/abalone.json"))
  (route/resources "/")
  (route/not-found "Page not found"))
- Now, for the ClojureScript file, we'll open
src-cljs/webviz/histogram.cljsand add the following namespace declaration:(ns webviz.histogram (:require [webviz.core :as webviz]))
- We'll need a function to group the data into buckets:
(defn get-bucket-number [mn size x] (Math/round (/ (- x mn) size))) (defn inc-bucket [mn size buckets x] (let [b (get-bucket-number mn size x)] (assoc buckets b (inc (buckets b))))) (defn get-buckets [coll n] (let [mn (reduce min coll) mx (reduce max coll) bucket-size (/ (- mx mn) n) first-center (+ mn (/ bucket-size 2.0)) centers (map #(* (inc %) first-center) (range n)) initial (reduce #(assoc %1 %2 0) {} (range n))] (->> coll (reduce (partial inc-bucket mn bucket-size) initial) seq (sort-by first) (map second) (map vector centers)))) - Here are two functions to take the JSON, put it into buckets, and convert it to points and groups:
(defn ->point [pair] (let [[bucket count] pair] (webviz/Point. (inc bucket) count 1))) (defn data->nv-groups [data] (let [lengths (map #(.-length %) data) buckets (apply array (map ->point (get-buckets lengths 10)))] (array (webviz/Group. "Abalone Lengths" buckets)))) - It is simple to initialize the chart. We just want a standard multibar chart, as shown here:
(defn make-chart [] (.multiBarChart (.-models js/nv)))
- Creating the chart just involves tying these together with
create-chart:(defn ^:export histogram [] (webviz/create-chart "/histogram/data.json" "#histogram svg" make-chart data->nv-groups :transition true))
Now, when we visit http://localhost:3000/histogram, we can see the following histogram:
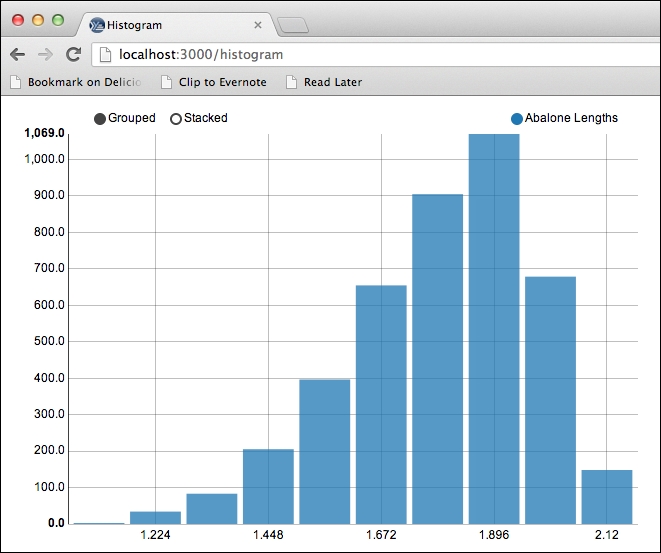
For the most part, this recipe's very similar to the preceding ones. The interesting difference here is that we partition the data into buckets.
To do this, we get the minimum and maximum values in the data and divide the difference between them by the number of buckets. This gives us the width of each bucket in the data.
We use this to determine which bucket each data point goes into, and we count the number of data points in each bucket.
We also get the center value for each bucket, and we use this to label the columns in the graph.