
So far in this chapter, all the charts that we've created have used a utility library, NVD3, to do a lot of heavy lifting for us. However, we can also create a lot of these charts directly with D3. We'll see how to do this to use graphs with time series data.
We'll use the same dependencies and plugins in our project.clj file as we did in the Creating scatter plots with NVD3 recipe. Also, we'll use the framework we created in the recipes in this chapter upto the Creating scatter plots with NVD3 recipe.
For data, we'll use IBM's stock prices from the end of November 2001 to November 2012. You can download this dataset from http://www.ericrochester.com/clj-data-analysis/data/ibm.csv. Save the file into resources/data/ibm.csv.
Our procedure will largely follow the pattern that we've established in the previous recipes. However, we'll also redefine some functions to make sure that we don't load NVD3. To do this, perform the following steps:
- First, we'll define a function that uses
d3-pageto create the page containing the stock price graph:(defn time-series [] (d3-page "IBM Stock Data" "webviz.time.ibm_stock();" [:div#time.chart [:svg]])) - Now, we'll add the URLs for this page and its data to the routes we've been working with:
(defroutes site-routes
  (GET "/ibm-stock" [] (time-series))
  (GET "/ibm-stock/data.csv" [] (redirect "/data/ibm.csv"))

  (GET "/" [] (index-page))
  (route/resources "/")
  (route/not-found "Page not found"))
- We'll also want to add some style-related information to make the chart look good. We can do this by adding the following lines to
resources/css/style.css:#time .axis path { fill: none; stroke: #000; shape-rendering: crispedges; } #time .axis line { fill: none; stroke: #000; shape-rendering: crispedges; } #time .x.axis path { displays: none; } #time .line { fill: none; stroke: steelblue; stroke-width: 1.5px; } - For the graph, the rest of this will take place in a new file. We'll open
src-cljs/webviz/time.cljs. This will contain the following namespace declaration:(ns webviz.time)
- Now, let's start creating parts of the graph. First, we'll have one that takes the margins and returns the dimensions of the graph:
(defn get-dimensions [margin]
  [(- 960 (:left margin) (:right margin))
   (- 500 (:top margin) (:bottom margin))])
- We'll use D3's facilities to scale the values onto the graph. These objects will be created by
get-scales:(defn get-scales [width height] [(.. js/d3 -time scale (range #js [0 width])) (.. js/d3 -scale linear (range #js [height 0]))])
- D3 also provides helpers to calculate and draw the axes:
(defn get-axes [x y]
  [(.. js/d3 -svg axis (scale x) (orient "bottom"))
   (.. js/d3 -svg axis (scale y) (orient "left"))])
- The graph's line itself will be created by getting the date and the closing price and scaling these by the appropriate scales (
xory), as follows:(defn get-line [x y] (.. js/d3 -svg line (x #(x (.-date %))) (y #(y (.-close %))))) - The main SVG element will be populated using the
get-svgfunction:(defn get-svg [margin width height] (.. js/d3 (select "svg") (attr "width" (+ width (:left margin) (:right margin))) (attr "height" (+ height (:top margin) (:bottom margin))) (append "g") (attr "transform" (str "translate(" (:left margin) , (:top margin) ))))) - The next several functions will apply the data to the graph in order to populate the axes and the line. However, the first two functions that directly deal with the data will simply make sure that the data values are of the right type and calculate the domains:
(defn coerce-datum [parse-date d]
  (aset d "date" (parse-date (.-date d)))
  (aset d "close" (js/parseFloat (.-close d))))
(defn set-domains [x y data]
  (.domain x (.extent js/d3 data #(.-date %)))
  (.domain y (.extent js/d3 data #(.-close %))))
- The next two functions will use the data to draw the x and y axes:
(defn build-x-axis [height svg x-axis] (.. svg (append "g") (attr "class" "x axis") (attr "transform" (str "translate(0," height ))) (call x-axis))) (defn build-y-axis [svg y-axis] (.. svg (append "g") (attr "class" "y axis") (call y-axis) (append "text") (attr "transform" "rotate(-90)") (attr "y" 6) (attr "dy" ".71em") (style "text-anchor" "end") (text "Price ($)"))) - The last part of the graph that we'll deal with here is the line that traces out the data's values:
(defn add-line [svg line data] (.. svg (append "path") (datum data) (attr "class" "line") (attr "d" line))) - Now, we'll assemble all of these together to create the graph, as shown here:
(defn ^:export ibm-stock []
  (let [margin {:top 20, :right 20, :bottom 30, :left 50}
        [width height] (get-dimensions margin)
        parse-date (.. js/d3 -time (format "%d-%b-%y") -parse)
        [x y] (get-scales width height)
        [x-axis y-axis] (get-axes x y)
        line (get-line x y)
        svg (get-svg margin width height)]

    (.csv js/d3
      "/ibm-stock/data.csv"
      (fn [error data]
        (.forEach data
          #(coerce-datum parse-date %))

        (set-domains x y data)

        (build-x-axis height svg x-axis)
        (build-y-axis svg y-axis)
        (add-line svg line data)))))
With these in place, we can now visit the page with our browser and view the graph, as shown in the following screenshot:
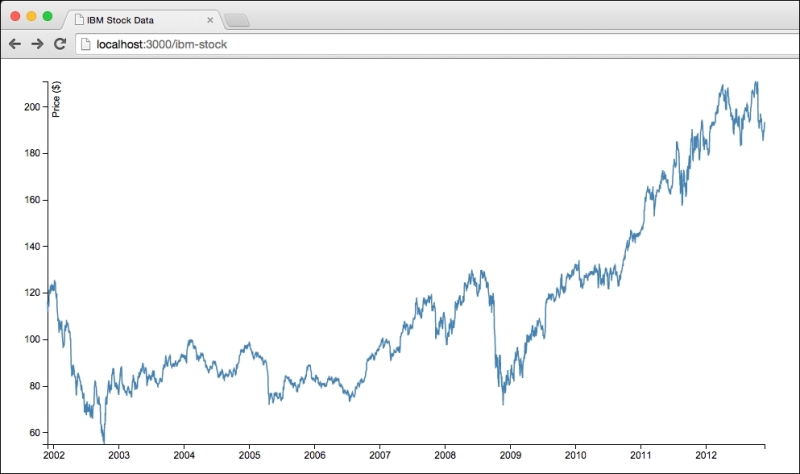
This recipe makes it clear that working with D3 directly is often much lower-level than using NVD3. In this recipe, we're using D3 to create the actual SVG elements, with the appropriate attributes and content, to display the graph. We can see this clearly in add-line, for instance.
Let's take a look at that function line-by-line (almost):
(defn add-line [svg line data]
  (.. svg (append "path")
      (datum data)
In this snippet, D3 will add an SVG path element for each datum. This just creates an empty element and associates it with a datum:
(attr "class" "line")
This line adds the class attribute with the value line. We used this in the CSS style sheet to set the line's color:
(attr "d" line)))
This sets the d attribute to be the value of the line function called on this element's datum. The line function is created by get-line, and it knows how to get its coordinates from the data's date and close properties.
The Mozilla Developer Network has a good reference to SVG at https://developer.mozilla.org/en-US/docs/Web/SVG.