
We saw in the last chapter how to use Incanter Zoo to work with time series data and how to smooth values using a running mean. However, sometimes we'll want to smooth data that doesn't have a time component. For instance, we may want to track the usage of a word throughout a larger document or set of documents.
For this, we'll need usual dependencies:
(defproject statim "0.1.0"
  :dependencies [[org.clojure/clojure "1.6.0"]
                 [incanter "1.5.5"]])
We'll also require those in our script or REPL:
(require '[incanter.core :as i]
         '[incanter.stats :as s]
         '[incanter.charts :as c]
         '[clojure.string :as str])
For this recipe, we'll look at Sir Arthur Conan Doyle's Sherlock Holmes stories. You can download this from Project Gutenberg at http://www.gutenberg.org/cache/epub/1661/pg1661.txt or http://www.ericrochester.com/clj-data-analysis/data/pg1661.txt.
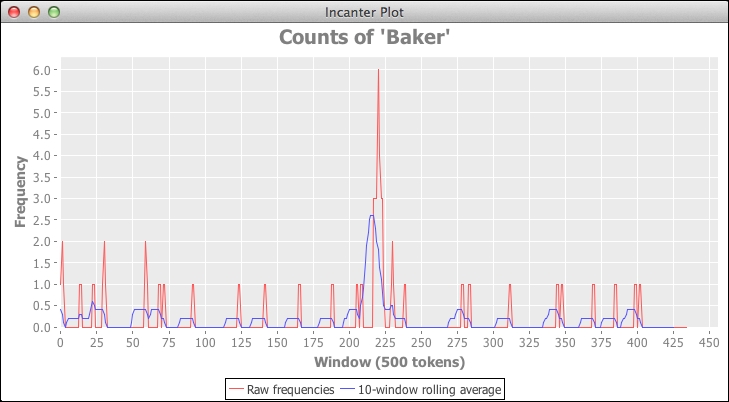
We'll look at the distribution of baker over the course of the books. This may give some indication of how important Holmes' residence at 221B Baker Street is for a given story.
- First, we'll define a function that takes a text string and pulls the words out of it, or tokenizes it:
(defn tokenize
 [text]
  (map str/lower-case (re-seq #"w+" text)))
- Next, we'll write a function that takes an item and a collection and returns how many times the item appears in the collection:
(defn count-hits
 [x coll]
  (get (frequencies coll) x 0))
- Now we can read the file, tokenize it, and break it into overlapping windows of 500 tokens:
(def data-file "data/pg1661.txt")
(def windows
  (partition 500 250 (tokenize (slurp data-file))))
- We use
count-hitsto get the number of times that baker appears in each window of tokens:(def baker-hits (map (partial count-hits "baker") windows))
- At this point, we have the frequency of baker across the document. However, this doesn't really show trends. To get the rolling average, we'll define a function that maps a function to a rolling window of n items from a collection:
(defn rolling-fn [f n coll]
  (map f (partition n 1 coll)))
- We'll apply the mean function to the sequence of frequencies for the term baker to get the rolling average for sets of 10 windows:
(def baker-avgs (rolling-fn s/mean 10 baker-hits))
This graph shows the smoothed data overlaid over the raw frequencies:
This recipe processes a document through a number of stages to get the results:
- We'll read in the file and pull out the words.
- We'll partition the tokens into chunks of 500 tokens, each overlapping by 250 tokens. This allows us to deal with localized parts of the document. Each partition is large enough to be interesting, but small enough to be narrowly focused.
- For each window, we'll get the frequency of the term baker. This data is kind of spiky. This is fine for some applications, but we may want to smooth it out to make the data less noisy and to show the trends better.
- So, we'll break the sequence of frequencies of baker into a rolling set of ten windows. Each set is offset from the previous set by one.
- We'll then get the average frequency for each set of frequencies. This removes much of the variability and spikiness from the raw data, but it maintains the general shape of the data. We can still see the spike around 220 in the preceding screenshot.
By the way, that spike is from the short story, The Adventure of the Blue Carbuncle. A character in that story is Henry Baker, so the spike is not just from references to Baker Street, but also to the character.