
When doing data analysis, we're often looking for relationships in our data. Does one variable correlate with another? If we have more of one thing, do we have less of something else? Does, say, a person's body mass index (BMI) have a relationship to the longevity of her life? This isn't always obvious just by looking at a graph. A relationship that seems obvious to our eyes may not be significant.
Linear regression is a way of finding a linear formula that matches the relationship between an independent variable (the BMI) and a dependent variable (longevity). It also tells us how well that formula explains the variance in the data and how significant that relationship is.
For this, we'll need these dependencies:
(defproject statim "0.1.0"
  :dependencies [[org.clojure/clojure "1.6.0"]
                 [incanter "1.5.5"]])
We'll use this set of requirements:
(require
  '[incanter.core :as i]
  'incanter.io
  '[incanter.stats :as s]
  '[incanter.charts :as c])
We'll use the Virginia census race data file that we can download from http://www.ericrochester.com/clj-data-analysis/data/all_160_in_51.P35.csv:
(def data-file "data/all_160_in_51.P35.csv")
In this recipe, we'll use the Virginia census family data to examine the relationship between the number of families and the number of housing units. Does having more families imply more housing units? We probably expect these two variables to have a fairly tight linear relationship, so this should be a clear test.
- First, let's load the data and pull out the two fields we're interested in:
(def family-data (incanter.io/read-dataset "data/all_160_in_51.P35.csv" :header true)) (def housing (i/sel family-data :cols ::HU100)) (def families (i/sel family-data :cols ::P035001)) - Computing the linear regression takes just one line:
(def families-lm
  (s/linear-model housing families :intercept false))
- The output of
s/linear-modelis a mapping that contains a lot of useful information, including regression coefficients and other things. We can get the r-square value (roughly, how well the model explains the variance in the data) and the F value (how significant the relationship is). High F values are associated with lower p-values, which is to say that high F values imply a lower probability that the relationship is the result of chance:user=> (:r-square families-lm) 0.959498864188327 user=> (:f-prob families-lm) 1.1102230246251565E-16
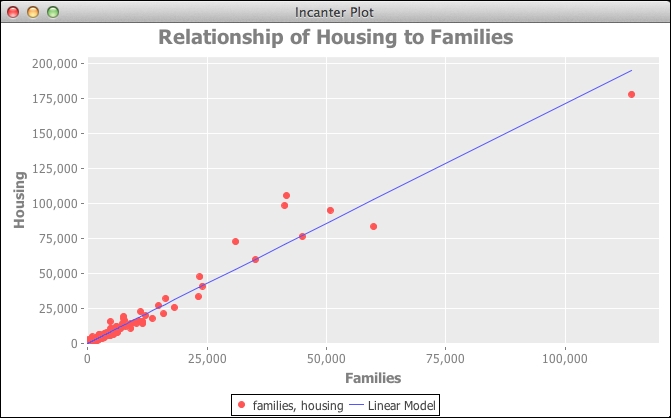
- The F test looks good, as does the r-square value. Our hypothesis looks like it probably holds. Let's look at a graph of the data, too, though:
 (def housing-chart
  (doto
    (c/scatter-plot families housing
                    :title
                    "Relationship of Housing to Families"
                    :x-label "Families"
                    :y-label "Housing"
                    :legend true)
    (c/add-lines families (:fitted families-lm)
                 :series-label "Linear Model")
    (i/view)))
To fit the line to the data, Incanter uses least squares linear regression. This tries to minimize the square of the distance of each point from the line.
For more information, Stat Trek has a nice overview of this method at http://stattrek.com/regression/linear-regression.aspx