
Your Electron application is up and running, so now is an excellent time to see real-time analytics in action. Let's get started:
- Navigate to your Nucleus account and select the application you created earlier.
- The first thing you are going to see is the real-time user statistics, as shown in the following screenshot:
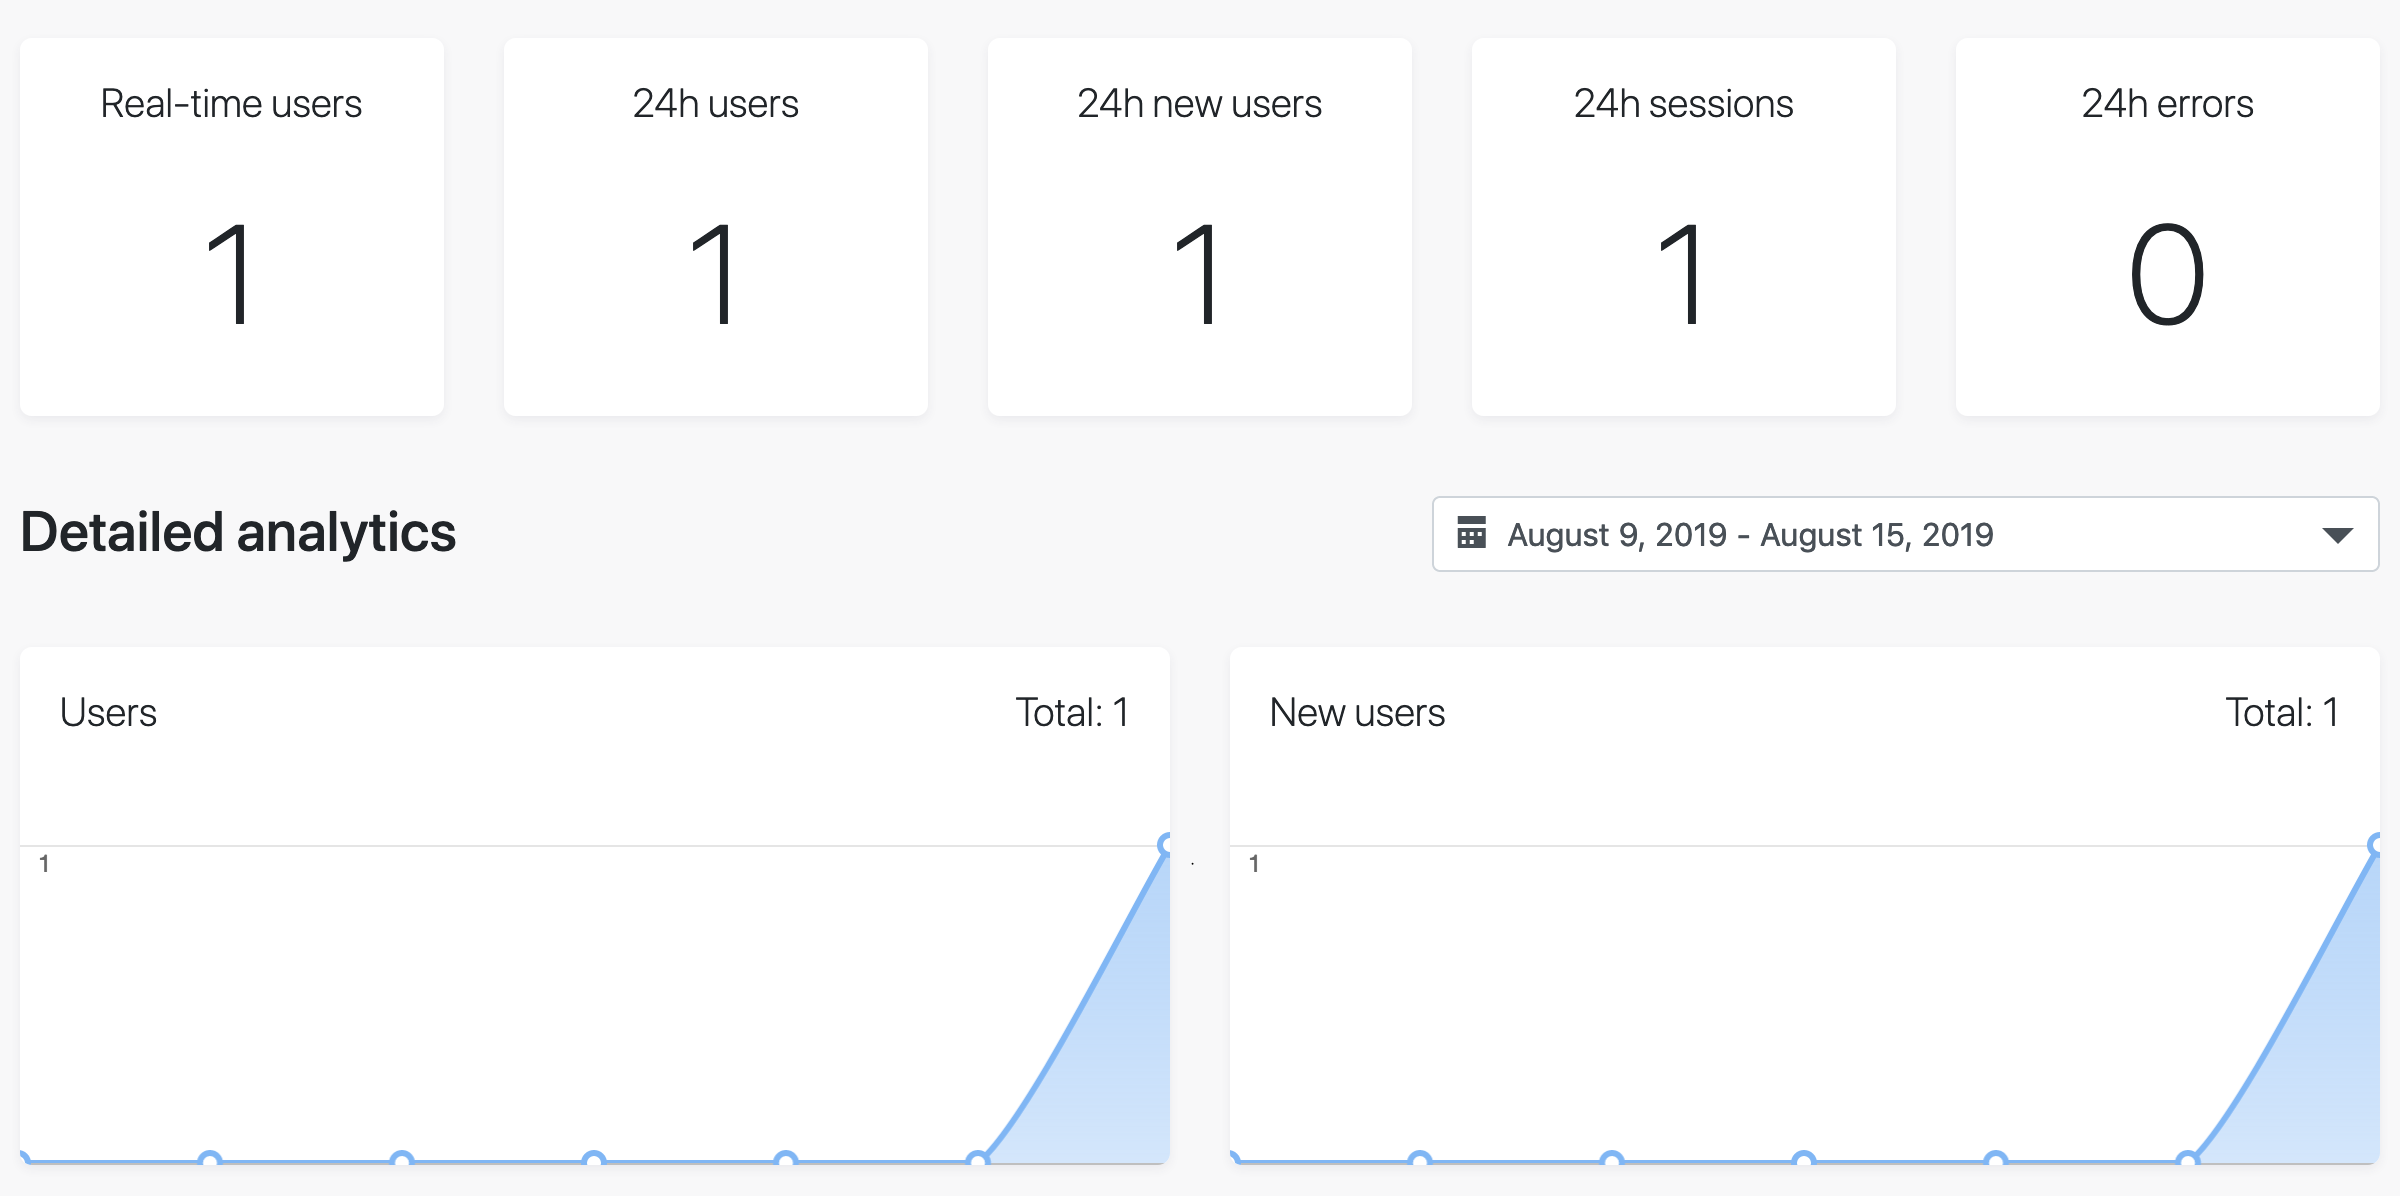
As you can see, the service reflects our running application and displays one real-time user in the chart.
This analysis provides the following information:
- The number of real-time users
- The number of users that used your application in the last 24 hours
- The number of new users that used your application in the last 24 hours
- The number of sessions that were opened in the last 24 hours (the users launched your application multiple times)
- The number of errors the applications raised in the last 24 hours
- Next comes the detailed analytics. You will be able to beautiful graphs of existing users compared to new users over time. This service allows you to select different time ranges as well.
- Below this detailed analytics information, you will be able to see the events our application instances raise:

As you can see, the service already contains data about the APP_LAUNCHED event we raised in our code. Here, we can check all kinds of events, as well as the graph of calls over time.
Other important information you can inspect here is as follows:
- The version of your application (always 0.0.0 when you're running in debug mode; this can also be detected from your application properties).
- The platform. As you can see, I'm using macOS to run the demo.
- The system languages that are being used by the users of our application (this helps us detect whether we need to localize the user interface based on our audience).
- Note that you can also provide custom values for the application's version and language. You should do this in case the Nucleus library fails to auto-detect them or if you want to use a custom mechanism to detect and track that data. You may want to pass these custom options when you create a new instance of Nucleus in the main.js file:
const Nucleus = require("electron-nucleus")("<App Id>", {
  version: '1.0.0',
  language: 'en'
});
- Other valuable indicators are geographical location and usage in terms of the time of the day:
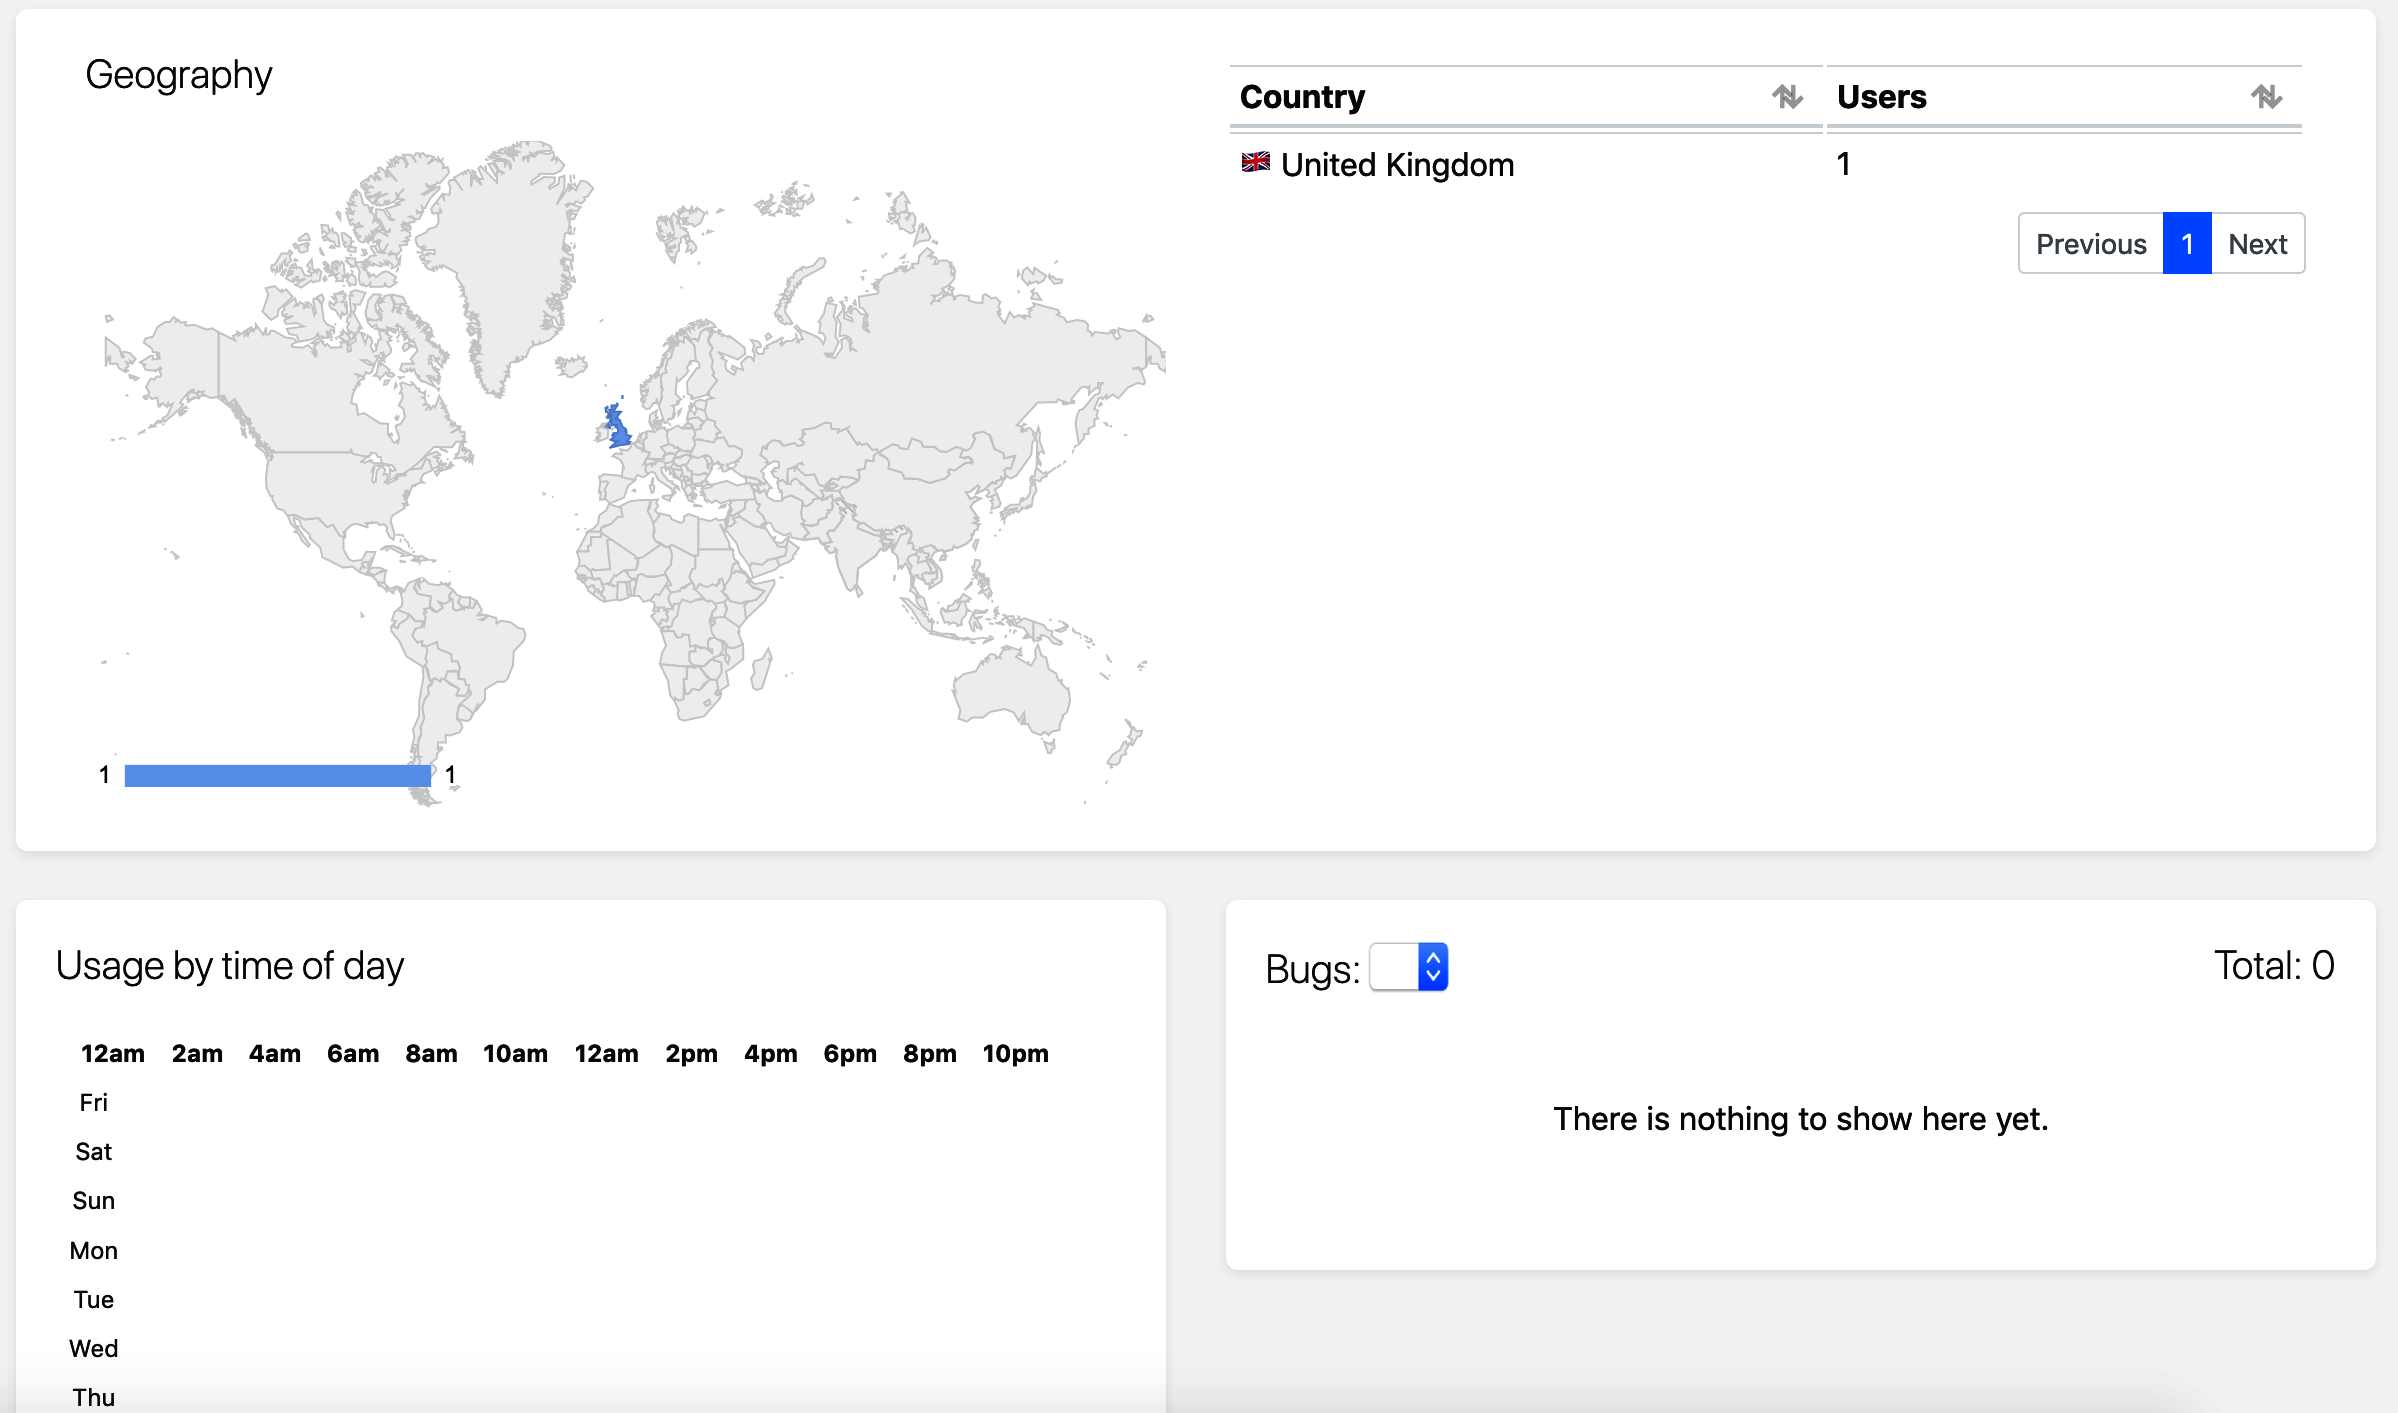
Nucleus provides a nice-looking chart showing all the countries of origin for the users of your application. This provides a good overview of your user base, as well as insight into where your application is popular.
- If you scroll a little bit further, you should see the following sets of charts:
- Sessions
- RAM Available
- Server usage (all events)
- Events use
These can be seen in the following screenshot:
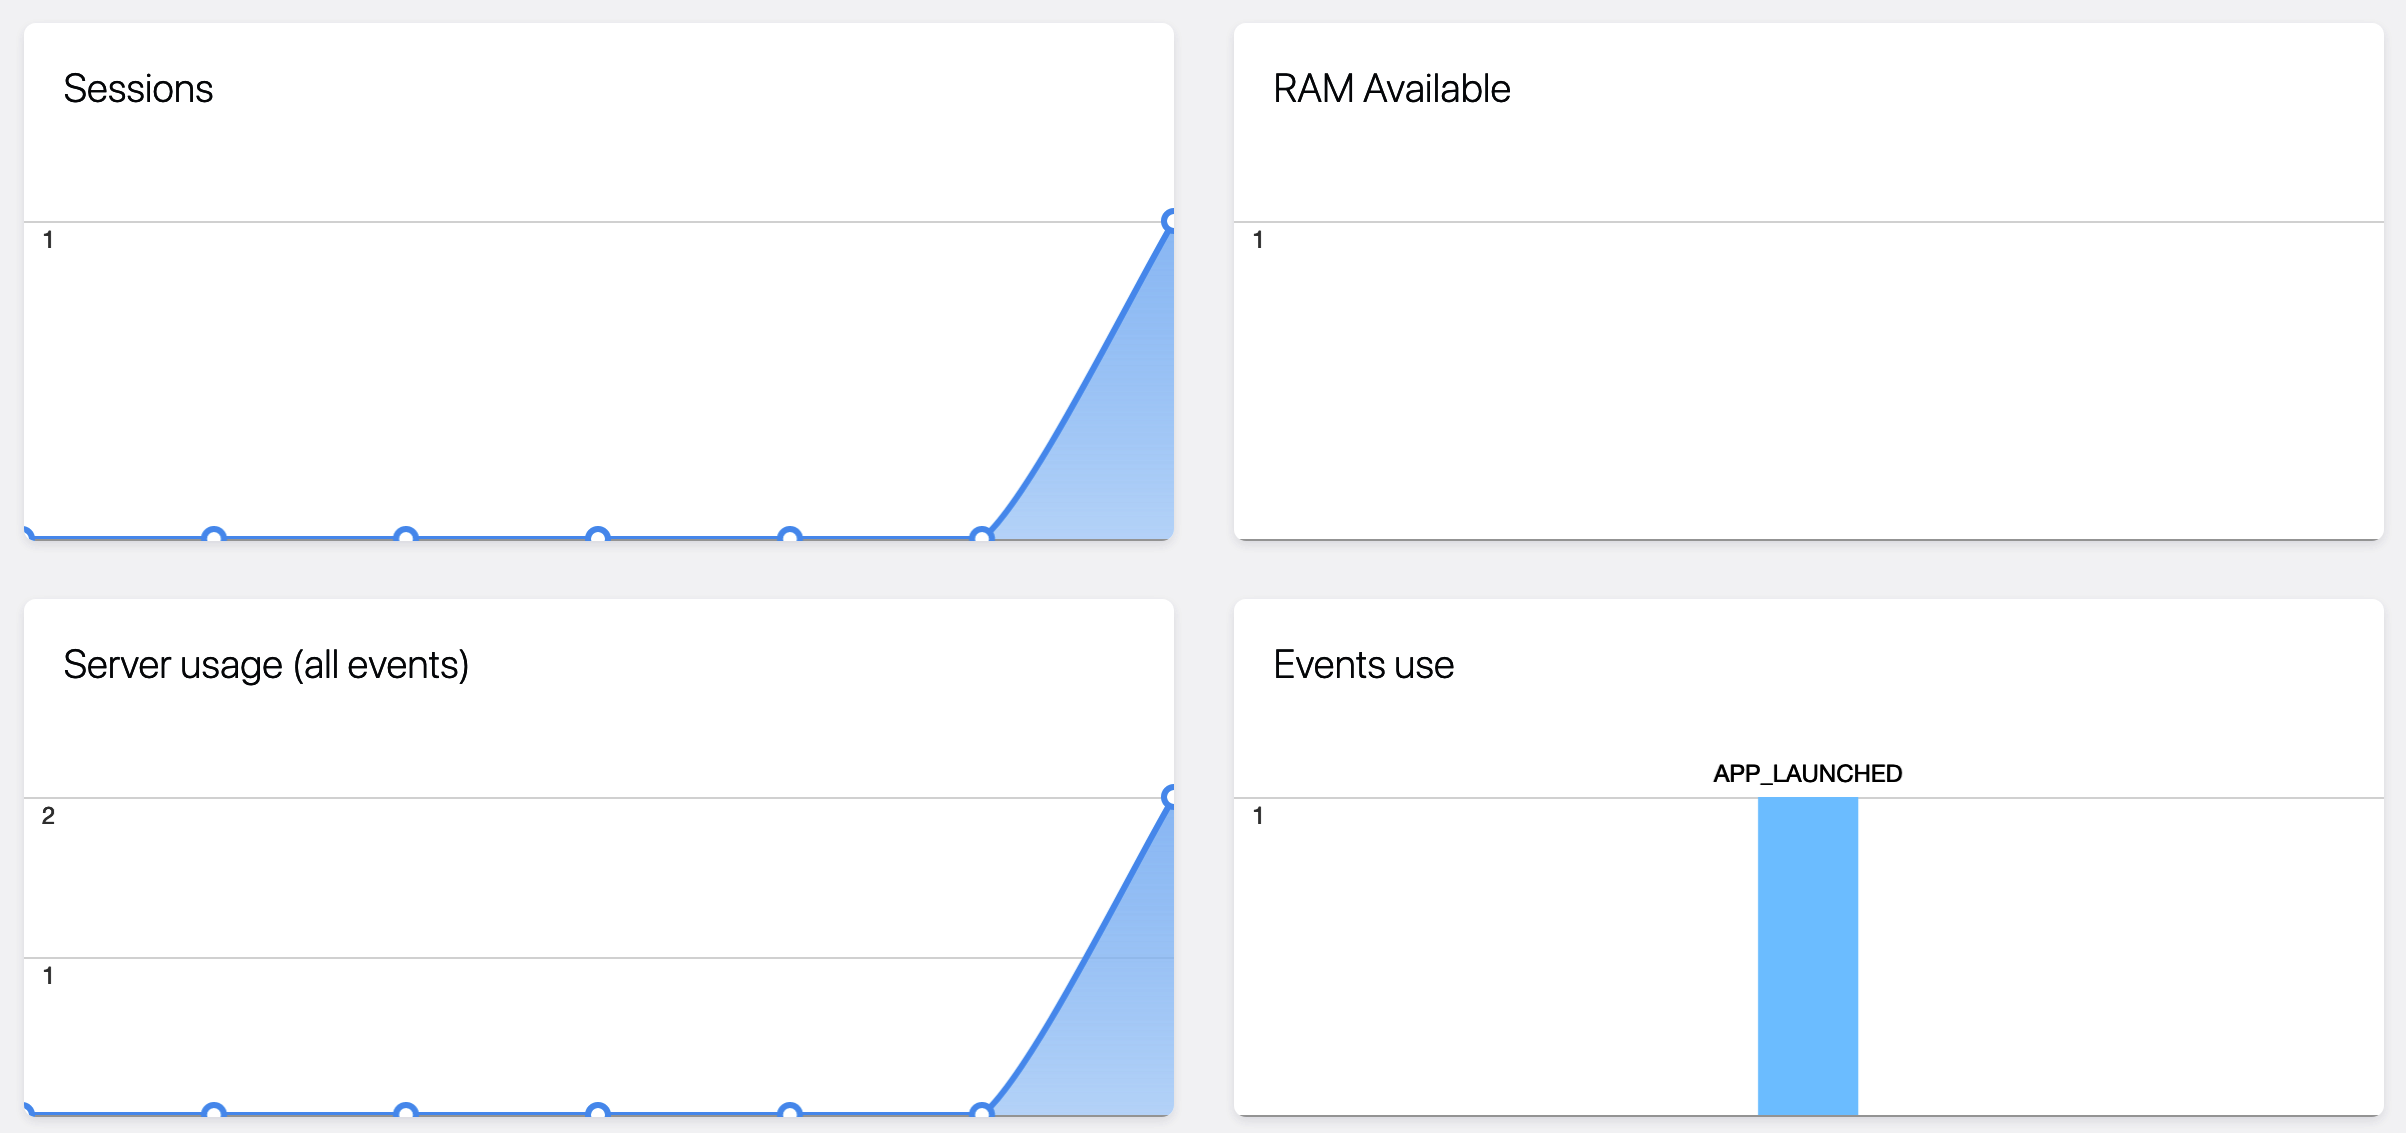
You may see all of these in use at some point, especially RAM Available, since this helps us detect memory leaks or a lack of RAM on our user's machines.
- In the middle of the left sidebar, there's also a beta version of the Live View chart, as shown in the following screenshot:
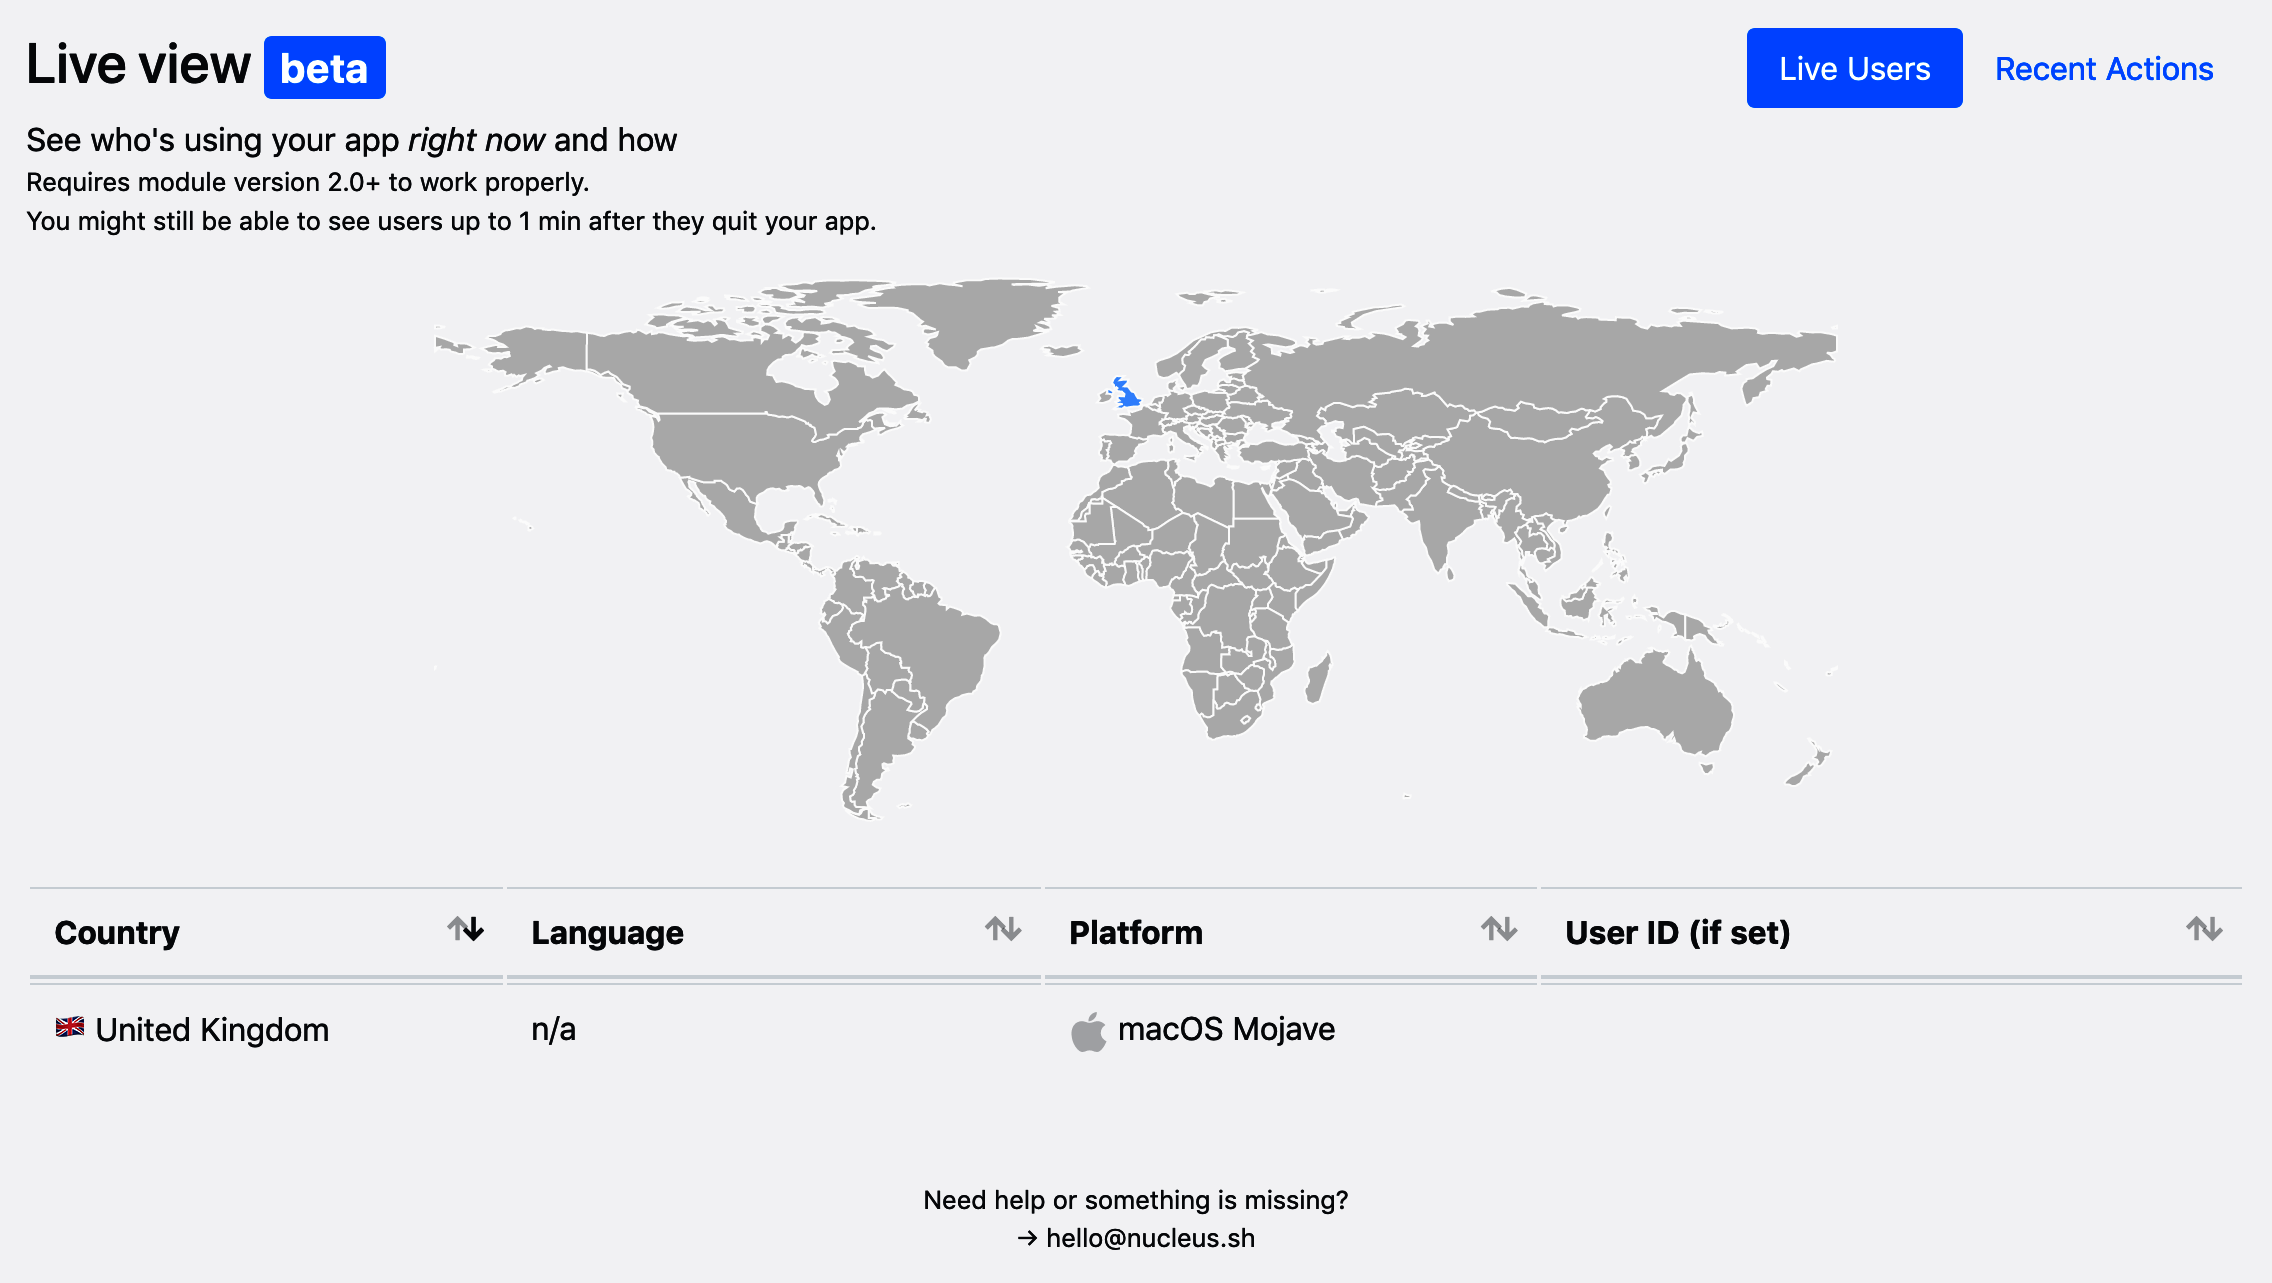
This chart shows you the users who are actively using your application on a geographical map, alongside information about them, including the following:
- Country
- Language
- Platform
- User ID
As you can see, right now, there's a single user from those United Kingdom using the application. The application is running on the macOS Mojave operating system, and no dedicated user ID has been provided.