
Metrics and Indicators as Key Organizational Assets for ICT Security Assessment
Luis Olsina, Alexander Dieser and Guillermo Covella, National University of La Pampa Engineering School, Santa Rosa, LP, Argentina
In this chapter we state that metrics and indicators are key, reusable organizational assets for providing suitable data and information for analyzing, recommending, and ultimately making decisions. In a nutshell, the metric represents the specification of a measurement process that transforms an entity attribute (i.e., the input; such as a security property) into a measure (i.e., the output, which is data), and the (elementary) indicator is the specification of an evaluation process, which has as input a metric’s measure and produces an indicator value (i.e., information). There is abundant literature on ICT security and risk assessment, but very often basic issues such as why, what, how, when, who, and where to measure and evaluate are weakly intertwined and specified. One hypothesis in our research is that, without appropriate recorded metadata of information needs, attributes, metrics, and indicators, it is difficult to ensure that measure and indicator values are repeatable and consistently comparable among an organization’s measurement and evaluation (M&E) projects. We show the added value of metrics and indicators as informational resources for M&E processes, illustrating a couple of them from a system security practical case.
Keywords
metric; indicator; measurement; evaluation; ICT security vulnerability; security quality model; risk; GOCAME strategy
Information in this chapter
• Added value of supporting the ICT Security/Risk assessment area with a well-established measurement and evaluation strategy
• Foundations for a consistent specification of metrics and indicators for Security characteristics and attributes
• Illustration of metrics and indicators from an actual ICT Security and Risk evaluation study
Introduction
Data and information are basic inputs for many processes. While data usually comes from facts, measures, formula calculations, and so on, information is the meaningful interpretation of data for a given purpose, user viewpoint, and context. Recall the saying, “If you do not know where you are, a map will not help you reach your destination.” In the same way, lack of data and information to understand a given situation prevents any effort—even with enough resources—from helping you reach your ultimate goal, such as improvement. We cannot improve what we cannot understand, and we cannot appropriately understand without analyzing consistent data and information. In this chapter, we state that metrics and indicators are basic, yet key, organizational assets to provide suitable data and information for analyzing, recommending, controlling, and monitoring.
With the aim of performing measurement and evaluation (M&E) projects and programs in a systematic way, software organizations should clearly establish an M&E strategy that includes a set of principles, activities, methods, and tools to specify, collect, store, and use trustworthy metrics and indicators and their values [1]. Moreover, in order to make the analysis and decision-making processes more robust, it is necessary to ensure that measures and indicators values are repeatable and comparable among the organization’s projects. Therefore, it should be mandatory to store not only M&E data but also metrics and indicators metadata such as, for example, measurement procedure, scale, scale type, unit, elementary indicator model, and acceptability levels.
As a matter of fact, metrics and indicators should be seen as designed and versioned by-products or resources stored in an organizational repository [2]. A metric is the specification of a measurement process description that transforms an entity attribute (i.e., a single quality) into a measure (i.e., data). An elementary indicator is the specification of an evaluation process description, which has as input a metric’s measure and produces an indicator value (i.e., contextual information). However, when we look at recognized literature [3–6,1,7], we see that what a metric and an indicator mean and how they fit in for a given M&E project, as well as issues such as why, what, who, when, where, and how (W5H) to measure and evaluate, are very often poorly linked and specified. To make things a bit more complicated, we have often observed a lack of consistent consensus among M&E terminological bases in different recognized standards and manuscripts, or sometimes terms are absent altogether [8]. This is also true for other areas, such as security.
The particular contributions of this paper are: (i) a thorough discussion of the specification of metrics and indicators as versioned by-products for M&E process descriptions; (ii) the illustration of metrics and indicators from an actual ICT security and risk evaluation study, highlighting the importance of recording not only data but also the associated metadata of information needs, context, attributes, metrics, and indicators to ensure repeatability and consistency among an organization’s projects; and (iii) the added value of supporting the ICT security/risk assessment area with an M&E strategy, which is based on metrics and indicators. This integrated strategy, named GOCAME (Goal-Oriented Context-Aware Measurement and Evaluation) [2,9], can be used to understand and improve the quality or capability quality of any organizational entity or asset. Specifically, we discuss metric and indicator specifications for vulnerability attributes regarding the “security” characteristic [10] for an information system as the target entity.
It is worth mentioning that vulnerabilities can be seen as inherent weaknesses in a target entity that could be exploited by a threat source. Most of the vulnerable capabilities/attributes of a target system can be identified, for instance, with security controls either that have not been applied or that, while applied, retain some weakness [11]. Hence, understanding the current quality acceptability level met for each vulnerability attribute can help to assess the risk and planning actions for improvement—that is, risk reduction—by implementing the risk treatment from the impact viewpoint. The underlying hypothesis is that each meaningful attribute associated with the target entity to be controlled should show the highest quality satisfaction level as an elementary non-functional requirement. The higher the security quality indicator value achieved for each attribute, the lower the vulnerability indicator value and so also the potential impact.
Following this introduction, we provide an overview of the GOCAME strategy, focusing on its M&E conceptual framework and process (including the W5H issue) to better understand the designing of metrics and indicators. We then analyze concrete metrics and indicators for security, fleshing out their specification templates. Data and metadata stemming from a practical case are analyzed following an abridged presentation of how to link vulnerability attribute values with risk assessment. We review related work and then draw the main conclusions and outline future work.
GOCAME strategy overview
Measurement and analysis is an example of a basic CMMI process area at level 2 of the staged representation [3] intended to support other process areas by means of measures. Therefore, in CMMI measures and their interpretation for a given information need are considered key inputs to assist and analyze all other process areas. Moreover, in order to support consistency in different M&E projects, well-established M&E strategies are also needed. For instance, GOCAME is based on three main principles or capabilities: (i) a conceptual framework utilizing a robust terminological base, (ii) a well-defined M&E process, and (iii) evaluation methods and tools.
GOCAME’s first principle is that designing and implementing an M&E program requires a sound M&E conceptual framework. Often, organizations conduct measurement programs that start and stop because the organization doesn’t pay enough attention to the way non-functional requirements, contextual properties, metrics, and indicators should be designed, implemented, and analyzed. This endeavor requires an M&E framework built on a rich conceptual base, that is, on an ontological base, which explicitly and formally specifies the main agreed concepts, properties, relationships, and constraints. To accomplish this, we developed the C-INCAMI (Contextual-Information Need, Concept model, Attribute, Metric, and Indicator) framework and its components [2] based on our metrics and indicators ontology [8].
GOCAME’s second principle requires a well-established M&E process in order to guarantee repeatability in performance of activities and consistency of results. A process prescribes a set of phases, activities, inputs and outputs, sequences and parallelisms, roles, check points, and so forth. In [12], a process model for GOCAME was proposed that is compliant with both the C-INCAMI conceptual base and its components.
GOCAME’s third principle is methods and tools, which can be instantiated from both the conceptual framework and the process. While activities state "what" to do, methods describe "how" to perform these activities, which in turn can be automated by tools.
Next, we outline GOCAME’s conceptual framework and general process (and the W5H mnemonic rule) for better understanding the metric and indicator modeling described later in the chapter.
GOCAME conceptual framework
GOCAME is a multi-purpose strategy that follows a goal-oriented and context-sensitive approach in defining and performing M&E projects. GOCAME is a multi-purpose strategy because it can be used to evaluate (i.e., understand, improve, etc.) the quality of entity categories, such as product, system, or resource, by using their instantiated quality models. Moreover, the evaluation focus can vary, ranging, for example, from external quality and non-vulnerability to cost.
GOCAME´s first principle is its conceptual framework, which has six components, namely: (i) M&E project, (ii) non-functional requirements, (iii) context, (iv) measurement, (v) evaluation, and (vi) analysis and recommendation. The components shown in Figure 2.1 are described below. For more details, see [2].
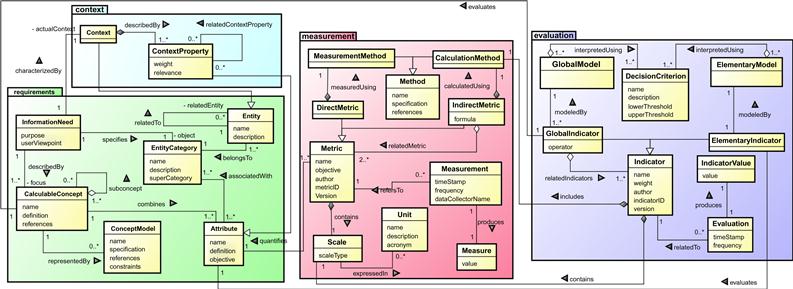
Figure 2.1 Main concepts and relationships for the C-INCAMI requirements, context, measurement, and evaluation components.
The non-functional requirements component (the requirements package in Figure 2.1) allows for specifying the information need of any M&E project. It identifies the purpose (e.g., understand, improve, control, etc.) and the user viewpoint (e.g., developer, security administrator, etc). In turn, the component focuses on a calculable concept, such as quality, security, or reliability, and specifies the entity category to evaluate, for example, a resource, a system, and so on. The leaves of an instantiated model (a requirements tree) are attributes associated with an entity category. Thus, information need is defined as “insight necessary to manage objectives, goals, risks, and problems,” entity as “a concrete object that belongs to an entity category,” and attribute as “a measurable physical or abstract property of an entity category.”
The context component (the context package) uses a key term, “context,” which is defined as “a special kind of entity representing the state of the situation of an entity, which is relevant for a particular information need.” Context is a special kind of entity in which related relevant entities are involved. Related entities can be resources such as a network or security infrastructure, the project itself, and so on. To describe the context, attributes of the relevant entities are used, which are called “context properties” (see details in [13]).
The measurement component (the measurement package) allows for specifying the metrics that quantify attributes. To design a metric, the measurement and calculation method (or procedure) and the scale should be defined. Whereas a measurement procedure is applied to a direct metric, a calculation procedure is applied to the formula of an indirect metric. A measurement produces a measure. Measurement is defined as “an activity that uses a metric definition in order to produce a measure’s value,” while a measure is “the number or category assigned to an attribute of an entity by making a measurement.” Hence, for designing a direct metric, two aspects should be clearly specified as metadata, namely, its measurement procedure and its scale. Note that the scale type depends on the nature of the relationship between values of the scale, such as keeping the order and/or distances among categories, in addition to the existence of the zero category (or class), which means absence of the measured attribute. The scale types mostly used in software engineering are classified into nominal, ordinal, interval, ratio, and absolute. Ultimately, each scale type determines the choice of suitable mathematical operations and statistics techniques that can be used to analyze the data.
The evaluation component (the evaluation package) includes the concepts and relationships intended to specify the design and implementation of elementary and global evaluations. It is worth mentioning that the selected metrics are useful for a measurement activity as long as the selected indicators are useful for an evaluation activity.
“Indicator” is the main term that allows for specifying how to calculate and interpret the attributes and calculable concepts of a non-functional requirements tree. There are two types of indicators: elementary indicators and partial/global indicators. Elementary indicators evaluate lower-level requirements, namely, attributes. Each elementary indicator has an elementary model that provides a mapping function from the metric’s measures (the domain) to the indicator’s scale (the range). The new scale is interpreted using agreed-upon decision criteria (also called “acceptability levels”), which help to analyze the level of satisfaction reached by each elementary non-functional requirement; that is, by each attribute. Partial/global indicators evaluate mid-level and higher-level requirements, that is, sub-characteristics and characteristics in a quality model (see, e.g., the instantiated “Security” model in Table 2.1). Different aggregation models (global models) can be used to perform evaluations. The global indicator’s value ultimately represents the global degree of satisfaction in meeting the stated information need for a given purpose and user viewpoint. Lastly, an evaluation represents the activity involving a single calculation, following a particular indicator specification—either elementary or global—to produce an indicator value.

GOCAME process and the W5H rule
GOCAME’s second principle is its general process, which embraces the following core activities: (i) define non-functional requirements, (ii) design the measurement, (iii) design the evaluation, (iv) implement the measurement, (v) implement the evaluation, and (vi) analyze and recommend. These high-level activities, as well as sequences, parallelisms, inputs, and outputs, are shown in Figure 2.2. Note that a repository is represented by the <<datastore>> stereotype. The proposed M&E process follows a goal-oriented approach (see [12] for process details).
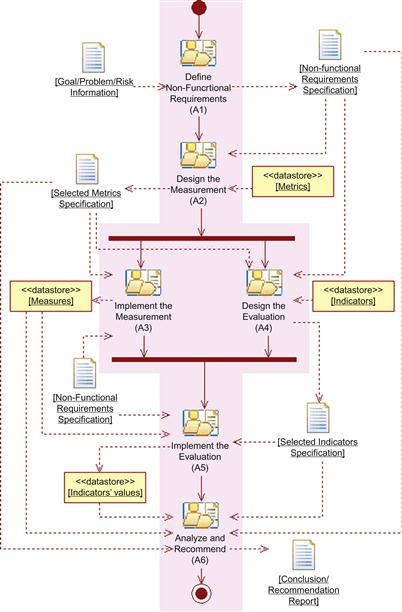
Figure 2.2 High-level activities for the GOCAME M&E process (Note that legend “A” means “activity”).
Once the requirements project has been created, the Define Non-functional Requirements (A1) activity has a specific goal, problem, or risk as input and a nonfunctional specification document as output (which contains the M&E purpose, user viewpoint, focus, entity, instantiated (sub-)characteristics and attributes, and context information). Next, the Design the Measurement (A2) activity allows for selecting the metrics from the Metrics repository to quantify attributes; the output is a metrics specification document. (Each metric specification describes the measurement procedure, scale, and other metadata, as depicted in Table 2.2.)
Table 2.2
Specification of All Metrics Involved in Quantifying the “1.2.1.2. Stored Cross-Site Scripting Immunity” Attribute
Once this task is done, the evaluation design and the measurement implementation activities can be performed, in any order or in parallel. The Implement the Measurement (A3) activity uses the specified metrics to obtain the measures, which are stored in the Measures repository. The Design the Evaluation (A4) activity allows for selecting indicators from the Indicators repository. The Implement the Evaluation (A5) activity can now be carried out. Finally, the Analyze and Recommend (A6) activity has as inputs the values (i.e., data) of measures and indicators, the requirements specification document, and the associated metrics and indicators specifications (i.e., metadata) in order to produce a Conclusion/Recommendation report.
Nelson [14] asserts that a “discussion of the why, who, what, where, and when of security metrics brings clarity and further understanding because it establishes a framework for implementing a framework to implement security metrics in your organization” ([14] p.14). We want to reinforce this idea and make it more definitive. GOCAME’s three principles mentioned previously—the M&E conceptual framework, process, and methods—help to illustrate the rationale for the W5H mnemonic rule. In the following summary we rely on the general process depicted in Figure 2.2, which in turn is compliant with the terminological framework shown in Figure 2.1.
Why should an organization tackle the M&E endeavor? The answer might be depicted in the M&E project definition and instantiation and supported by a broader quality assurance policy. Basically, there is a problem or an issue (see the goal/problem/risk input to A1, in Figure 2.2) that requires a solution driven by analysis and decision-making. For instance, the organization needs to reduce some particular entity vulnerabilities; however, as stated earlier, it cannot improve what it cannot understand, and it cannot appropriately understand without consistently analyzing data and information. The why aspect therefore embraces the concrete information need and purpose for M&E such as understand, improve, and control some relevant objective, regarding a specific user viewpoint.
What is to be measured and evaluated? This embraces the concrete target entity—and related entities including context—that belongs to an entity category. In addition, a given information need is described by a focus (e.g., the security calculable concept) to which attributes are combined. Moreover, entities cannot be measured and evaluated directly but only by means of their associated attributes and context properties. Ultimately, the non-functional requirements specification artifact (see Figure 2.2) documents to a great extent the why and the what.
How are the metric and indicator specifications developed? Metrics and indicators are reusable, versioned assets stored in organizational repositories and are selected by the A2 and A4 activities, respectively, at design time, then implemented by the A3 and A5 activities accordingly. As we analyze later in the chapter, metric and indicator specifications should be considered metadata that must be kept linked through metricID and indicatorID (for consistency reasons) to measure and indicator values produced for the A3 and A5 activities. Metadata and data sets are consumed by the A6 activity, as well.
Who is responsible for the different stages of an M&E project? Certainly, there are different levels of responsibilities and roles. In the C-INCAMI M&E project definition component (not shown in Figure 2.1), related project concepts allow for recording the responsible information. In addition, “author name” is a common field for both metric and indicator specifications and represents their creator as a piece of design. The “data collector name” (see the “measurement” term in Figure 2.1) allows for recording the name of the person responsible for data gathering for the A3 activity.
When do components of the M&E project occur? When is also recorded for each enacted measurement and evaluation. Basic questions to ask include (among others): When are metrics collected? How often are they collected? When are evaluations and analysis performed? For example, the time stamp and frequency fields under the measurement and evaluation terms allow for recording measurements and evaluations when A3 and A5 are executed.
Where is the M&E project running? Where is the entity under evaluation placed? In which context is the target entity measured and evaluated? Where is data collection for metrics performed? Some of these questions can be taken into account by the C-INCAMI M&E project definition component, including the recorded context and its associated context properties and values.
Next, we use the W5H rule to illustrate some security attributes, metrics, indicators and their outcomes for a Web application. We also discuss how to link security with risk.
Security evaluation for a web system: A proof of concept
One of the stated contributions of this chapter, as discussed in the introduction, is that metrics and indicators are key organizational assets for providing relevant data and information for analyzing, recommending, controlling, and ultimately making decisions. From the specification standpoint, metrics and indicators are designed by-products stored in an organizational repository and can be reused. For this aim, in this Section we illustrate some metrics and indicators from a practical ICT security and risk evaluation case, highlighting the importance of recording not only values but also the associated metadata, among other aspects.
Target entity and information need
One item of the above-mentioned W5H mnemonic rule considers what is to be measured and evaluated. In this study, we use a fictitious name for an actual concrete target entity, the “XYZ register system,” a student management Web system used widely in Argentinean universities. It is a Web application or system (from the entity category standpoint) commonly used by students, professors, and faculty members.
So, why should it be evaluated? Because a concrete information need was raised in early 2012 by the responsible ICT department in the ABC organization—again, a fictitious name for a real-world organization. This information need arose because of security risks from various potential threats such as students using system vulnerabilities to change their poor grades. Note that if this threat materialized, the impact on the institution’s credibility could be high.
Thus, the purpose of this information need is first to understand the current satisfaction level achieved for the external quality of the XYZ Web application, particularly for non-vulnerabilities regarding the security quality focus, from the security administrator user viewpoint. Once the indicators are analyzed and the values are measured, the current security quality satisfaction level can be determined. The purpose is then to improve the system in the areas with weakly performing indicators. The ultimate purpose is to reduce security risks by improving vulnerable attributes in the Web system by risk treatment. (Note that this paper deals primarily with the documentation of the first purpose. However, change actions were taken after yielded outcomes.)
Security characteristic specification
There is abundant literature in the ICT security area ([5,14,7,15], to mention a few), and often “security” refers to the CIA (confidentiality, integrity and availability) triad (from the non-functional viewpoint). In the ISO 25010 external (system) quality model [10], security is one of eight characteristics, which in turn is split into five sub-characteristics, namely: confidentiality, integrity, non-repudiation, accountability, and authenticity. Availability is a sub-characteristic of the reliability characteristic. Security is defined as the “degree to which a product or system protects information and data so that persons or other products or systems have the degree of data access appropriate to their types and levels of authorization” [10]. We use this ISO characteristic and three sub-characteristics for the XYZ case study. (Note that in [9] we have extended/updated some ISO 25010 (sub-)characteristics.)
Recall Figure 2.2, which shows that the output of the A1 activity is the non-functional requirements specification artifact, which mainly documents the why and what aspects. Table 2.1 represents the requirements tree instantiated for the security characteristic and its sub-characteristics such as confidentiality (coded 1.1), integrity (1.2) and authenticity (1.3). For example, integrity is defined in [10] as the “degree to which a system, product or component prevents unauthorized access to, or modification of, computer programs or data.” Moreover, we have identified all sub-sub-characteristics such as cross-site scripting immunity (1.2.1), which we define as the “degree to which the system ensures the integrity of data by providing cross-site scripting immunity capabilities” [10]. Also, we have specified 18 measurable attributes, which are italicized in Table 2.1.
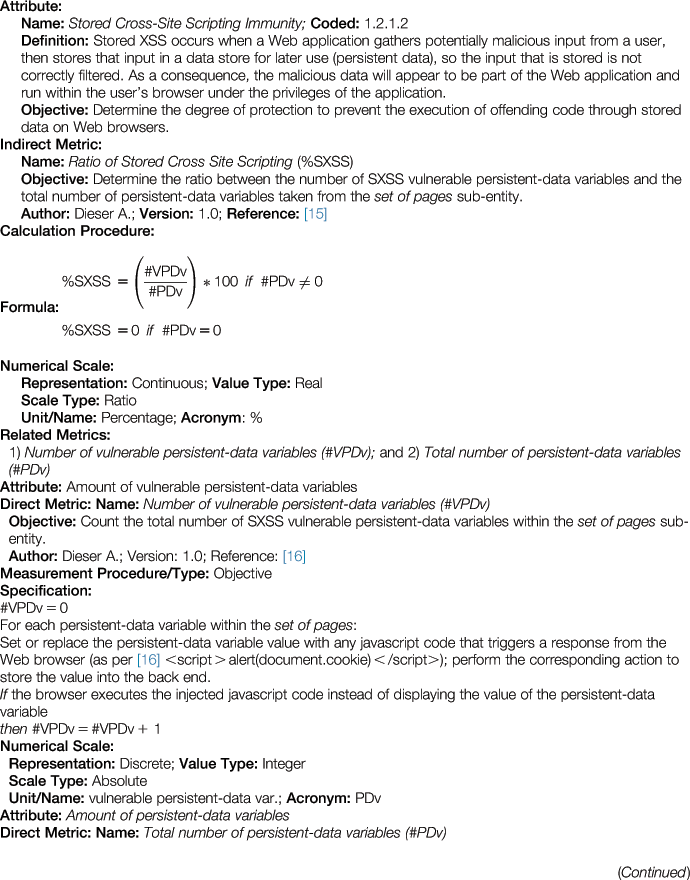
As proof of concept, we illustrate the 1.2.1.2 attribute named “Stored Cross-Site Scripting Immunity” (XSS), which is described in Table 2.2. The objective for evaluating it is to determine the degree to prevent the execution of offending code trough stored data on Web browsers. Stored XSS is particularly dangerous in application areas where a user with high privileges has access. Thus, when the administrator visits the vulnerable page, its browser automatically executes an attack. This might expose sensitive information such as session authorization tokens [16]. Below, the attribute’s metrics and elementary indicator are thoroughly specified.
Metric and indicator specifications
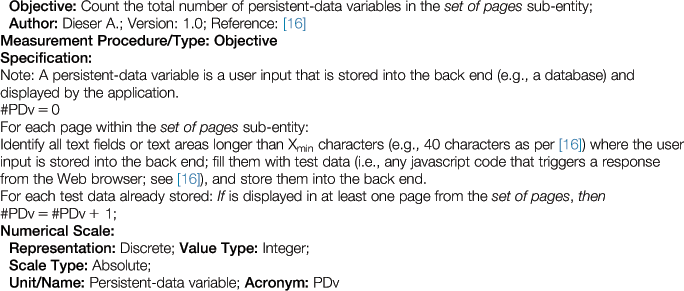
As discussed in the section titled “GOCAME Process and the W5H Rule,” the W5H rule’s how aspect deals with the metric and indicator specifications. Once the non-functional requirements are specified, the A2 activity is performed. This consists of selecting the meaningful metrics from the Metrics repository (Figure 2.2) that quantify attributes. One metric should be assigned per each attribute of the requirements tree respectively; for example, the indirect metric named “Ratio of Stored Cross-Site Scripting” was selected for quantifying the 1.2.1.2 attribute. Table 2.2 shows that this indirect metric is composed of two related direct metrics, which are also fully specified in the template. Note that an indirect metric usually has attributes of related metrics that may not be part of regular attributes shown in the requirements tree; they are necessary to quantify indirect metrics, so this information should also be linked.
While an indirect metric has a calculation method for its formula specification, a direct metric has a measurement method or procedure. For instance, the measurement procedure for the #VPDv direct metric is objective; that is, it does not depend on human judgment when the measurement is performed. The measurement method represents the counting rule, as shown in the template’s specification tag. Here, the “set of pages” sub-entity is a collection of pages chosen by evaluators from the XYZ entity according to its relevance regarding potential security impact; that is, each page is chosen given that potential vulnerabilities on it could compromise the application security.
Lastly, in many cases, a software tool can automate the measurement procedure, so this field can be added to the metric template, as well.
The metric template (see Table 2.2), as a designed and stored by-product/resource used by the A2 and A3 activities, includes metadata such as scale, scale type, unit, measurement/calculation procedure specification, tool, version, author, etc. These metric metadata allow for repeatability among M&E projects and consistency in the further analysis of data sets.
Once all metrics are selected for quantifying the 18 attributes in Table 2.1, then the A4 activity should be performed, which deals with designing the evaluation. As discussed in the section titled “GOCAME Conceptual Framework,” an elementary indicator evaluates the satisfaction level reached for an elementary requirement, that is, an attribute of the requirements tree. At the same time, a partial/global indicator evaluates the satisfaction level achieved for partial (sub-characteristic) and global (characteristic) requirements.
Table 2.3 specifies the “Performance Level of the Stored Cross-Site Scripting Immunity” (P_SXSS) elementary indicator. This indicator will help to determine the quality satisfaction level reached by the 1.2.1.2 attribute, considering the measured value of its indirect metric (as we analyze in the section titled “Implementing the M&E”). Conversely to metrics, indicators have decision criteria for data interpretation, which ultimately means information in context. As shown in Table 2.3, three acceptability levels useful for the interpretation of indicator values in percentage are employed after an agreement with evaluation stakeholders. A value between 0 and eighty represents an “Unsatisfactory” level and means that change actions must be taken with high priority; a value between 80 and 98 represents a “Marginal” level and means improvement actions should be taken; a value between 98 and 100 corresponds to the “Satisfactory” acceptability level.
Table 2.3
Elementary Indicator Template Used for Interpreting the “Stored Cross-Site Scripting Immunity” Attribute
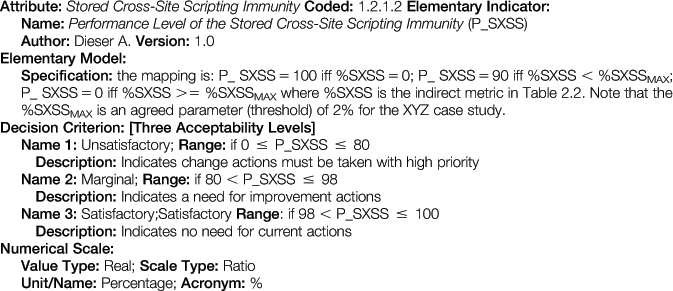
Each elementary indicator has an elementary model specification (see Table 2.3) that provides a mapping function from the metric’s measures (the domain) to the indicator’s scale (the range). In this evaluation all indicator scales are normalized to the percentage unit.
Consider the how for a global indicator, which evaluates characteristics and sub-characteristics in a requirements tree: it has similar metadata, as shown for the elementary indicator template. But instead of an elementary model it has a global (aggregation) model. An example of a global model is LSP (Logic Scoring of Preference) [17], which was used in many studies [9,18]. LSP is a weighted multi-criteria aggregation model, which has operators for modeling three kinds of relationships among inputs (that can be attributes, sub-characteristics, and characteristics of a requirements tree), namely: simultaneity (i.e., a set of C [conjunctive] operators), replaceability (i.e., a set of D [disjunctive] operators), and neutrality (i.e., the A operator). For instance, the CA moderate conjunction operator is used (as can be observed in the third column of Table 2.4) for modeling the simultaneity criterion among the 1.1, 1.2, and 1.3 security sub-characteristics. At evaluation time, if one input were zero, the output will yield zero, given the mandatory nature of the CA operator. Ultimately, an aggregation model may impose weight and operator constraints over quality model elements. The equation below follows the specification of the LSP aggregation model:
![]() (1)
(1)
where P/GI represents the partial/global indicator to be calculated; Ii stands for the (elementary) indicator value and the following holds 0 <=Ii <= 100 in a percentage unit; Wi represents weights, where the sum of weights for an aggregation block must fulfill: W1 + W2 + … + Wm=1, and Wi > 0, for i=1 to m, where m is the number of elements (sub-concepts) at the same level in the tree’s aggregation block (note that “weights” represents relative importance of elements in a given aggregation block); and r is a parameter selected to achieve the desired logical simultaneity, neutrality, or replaceability relationship.
Table 2.4
Indicator Values in [%] for Security.
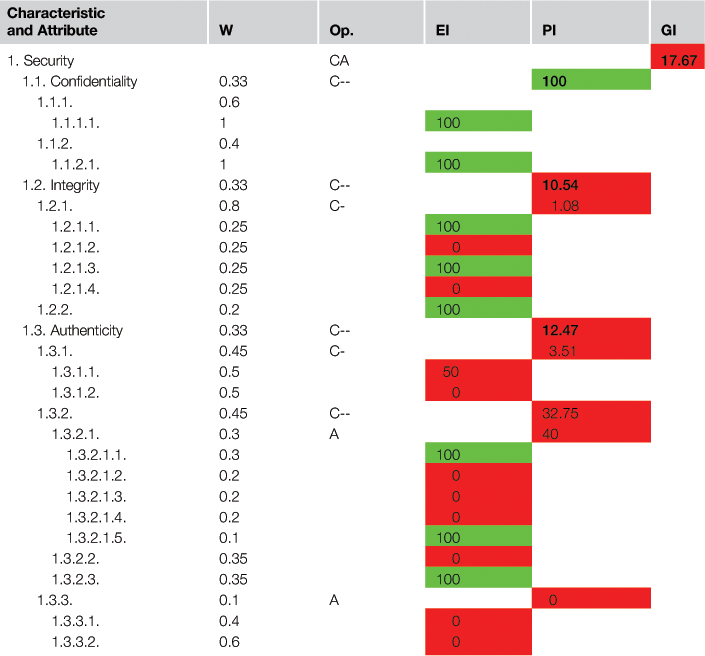
W Stands for Weight; Op. Stands for LSP Operator; EI Stands for Elementary Indicator; P/GI Stands for Partial/Global Indicator
Light gray represents a value that falls between 98–100; black represents a value that falls between 80–98 (as none of the values fall between this range it is not shown in this table); and dark gray means a value that falls between 0–80.
As result of carrying out the whole M&E design and selection process—activities A1, A2, and A4 in Figure 2.2—the following artifacts are yielded: the nonfunctional requirements specification, the metrics specification, and the indicators specification documents.
Implementing the M&E
Aspects of the W5H rule’s when and where are strongly related to the Implement the Measurement and Implement the Evaluation activities. Particularly, for each executed M&E project, the A3 and A5 activities produce measure and indicator values, respectively, at given moments in time and at specific frequencies.
Considering the W5H rule, we can indicate that data collection for direct metrics was performed by September, 2012, over the XYZ’s “set of pages” sub-entity (which were 20 relevant pages), in the context of the ABC institution.
In our example case, the calculated %SXXS indirect metric value yields 25%. This value comes from gathering the data of both direct metrics—resulting in #VPDv=3 and #PDv=12 respectively, following their specified measurement procedures—and using its (Table 2.2) formula. In a preliminary analysis, we observe that three well-identified persistent-data variables on “XYZ” are vulnerable for this kind of attack (see 1.2.1.2 attribute definition in Table 2.2). (Note that we could use the #VPDv direct metric alone instead of the %SXXS indirect metric for quantifying 1.2.1.2, but an indirect metric, as proportion, conveys a bit of information).
While measurement produces data, evaluation produces contextual information. Hence, the level of quality (non-vulnerability) achieved by the 1.2.1.2 attribute should be appropriately interpreted by applying the elementary indicator specified in Table 2.3. Enacting the P_SXSS elementary model, the 25% metric value maps to the 0% indicator value, as shown in the fourth column of Table 2.4. This outcome falls at the bottom of the “Unsatisfactory” acceptability level, meaning that a change action with high priority must be taken for this attribute, because it represents an actual security vulnerability.
Once all measurements and elementary evaluations for interpreting the 18 attributes are performed, the aggregation model (see Equation 1) using the agreed-upon weights and LSP operators should be executed. This model yields partial and global indicators values, as shown in the last two columns of Table 2.4.
The A6 activity (analyze and recommend) has inputs of: the values of measures and indicators (e.g., information shown in Table 2.4), the non-functional requirements specification document, and the associated metrics and indicators specifications (i.e., metadata as shown in Tables 2.1, 2.2, and 2.3) in order to produce the conclusion/recommendation report.
In the next section we give some clues on how to link the security quality M&E approach with the risk assessment and treatment issues. We also introduce some basic concepts for the ICT risk area.
Risk and security vulnerability issues
There are abundant standards and much research in software risk management (SRM), risk assessment processes, and techniques, as well as in risk vocabularies, including [19,3,20,21,11], among others. However, an ontology for the risk domain as we have specified for metrics (measurement) and indicators (evaluation) is, to the best of our knowledge, still missing. Here, without entering in specific discussions of the risk terminological base, some terms defined in the section titled “GOCAME Conceptual Framework,” such as as “entity” and “attribute,” are used.
Entity categories such as software development/service project, product, and system and its components involve risks at different developmental or operative stages that can be identified, assessed, controlled, treated, and monitored using a systematic SRM approach. A risk can be defined as an undesirable consequence of an event on a target entity. This target object represents an organizational asset, where an asset is an entity with added value for an organization. Potential losses affecting the asset are also called the “impact” of the risk. Also, the term “vulnerability” is commonly used in the security area, which refers to a weakness of an entity that can be exploited by a threat source (entity).
SRM suggests actions to, for example, prevent risk or reduce its impact on a target entity instead of dealing with its further consequences. Thus, we can identify the most relevant attributes associated with an entity that can be more vulnerable (weak) from triggered external/internal events. Then, by understanding the relevant attributes’ strengths and weaknesses,—by using an evaluation-driven approach such as GOCAME, for example—actions for change can be recommended and planned for further treatment implementation.
Usually, SRM includes a set of policies, processes, methods, techniques, and tools to identify and analyze risks, understand weaknesses, prepare preventive/perfective actions, and control risks on the target entity. Particularly, for risk assessment three general activities are proposed in [21],namely: (i) Risk Identification, (ii) Risk Analysis, and (iii) Risk Evaluation. Additionally, Establishing the Context, Risk Treatment, Risk Monitoring and Review, and Communication are common processes for a well-established SRM strategy.
For example, the Risk Evaluation activity is defined as “the process of comparing the results of risk analysis with risk criteria to determine whether the risk and/or its magnitude is acceptable or tolerable,” and it assists in the decision about risk treatment, which is defined as “the process to modify risk” [20]. In fact, risk treatment can involve: (i) avoiding the risk by deciding not to start or continue with the activity that gives rise to the risk, (ii) taking or increasing risk in order to pursue an opportunity, (iii) removing the risk source, (iv) changing the likelihood (probability), (v) changing the consequences, (vi) sharing the risk with another party or parties, and (vii) retaining the risk by informed decision.
Returning to our example case, if we apply item (v) to designing the measurement, evaluation, and improvement plan, then the plan should describe actions to understand the current situation on the target entity vulnerabilities, then try to reduce the risk consequences of it. Following the GOCAME strategy, the system (target entity) vulnerability attributes, metrics, and indicators should be identified and selected in order to manage the risk status and determine whether the risk is reduced after treatment. The underlying hypothesis is that each meaningful attribute to be controlled should meet the highest quality satisfaction level as an elementary non-functional requirement. Therefore, the higher the security quality indicator value achieved for each attribute, the lower the vulnerability indicator value and, consequently, the potential impact. In percentage terms, we can easily transform the quality elementary indicator value to the vulnerability elementary indicator value as follows:
![]() (2)
(2)
Note that the elementary model and acceptability levels shown in Table 2.3 can be also transformed accordingly for the new vulnerability indicator, if needed. So for each relevant attribute Ai of the requirements tree (as in Table 2.1), we can calculate the risk elementary indicator value (magnitude) by slightly adapting the well-known formula:
![]() (3)
(3)
Let us suppose that for the 1.2.1.2 attribute, the probability of an attack occurrence is determined to be 0.7; then the risk magnitude is calculated as RI_A1.2.1.2=0.7 * 100=70%, where 100 stems from VI_A1.2.1.2 (see Equation 2 and the A1.2.1.2 value in Table 2.4). Moreover, the aggregation model specified in Equation 1 can be used for calculating the current state of partial and global risk indicators based on risk elementary indicator magnitudes. It is worth mentioning that GOCAME methods for evaluation are based on multi-criteria (attribute) decision analysis, which can also be used for risk assessment, as indicated in [21].
In short, our approach allows accomplishing the above plan with specified actions to first understand the current situation on the target entity vulnerabilities, and then to try to reduce the impact on it by performing improvement change actions on weakly benchmarked attributes/capabilities. So as the reader may surmise, the risk reduction—per each vulnerability attribute or per aggregated characteristic—can be calculated after improvement actions (risk treatment) and re-evaluation are performed.
The purpose of this discussion is to provide a starting point for how to intertwine our quality M&E approach with security and risk assessment and treatment issues. The topic will be thoroughly analyzed in future writings.
Metrics and indicators for repeatable and consistent analysis: a discussion
We have shown in Tables 2.2 and 2.3 the specification of security metrics and a quality elementary indicator, which are seen as reusable resources and versioned by-products for M&E process descriptions. It is worth restating that metric and indicator specifications should be considered metadata that must be kept linked, for the sake of analysis comparability and consistency, to measures (i.e., data) and indicator values (i.e., information shown in Table 2.4).
Let’s suppose, as proof of the concept, that the same “Stored Cross-Site Scripting Immunity” (1.2.1.2) attribute can be quantified by two metrics. (Note that, in Figure 2.1, an attribute can be quantified for many metrics, but just one must be selected for each concrete M&E project.) One direct metric (DM1) in the Metrics repository is the “Number of Vulnerable Persistent-Data Variables” (#VPDv), as specified in Table 2.2. The other metric (DM2) has a different measurement method and scale type; that is, DM2 considers the criticality of existing vulnerable persistent-data variables as a measurement procedure and a categorical scale, specifically, an ordinal scale type with values ranging from 0 to 3, where 3 represents the higher criticality (catastrophic category), and 0 the lower. After many M&E projects using the same security (sub-)characteristics and attributes are executed, all collected data are recorded in the Measure repository. In some projects, DM1 was used, and in others, DM2 was used for quantifying the same 1.2.1.2 attribute. Then, if metric metadata of recorded data were not linked appropriately—say, to the measured value of 3, which can stem from both metrics in different projects—the A6 activity will produce inconsistent analysis if it takes all these related projects as inputs. The inconsistency is due to the 3 value, which, depending on the metric used, has different scale properties. (Recall that each scale type determines the choice of suitable mathematical operations and statistics techniques that can be used to analyze data and datasets.) In summary, even if the attribute is the same, the two metric measures are not comparable.
We have discussed the fact that metric and indicator (metadata) specifications can both be regarded as versioned by-products. That is, each metric specification must have unique metricID fields and versions in order to keep traceability, repeatability, and comparable accuracy in different analyses. Let’s suppose two metrics have the same ID, since both share most of the same metadata specification—for example, the same measurement procedure, scale, scale type, unit, etc.—but differ from each other only in the tool that automates the same measurement procedure specification. We suggest that, to ensure comparable accuracy, both metrics should share the same ID but differ in the metric version (e.g. v1.0 and v1.1). However, in other cases with more meaningful metadata variations, in order to guarantee repeatability and accuracy, the version field should be a must. Furthermore, metrics in many cases are different; that is, they must not share the same ID, although they are intended to quantify the same attribute. This is so for the abovementioned DM1 and DM2, which are different metrics.
Here we analyze some of the values of the indicators shown in Table 2.4 with respect to the usefulness of data and information for the A6 activity. Security as a global quality indicator value (17.67) falls in the lower threshold of the “Unsatisfactory” acceptability level, so an urgent action of change is recommended. We see that, at the sub-characteristic level, 1.1 (confidentiality) is satisfactory (100%), but both 1.2 (integrity) and 1.3 (authenticity) partial indicator values are at the bottom of the “Unsatisfactory” range. As a general conclusion, it emerges that XYZ should strengthen these two sub-characteristics. To improve them, we have to analyze and plan which change actions should be prioritized, considering, for instance, the poorly benchmarked elementary quality indicators and their potential risk consequences.
For instance, for Integrity, and particularly for the 1.2.1 sub-characteristic, the 1.2.1.2 ("Performance Level of the Stored Cross-Site Scripting Immunity"), and the 1.2.1.4 elementary indicator values are 0%, whereas all attributes in the group must satisfy 1.2.1 simultaneously due to the C- operator. In order to analyze the cause of the 1.2.1.2 bad indicator performance, we have to look at data coming from its indirect metric value. The %SXXS value is 25%, which was calculated using the formula in Table 2.2 from #VPDv=3 and #PDv=12, respectively. So there are three identified vulnerable persistent-data variables to be improved within the concrete set of pages for XYZ.
Ultimately, by using our strategy based on metrics and indicators, it was possible, first, to understand at that moment (by September, 2012) the situation on the XYZ vulnerabilities, and then, by the end of 2012, to reduce their impact by performing improvement actions on weakly benchmarked attributes/capabilities. As the reader can surmise, in order to increase the 1.2.1.2 indicator value to 100%, the three vulnerable persistent-data variables identified must be fixed. So metric specifications also help to design and implement the change actions for the improvement plan.
Related work
Considering the research literature, what metrics and indicators mean and where they properly fit in with regard to specific M&E processes and strategy have often been understated or neglected. Furthermore, there are abundant standards and much research in areas such as measurement and analysis [22,3,4,6,1], and ICT security and risk assessment [19,5,21,11,7], but issues such as why, what, who, when, where, and how to measure and evaluate have often been poorly intertwined and specified.
For instance, as quoted in the section titled “GOCAME Process and the W5H Rule,” Nelson states that a “discussion of the why, who, what, where, and when of security metrics brings clarity and further understanding because it establishes a framework for implementing a framework to implement security metrics in your organization.” Nevertheless, in our opinion, Nelson fails to discuss the W5H mnemonic rule with more robust conceptual grounds, as we did based on GOCAME first and second principles introduced in the section titled, “GOCAME Strategy Overview.” Moreover, the how issue, which precisely deals with metric and indicator specifications, is also left aside when the author remarks “How is left as an exercise for the reader” ([14], p.14).
We have developed an integrated M&E strategy that we call “GOCAME,” which is made up of three capabilities: the conceptual framework, the process, and the methodology. The metric and indicator ontology used by the C-INCAMI conceptual framework has similarities to the one presented in [23] and then slightly refined in [24]. However, in [8], we have modeled some terms (e.g., elementary indicator, global indicator, etc.) and some relationships (e.g., measurement and measure, metric and indicator, among others) that differ semantically with those proposed in [24]. In addition, we have enlarged the metric and indicator ontology with context terms and relationships [13], while in [24] these are missing. Moreover, GOCAME exhibits a terminological correspondence between the C-INCAMI conceptual framework and process specifications.
Lastly, in order to support repeatability and consistency of results among different evaluation and analysis projects, well-established M&E strategies are needed. In [18], two integrated strategies, GQM+Strategies [22] and GOCAME, were thoroughly assessed and analyzed. The study drew GQM+Strategies’ performance lower than GOCAME regarding the suitability of the conceptual base and framework. Note that GQM+Strategies enhances the GQM (Goal-Question-Metric) approach [25], though GQM+Strategies completely reuses the GQM. Authors in [1] pointed out that GQM is not intended to define metrics at a level of detail suitable to ensure that they are trustworthy; in particular, whether or not they are repeatable. In addition, contrary to the GOCAME strategy, GQM lacks a sound conceptual base; therefore, it cannot assure that M&E values (and their associated metadata) are consistent and trustworthy for further analysis among projects.
Ultimately, the sound and complete specification of metrics and indicators, as shown in Tables 2.2 and 2.3, outperforms the examined ones in related research works.
Conclusion and future work
To conclude this chapter, we would like to highlight the main contributions listed in the introduction. To provide a thorough discussion about the specification of metrics and indicators as versioned by-products or resources for M&E process descriptions is one of the main drivers of the chapter. We argue that metrics and indicators are reusable organizational assets for providing suitable and consistent data and information for analyzing, recommending, improving, monitoring, and, ultimately, decision-making processes. Toward this end, we discuss why metric and indicator specifications should be considered valuable metadata that have to be linked by means of their IDs (and versions) to measure values (i.e., data and datasets) and indicator values (i.e., information). Additionally, we illustrate specific metrics and elementary/global indicators for a real security/risk M&E case, highlighting the importance of recording not only data but also the associated metadata of information needs, context (not exemplified here for space reasons), attributes, metrics, and indicators to ensure repeatability and comparability of analysis among an organization’s projects. This illustration is made considering the six key items raised by using the W5H rule.
Lastly, metrics and indicators are designed assets useful for supporting M&E for any entity category and domain. They are not isolated by-products or resources, but rather the building blocks used, for example, by the integrated GOCAME strategy, which is based on three main pillars, namely: (i) a conceptual framework utilizing a robust terminological base, (ii) a well-defined M&E process, and (iii) evaluation methods and tools. The added value of specifically supporting the ICT security/risk area with a quality M&E strategy is highlighted, as well.
Regarding future work, an ontology for the security/risk assessment area is, to the best of our knowledge, missing yet, so we are considering its further development. This can benefit the instantiation of more robust strategies, processes, and methods.
References
1. Kitchenham B, Hughes R, Linkman S. Modeling software measurement data. IEEE Transactions on Software Engineering 2001;27(9):788–804.
2. Olsina L, Papa F, Molina H. How to measure and evaluate web applications in a consistent way. In: Springer, HCIS Series; Web engineering: Modeling and implementing web applications. Rossi G, Pastor O, Schwabe D, Olsina L, editors. 2008;385–420.
3. CMMI Product Team. CMMI for development. Version 1.3. CMU/SEI-2010-TR-033, USA; 2010.
4. Goethert W, Fisher M. Deriving enterprise-based measures using the balanced scorecard and goal-driven measurement techniques. Software engineering measurement and analysis initiative, CMU/SEI-2003-TN-024. [Internet]. 2003. http://repository.cmu.edu/cgi/viewcontent.cgi?article=1541&context=sei.
5. ISO/IEC 27004. Information technology – security techniques – information security management – measurement; 2009.
6. ISO/IEC 15939. International standard, information technology – software engineering: Software measurement process. Geneva, Switzerland; 2002.
7. NIST SP 800-55. Performance measurement guide for information security. [Internet]. July 2008 [cited Jan 2013]. Available from: <http://csrc.nist.gov/publications/PubsSPs.html>.
8. Olsina L, Martín M. Ontology for software metrics and indicators. In: Journal of Web Engineering. Rinton Press: New Jersey. 2004;2(4)262–81.
9. Olsina L, Lew P, Dieser A, Rivera B. Updating quality models for evaluating new generation web applications. In: Journal of Web Engineering, Special issue: Quality in new generation web applications. Rinton Press: New Jersey. 2012;11(3):209–246.
10. ISO/IEC 25010. Systems and software engineering – systems and software product quality requirements and evaluation (SQuaRE). System and software quality models; 2011.
11. NIST SP 800-30. Guide for conducting risk assessments. [Internet]. 2011 Sep [accessed Jan 2013]. Available at http://csrc.nist.gov/publications/PubsSPs.html.
12. Becker P, Molina H, Olsina L. Measurement and evaluation as quality driver.In: ISI Journal (Ingénierie des Systèmes d’Information), Special Issue: Quality of Information Systems. Lavoisier: Paris. 2010; 15(6):33–62.
13. Molina H, Rossi G, Olsina L. Context-based recommendation approach for measurement and evaluation projects. In: Journal of Software Engineering and Applications (JSEA). Irvine: CA. 2010;3(12):1089–1106.
14. Nelson C. Security metrics: an overview. In: ISSA Journal. 2010;12–18.
15. OWASP testing guide. Version 3.0. [Internet]. 2008 [cited 2013 Jan]. Available from: <https://www.owasp.org/index.php/OWASP_Testing_Project>.
16. OWASP testing guide. Version 3.0 [Internet]. Stored XXS. 2008 [cited 2013 Feb]. Available from: <https://www.owasp.org/index.php/Testing_for_Stored_Cross_site_scripting_(OWASP-DV-002)>.
17. Dujmovic JJ. A method for evaluation and selection of complex hardware and software systems. 22nd Int’l Conf for the Resource Management and Performance Evaluation of Enterprise CS. CMG 96 Proceedings. 1996;368–378.
18. Papa F. Toward the improvement of an M&E strategy from a comparative study. In: Current Trends in Web Engineering, ICWE Workshops. Grossniklauss M, Wimmer M, editors. LNCS 7703, Springer. 2012;189–203.
19. Alberts C, Dorofe A. OCTAVE: method implementation guide. Version 2.0. Carnegie Mellon SEI: Pittsburgh; 2001.
20. ISO/IEC Guide 73. Risk management – Vocabulary – Guidelines for use in standards; 2009.
21. ISO/IEC 31010. Risk management: risk assessment techniques; 2009.
22. Basili V, Lindvall M, Regardie M, et al. Linking software development and business strategy through measurement. IEEE Comput. 2010;43(4):57–65.
23. García F, Ruiz F, Bertoa M, et al. An ontology for software measurement Technical Report UCLM DIAB-04-02-2. Computer Science Department, University of Castilla-La Mancha, Spain 2004.
24. Garcia F, Bertoa M, Calero C, et al. Towards a consistent terminology for software measurement. Inf Softw Technol. 2005;48(4):631–644.
25. Basili R, Caldiera G, Rombach HD. The goal question metric approach. In: Encyclopedia of Software Engineering. 1994;1:528–532.