
Real-time Network Intrusion Detection Using Hadoop-Based Bayesian Classifier
Sanjai Veetil and Qigang Gao, Dalhousie University, Halifax, NS, Canada
Over the years, many networks hosted by large companies or organizations have been crippled by intrusions launched with minimal effort. Such attacks have caused the loss of millions of dollars for the company and created serious security threats. As a result, network administrators and security experts across the globe have barricaded their networks with expensive Intrusion Detection Systems (IDS) to detect and take action in dealing with various network attacks. There is still a very challenging task to develop a cost-effective approach that can deal with network intrusions. Furthermore, large networks generate huge traffic data that serve as inputs for IDSes. In this chapter, we present a Network Intrusion Detection System (NIDS) built using Apache Hadoop and HStreaming, which can detect and alert administrators in real time. The system makes use of a simple yet versatile Naive Bayes classifier for predicting an attack. The experimental results show some promising outcomes.
Keywords
real-time intrusion detection; Hadoop distributed file system; MapReduce; Naïve Bayes classifier; detection performance evaluation
Information in this chapter
• Overview on Hadoop based technologies
• Survey of Intrusion Detection Systems
• Hadoop-based real-time Intrusion Detection: System architecture
Introduction
There are many real-world examples of large-scale intrusions that had wreaked havoc, causing far-reaching damage. The attack on the Sony PlayStation Network (PSN) created ripples of fear among several technology giants [1]. The reason was simple—the Distributed Denial of Service (DDOS) attack left Sony struggling to revive its online gaming service, which in turn caused a huge loss (in millions of dollars) for Sony. Furthermore, credit card information of thousands of PSN users were stolen. Sony had to opt for an expensive security measure to prevent attacks in the future. Sony’s misfortune was an invaluable lesson for security experts across the globe. Another tech giant, Twitter, became the latest victim of an intrusion, wherein the Associated Press (AP) Twitter account was hacked. The AP tweets were then used for sharing links that directed users to malicious sites and for propagating false rumors [2]. This attack questioned the credibility of Twitter’s security measures. In [3], the author has listed several infamous hack attacks. The year 1999 witnessed the shocking case of a successful hack that penetrated the military network belonging to the US Department of Defense. The attack’s impact was so far-reaching that NASA had to shut down their network as an immediate measure to curtail the attack. In 2008, a hacker group allegedly took down the Church of Scientology’s official website using DDOS. Therefore, we can infer that the attacks have become technologically advanced and often difficult to detect. The demand is urgent and tremendous for a cost-effective system that can efficiently detect such attacks in real time.
In this article, we present a system to tackle the following research questions:
• How do we deal with the challenges of real-time intrusion detection on large volume stream data?
• Could we build a distributed, scalable, and fault-tolerant intrusion detection system?
• Are Hadoop and HStreaming viable platforms for building an intrusion detection system?
• Is a Hadoop-based Naive Bayes classifier faster than a standalone Naive Bayes?
• Could we build an efficient intrusion detection system using a heterogeneous/homogeneous cluster comprising obsolete hardware?
Overview on Hadoop based technologies
This section gives a brief description of all the prominent technologies that were used to implement the proposed solution.
Apache Hadoop
Apache Hadoop is an open-source distributed computing framework based on Java API [4]. Hadoop allows developers to process big data in parallel by using batch-processed jobs. The two core components of Hadoop are MapReduce and the Hadoop Distributed File System (HDFS) [5]. The MapReduce component is responsible for submission of jobs and making parallel processing of big data possible. The HDFS component is a unique file system used by Hadoop for storing and managing big data. Only those classes belonging to Hadoop’s API can read/write into the HDFS system, while the rest of the OS components are oblivious to its existence. The jobs that run in parallel on the Hadoop cluster read the input file and write out the output file into the HDFS.
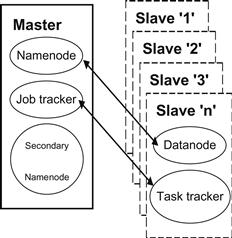
Figure 18.1 shows the typical architecture of a Hadoop multi-node cluster that consists of a single master and multiple slave machines. There are two master processes known as the Namenode and Jobtracker that run as daemon processes on the master machine. Each slave machine runs the Datanode daemon and the Tasktracker daemon. The Namenode daemon manages Hadoop’s Distributed File System (DFS) and supervises the datanode daemons on the slave machines. The Jobtracker daemon on the master accepts the submitted MapReduce job and assigns it to any of the tasktracker daemons on the slave machines. The slave daemons periodically send heartbeats that comprise the information pertaining to the data blocks they store and their available slots of executing the tasks. The job may be assigned to multiple tasktrackers, depending on the size of the input data. In certain cases, the master machine also runs the slave daemon processes so that it may also run the jobs [5]. In typical real-case scenarios, the high-end machine is configured as the master, hence making it run both the slave and master daemons improves its utilization. Optionally, a daemon process known as the Secondary Namenode is run on a separate machine that backs up all the necessary files used to recover a failed Namenode.
MapReduce
Hadoop’s MapReduce programming model focuses on processing big data in parallel. This is achieved by harnessing the processors of multiple machines on either a heterogeneous or a homogeneous cluster. A typical MapReduce job mainly consists three phases; namely, the map phase, shuffle phase, and the reduce phase [5]. The map phase is invoked for each record contained in the input file read from the HDFS. To make each record unique, Hadoop prefixes each record with an offset, which is usually a random number. The output from the map phases are key-value pairs wherein the key from several map phases may be identical. The mappers write their output to memory buffers. Overflowing data is spilled to the disk. Too much spilling implies heavy I/O operations that severely affect performance. Practically, the mappers perform a portion of the sorting operation. A shuffle-and-sort phase follows the map phase and sorts the output from the map phase based on the key. The reduce phase is invoked as soon as the shuffle-and-sort phase generates a stream of sorted key-value pairs. Each reduce phase is invoked for each unique key and its corresponding values. The result of the reduce phases are written onto HDFS. It is worth noting that the map and reduce phases are invoked in sequence. There may be multiple map phases and reduce phases that run in parallel, based on the size of the input file.
Hadoop Distributed File System (HDFS)
The HDFS is a special file system that is exclusive to MapReduce jobs [5]. The HDFS acts like a storage for big data, which can be loaded from the local file system by using a CLI utility that ships in with any Apache Hadoop distribution. The main feature of HDFS is that it facilitates the partitioning of the big data contained within HDFS to multiple machines. The basic unit of the big data resident on HDFS is a block, which is comparatively larger than that of the local file system. This approach ensures that the cost of seeking these blocks is minimal. The Namenode is the core component and is responsible for maintaining metadata about all files contained on the HDFS and for distributing a large file to multiple datanodes on the cluster.
Apache Hive
Apache Hive is a petabyte datawarehouse that can house big data [6]. It even has an SQL-like language called HivQL for performing database-related operations on the big data loaded into tables. Apache Hive relies on the HDFS for storing its data, which can comprise tables, views, and files that are loaded into external tables.
In [6], the author states the features of Apache Hive as follows:
HStreaming API
The HStreaming API is a Java library that is built on top of the native Hadoop library; hence, the native MapReduce programs can be easily ported to the HStreaming API [7]. As a result, these streaming MapReduce jobs run continuously unless they are manually terminated or aborted. Hadoop is a distributed computing framework and is best suited for situations where slow batch-processed jobs need to be speed-boosted with the help of Hadoop’s parallel processing ability. Although Apache Hadoop has all the bells and whistles, it still lacks the capability to process big data in real time. The HStreaming API helps Hadoop achieve this by providing the developers with a set of handy Java classes that allow MapReduce jobs to read from a live stream of data.
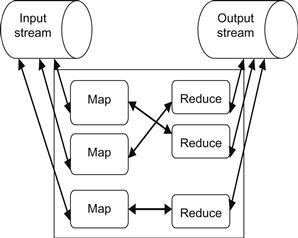
To make the streaming possible, HStreaming utilizes “stream endpoints,” one each for the input and the output. The user defines these stream endpoints as TCP/HTTP/UDP-based URLs. These URLs are spawned by using a CLI-based tool called streamgen [7], which ships with the HStreaming API. Figure 18.2 shows a streaming MapReduce job. Hence, with the power of real-time analytics offered by the HStreaming API, MapReduce jobs can now process big data in real time.
Survey of Intrusion Detection Systems
Intrusion detection is the process of monitoring the events occurring in a computer system or network and analyzing them for signs of intrusions, defined as attempts to compromise the confidentiality, integrity, and availability, or to bypass the security mechanisms, of a computer or network [8, p. 5].
With the increase in dependency on networks for carrying out day-to-day businesses, the reliability, security, and availability of such networks are of utmost importance for administrators. Networks have become an indispensable part of business, and a severe downtime of a network could only mean loss, sometimes to the tune of millions of dollars. Intrusion Detection Systems (IDS) address the security concerns of these networks and can operate in four configurations.
Based on [8], IDSes are differentiated based on the following features:
• The source of information used as input for intrusion detection (e.g. Web server log files, network traffic data, etc).
• The target, which is monitored by the IDS. The target can be an entire network (NIDS) or a single host (HIDS).
• The data mining technique (e.g. anomaly detection, signature-based intrusion detection) used to deduce whether an intrusion has occurred or not.
Host Intrusion Detection System
As mentioned above, HIDSes focus on monitoring and detecting intrusions at a single host. Network administrators have to carefully analyze the pros and cons of installing a commercial IDS on a target host, since it is costly in terms of licensing fee and maintenance. Typically, in large corporations, a single high-end machine, designated as a powerful Web server that caters to millions of requests/transactions per day, is an ideal candidate for installing an HIDS. It is highly likely that this Web server becomes the target for hackers. The HIDS is configured to monitor the target machine’s Network Interface Card (NIC), which connects it to the rest of the network. The traffic data (and optionally, the log files) generated by the target machine are monitored by the HIDS.
Network Intrusion Detection System
An HIDS will not suffice if we want to detect intrusions at multiple targets that jointly function as an indispensible asset for day-to-day business. This scenario is apt for a Network-based Intrusion Detection System, which acts like a second line of defense next to a firewall. A traditional NIDS will have a distributed architecture, which relies on processes running on the target machine to report on any suspicious activity related to the network traffic. These processes generally report to a central process that acts as the core management component for the IDS. An NIDS monitors the exchange of communication between internal hosts to detect threats within the network. This component can be used to configure the IDS for generating alerts for specific intrusions, for selecting the mode of alerting the administrator, and for performing in-depth analysis of alert log files. In [9], the author states that the NIDS cannot operate in switched, encrypted, or high-speed networks. A prime example of an NIDS is Snort [10], a packet sniffer that employs sensors on multiple target machines to monitor and detect intrusions.
Misuse-based Intrusion Detection System
This system is also known as the signature-based approach for detecting intrusions. The misuse-based detection approach employs a data mining algorithm that can be trained with data that is labeled with known attack types. The efficiency of this system relies on the comprehensiveness of the training data that must contain instances of all possible known attacks. Furthermore, a misuse-based detection system produces very few false positives when compared to an anomaly-based IDS. The Naive Bayes, Decision Tree, and Support Vector Machines (SVM) algorithms are examples of data mining algorithms, which are incorporated into a misuse-based IDS. All of these algorithms have their own advantages and disadvantages, so their selection is based on the purpose and requirements. A shortcoming of the misuse-based IDS is that it cannot detect newer/unknown forms of attacks.
Anomaly-based Intrusion Detection System
Anomaly-based IDSes also rely on data mining algorithms for creating models representing “normal” behavior. This model is used as a reference for detecting any “deviation” from it. Any kind of deviation or abnormal pattern is labeled as a attack. Hence, anomaly-based IDSes are capable of detecting even newer/unknown attacks. However, such systems are known to generate a high number of false positives wherein a legitimate traffic is labeled as an attack. This leads to many false alerts and often the alert logs grow exponentially, hence making it difficult to perform an alert log analysis. To make matters worse, the administrator has to carefully distinguish between legitimate and illegitimate traffic based on experience.
Common attack types
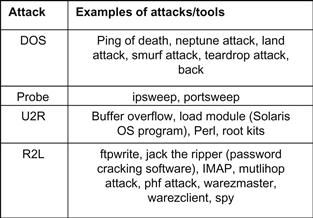
The Denial-of-Service (DOS) and Probe attacks are major forms of attack, while the User-to-Root (U2R) and Remote-to-Local (R2L) attacks are minor forms of attack. In case of a DOS attack, the hacker prevents the legitimate user from accessing a service (e.g., online multiplayer games). The hacker bombards the main server with packets until it goes down. Probe attacks are most common. Hackers use probe attacks to gain a better understanding of their targets. A plethora of tools is freely available on the Internet to probe remote hosts. A U2R attack is a situation in which the attacker has already gained access to the target machine and is attempting to gain root/super user privileges. These attacks often involve brute-force techniques to crack the root/super user’s password. A common practice to prevent such attacks is to use strong passwords for all accounts. An R2L attack is a case where the hacker is attempting to gain access into the target machine by using any of the accounts that are available on the target machine. Usually, logging into the guest account is attempted before trying rest of the accounts. The user accounts that are currently used on a remote machine can be determined using nmap. Figure 18.3 gives examples of each attack category.
A Javascript-based visualization API: D3
D3 is JavaScript library that visualizes data using a variety of visual metaphors, such as bar charts, pie charts, and scatter plots [11]. Visualization aids the user to assimilate the information quickly. In the case of NIDS, the network traffic data is often huge, so it is an ideal candidate for visualization. The visualizations are accessed via the front-end Web interface through which the network administrator can assess the situation of the network.
Ganglia: a cluster monitor
Monitoring a cluster is an important task for the network administrator. The administrator has to take the necessary actions in case of any failure within the cluster. It is tedious to monitor the nodes on a cluster using a CLI-based tool (e.g., Nmap); hence, we need a GUI-based tool that monitors the cluster’s health in real time. Ganglia is a Web-based GUI tool that monitors the cluster by using two daemon processes called gmetad and gmond [12]. The gmetad daemon is a central process that requests information from the gmond process. The gmetad process runs on a single machine, while the gmond process runs on all the nodes that constitute the cluster. The authors in [12] state that Ganglia can easily monitor a cluster composed of 100 nodes. However, Ganglia has to be improved to make it efficient in monitoring more than 100 nodes.
Naive Bayes algorithm
The Naive Bayes algorithm makes use of the Bayes rule for defining the Naive Bayes Class (NBC). The authors have discussed this in [13].
Bayes rule
The Bayes rule uses a hypothesis’s prior probability to compute its corresponding probability. A hypothesis is a mere fact that does not have any scientific verification. Let “D” be a given data and “h” denote the hypothesis; then the Bayes rule is given by equation (1).
![]() (1)
(1)
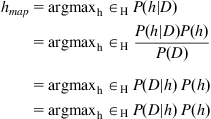
P(h|D) is the posterior probability, which represents the probability that the hypothesis “h” occurs given that the data “D” has occurred. P(D|h) is defined as the conditional probability that gives the probability of data “D,” provided the hypothesis “h” has occurred. P(D) is the probability that the data “D” occurs, while P(h) is the probability that the hypothesis “h” occurs. While constructing a model, we need to consider a set of hypotheses, say, “H,” which is the superset of a hypothesis “h” that has the highest probability for a given data “D.” This hypothesis “h” is known as the Maximum Posterior (MAP) hypothesis. By applying Bayes rules described in equation (1), we can compute the posterior probability of all hypotheses and then select the MAP from among them. By substituting for P(h|D) in the below equation and ignoring P(h), the final equation we arrive at is shown in equation (2).
 (2)
(2)
Naive Bayes classifier
The Naive Bayes classifier is a simple classifier that is based on the Bayes rule. The classifier relies on supervised learning for being trained for classification. As part of this classifier, certain assumptions are considered. These assumptions state that there is a strong independence between the features (in the dataset) and that each attribute’s probability is independent of the others’ [13]. Despite this rather unrealistic assumption, the Naive Bayes classifier has impressive accuracy. The classifier is used to determine the probability given in equation (3).
![]() (3)
(3)
The formula given in equation (3) refers to P(C=ci|A1=a1, … Ak=ak). To understand the above equation, consider a dataset with a set of “k” attributes ranging from “A1” to “Ak.” Each of these attributes has a set of values. The attribute for which there are no values available becomes the class C. The aim of the NBC is to determine the value of class C for any given instance of the dataset. The probability, which is computed for a given instance, is given by equation (4). The value of C, which maximizes this probability, is used to label the given instance.
![]() (4)
(4)
In a real-world scenario, a learner/model is generated by using an extensive training dataset that contains the label for the target class (learning phase). This model is then used to label unclassified data instances (prediction phase).
Other related work
In [14], the authors have illustrated the advantage of using a layered approach for detecting intrusions using an NB classifier. This approach involves selecting specific features for classifying a particular class/target value. The attacks (i.e., classes) were segregated into four groups. Then, for classifying the labels for each group, only the relevant features were selected for generating the model. With their experiments, they proved that the NB classifier was better than the Decision tree in terms of accuracy. However, they have not discussed the actual implementation of their proposed IDS. Their solution is implemented using WEKA 3.6—a machine-learning tool, which does not employ distributed computing. In [15], the authors have implemented a counter-based and an access pattern-based method to detect DDOS attacks. However, they have used native Hadoop API, which does not support real-time processing capability. Hence, the detection happens in offline mode. In [16], a real-time IDS has been proposed using an ensemble-based adaptive learning configuration along with a feature selection algorithm. Additionally, the system utilizes sensors, detectors, and a data warehouse as part of the architecture. The authors have not provided experimental results of their architecture and their system does not operate in a distributed manner. Moreover, the authors do not state the scalability and fault tolerance of their system.
Snort is an NIDS, which relies on a signature-based detection technique [10]. Although Snort has been lauded as a better alternative to commercial IDSes, it is known to fill up the disk with large alert/log files [17]. Snort requires a single powerful machine that has no fault tolerance. This means that if the machine on which Snort resides goes down, then the intrusions can go unnoticed. Snort depends on sensors to receive information about remote nodes. These sensors run on each of the nodes that need to be monitored. Ultimately, these sensors increase traffic and directly affect other high priority network applications/services. In [18], the authors have presented an NIDS called Bro, which contends with Snort. Like Snort, Bro does not feature fault tolerance.
Hadoop-based real-time Intrusion Detection: System architecture
The amount of data generated by network traffic is considerably huge. Although current hardware offers a great array of storage options for such large data, the processing paradigm used by most software cannot handle this huge data. Distributed computing is a promising domain. In fact, it is distributed computing that is the most apt and economical solution when compared to a single piece of hardware, with ultra-high configuration doing all the data crunching with multiple threads. Typically, distributed computing relies on the availability of a cluster, which consists of multiple machines that share responsibilities (rather than a single dedicated powerful server machine). A master-client relationship is generally adopted wherein a single machine acts as a master that supervises the rest of the “slave” machines. Several software frameworks are available that help developers to implement their solutions with the power of distributed computing—Apache Hadoop is one such solution.
Only the KDD ’99 intrusion detection dataset [19] was used to evaluate the system. The dataset contains the instances of attacks, which are given in Figure 18.3. We used Apache Hive to pre-process the training data. This task involves the use of HiveQL to replace missing values with a default value, to replace highly distributed values with nominal values, and to remove duplicate records. The setup of the cluster consists of eight machines, of which one acts as the Hadoop master as well as a slave, while the rest of the machines act as slaves. The cluster is heterogeneous, meaning that each machine has a different hardware configuration; some of them are even obsolete when compared to present-day desktop machines. The master alone has 6GB of RAM with four processor cores, while two machines have 3GB of RAM and two cores each. The rest of the machines have just 1GB of RAM with a single core. All of the machines have at least 50GB of hard disk space dedicated to the HDFS. Each machine ran the Ubuntu Lucid (10.04) operating system. One aim of our study was to determine whether we could rely on obsolete hardware for building a critical system such as an NIDS.
A typical example of big data generated in real time is the network traffic data captured using packet sniffers. A MapReduce job is used to implement a Naive Bayes learner that uses pre-recorded network traffic data as the training data and consequently generates the model in the form of a text file. This is known as the learning phase. Snort is used to capture network traffic in tcpdump format. This tcpdump (raw) data is then converted to CSV format by using a Command Line Interface- (CLI) based tool called tshark. This CSV file is then streamed to a TCP/UDP-based URL called the “In” stream, using HStreaming’s StreamGen. After that, another MapReduce job is triggered that loads the model into memory and uses it to classify connections that are read from the “In” stream. The MapReduce job classifies/labels each record as either an attack or a normal connection, then writes them to the “Out” stream (another TCP/UDP-based URL). This is known as the prediction phase. The solution also consists of a Web interface through which the administrator can initiate the learning phase to generate the Naive Bayes classifier, and trigger the prediction phase using live traffic data. Visualizations such as pie charts and bar charts are available to the administrator for quickly assessing the status of the network. Using HIDS on each of these multiple targets is not a cost-effective way of ensuring security, although there are advantages. The best possible solution is to employ an NIDS that is installed on a host, which acts like the single point of access for multiple targets. Typically, a machine that acts like a gateway/firewall can be used to host the NIDS. The firewall has access to the packets that flow through the network and not just to itself. Hence, the NIDS can detect attacks by monitoring all the packets that flow through the firewall and detect any kind of suspicious activity by using either the misuse-based or the anomaly-based approach for intrusion detection. The proposed architecture is given in Figure 18.4.
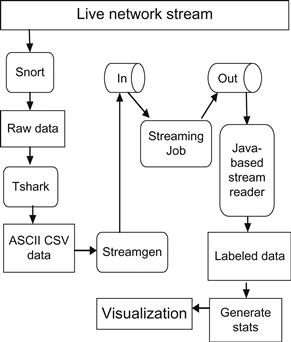
As the prediction phase is running continuously in real-time, a standalone Java-based program called streamreader reads the labeled records from the “Out” stream and writes them to a file on the file system. A bash shell script reads this file and generates statistical data that is used as input for the bar charts and pie charts (see Figure 18.5). Only the statistics are mailed to the administrator, which avoids spamming the mailbox with an alert of each detected attack. Ganglia is used to monitor the cluster’s performance.
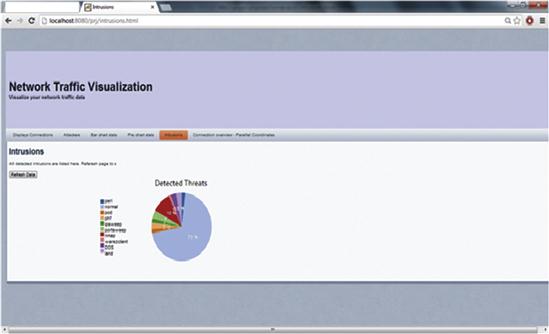
The pie chart gives the distribution of real-time threats that were detected by the system. The user needs to tap on the “Refresh Data” button to update the chart.
Practical application scenario and system evaluation
This section discusses the practical application scenario of our system and its experimental evaluation.
Experimental evaluation
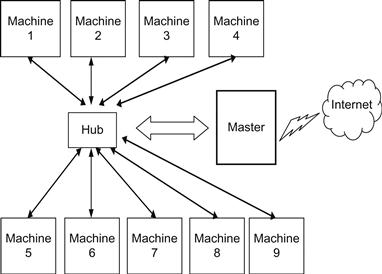
To demonstrate the capability of the system, we devised a real-world setup of a heterogeneous cluster composed of nine machines (including the gateway). The setup of our cluster is depicted in Figure 18.6. Our cluster setup is similar to that of small internal LANs that are maintained by many organizations such as companies, schools, and universities.
We performed experimental analysis in multiple phases. In the first phase of our experiment, we wanted to compare the performance of our heterogeneous cluster composed of obsolete hardware with a homogeneous cluster. Each node on the homogeneous cluster has an Intel Xeon X3350 processor with 2.66 GHz speed, four cores, 4GB RAM, three 1 TB Seagate ES.2 hard drives, and an Intel PRO/1000 e1000e Ethernet card. We ran our Hadoop-based NBC on both clusters with the 10% KDD training set described in [19] that consisted of all features. Additionally, we ran the training phase with a reduced number of features, as discussed in [19]. The result of the first phase is shown in Figure 18.7. Normally, Hadoop decides the number of mappers to spawn for a given MR job.
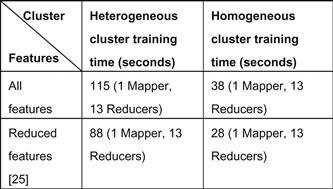
From Figure 18.7, we can infer that the heterogeneous cluster is slower than the homogeneous cluster by an average of 68.5 seconds (approximately one minute). The mappers and reducers on the heterogeneous cluster frequently complained of a Java heap space (out of memory) error. We anticipated this error, owing to the size of our training data and the very limited RAM available on the obsolete nodes. The OS on the nodes utilize at least 300MB of the RAM; hence, the space available for the Java Virtual Machine (JVM) is very limited for processing large data in-memory. The number of DFS blocks in the input file controls the number of mappers that are assigned for the job.
In newer versions of Hadoop, the parameter called dfs.blocksize is used to define the DFS block size. We have to optimally set this parameter so that the number of mappers assigned to the MapReduce job is more than sufficient. Spawning a large number of mappers creates a significant overhead and affects the overall performance. In the case of our experiments, we found that only one mapper was spawned for all the jobs. We used the homogeneous cluster as our test bed for rest of the experimental phases; we inferred that it is faster than the heterogeneous cluster. In the second phase, we conducted several trials of running our Hadoop-based Naive Bayes classifier on the homogenous cluster to determine whether we could achieve further speed boost. The result of the trials is given in Figure 18.8.
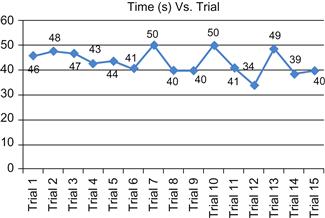
We tried to performance-tune Hadoop by varying the Hadoop-based parameters mentioned in [5]. Along with tuning Hadoop, we tuned our MapReduce job, as well. The performance tuning configurations we defined for the trial runs is shown in Figure 18.9.
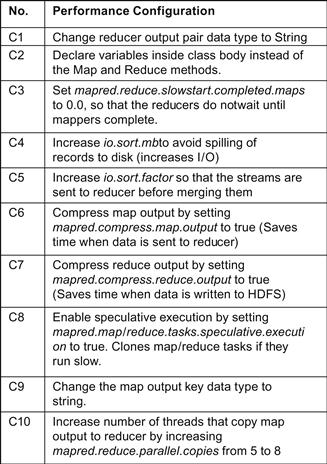
The various combinations of the configurations distinguish the trial runs. The details of each trial are shown in Figure 18.10. Each trial consisted of a single mapper.

We can rest assured that it was in trial run 12 that we achieved the fastest performance, as seen in Figure 18.10. The number of reducers for a job can be programmatically set using Hadoop’s built-in classes and methods. We controlled the number of reducers to determine if we could make the job run faster than the standalone Naive Bayes. From Figure 18.10, we can infer that the job that used 13 reducers was the fastest.
In the third phase, we compared the training speed of our Hadoop-based classifier with a standalone non-Hadoop-based Naive Bayes classifier and two other improved algorithms (presented in [13]); namely, an adaptive Bayesian algorithm and an improved self-adaptive Bayesian algorithm. The 10% KDD training set mentioned in [19] was used in this phase. The result is seen in Figure 18.12.
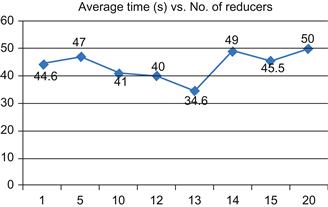
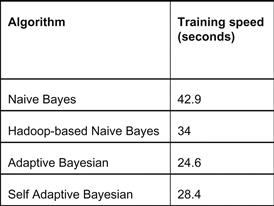
Figure 18.12 Training speed comparison of Hadoop-based Naive Bayes algorithm with non-Hadoop-based Naive Bayes algorithms.
Clearly, the Hadoop-based Naive Bayes algorithm is faster than the standalone Naive Bayes by 8.9 seconds (a 20 percent decrease in time). However, the Hadoop-based Naive Bayes is not as fast as the adaptive and self-adaptive Bayesian algorithms. Further speed boost can be achieved only if we adopt any of these faster algorithms. These algorithms are computationally more efficient than the Naive Bayes algorithm. We believe that the available memory on the nodes is a major downfall for large data processing. We anticipate an increase in speed by upgrading the RAM on the nodes
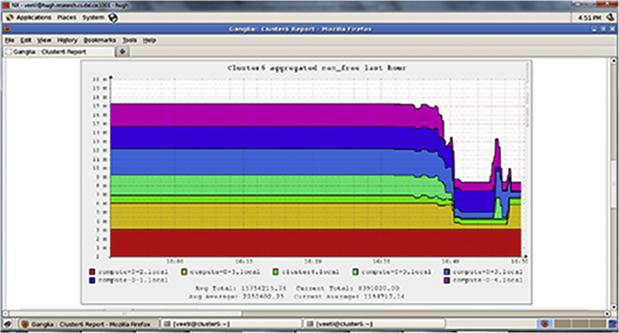
to at least 16GB. Delays caused by the Hadoop framework can also affect the overall performance of the job. As seen from the trial runs, we need to optimize the execution of the MapReduce job by checking for improvements by varying the number of reducers. The cluster performance was monitored using Ganglia while the MapReduce jobs (training) were running. Figure 18.13 shows the available free memory on the homogeneous cluster while the Hadoop-based Naive Bayes algorithm generated the learning model. During most of the trials, the nodes used swap space to carry out the processing.
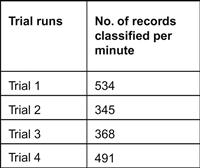
In the fourth phase, we conducted four trials in which the streaming job classified the unlabeled KDD ’99 testing dataset. The aim of this experiment is to determine the number of records classified per minute. From the trials shown in Figure 18.14, we were able to deduce that the streaming Naive Bayes classifier can classify an average of 434 records per minute (i.e., seven records per second, approximately). We ran Snort on a standalone machine to sniff for packets for 49 seconds. Snort was able to capture about 527 packets. This means that Snort captures 11 packets per second. We estimate that there would be a delay of a few seconds when tshark [20] converts the binary data generated by Snort into a CSV file (see Figure 18.4). Hence, we concluded that the performance of our streaming Naive Bayes classifier is acceptable in real-world scenarios.
In the final phase, we found that our Hadoop-based NBC has a detection rate of 90 percent. We had not used live traffic data for testing the classifier, since we did not simulate attacks in our cluster. Hence, to determine the efficiency of our classifier, we used the labeled and unlabeled KDD testing data.
Practical application
The experimental evaluation has proven that our system has realistic performance in terms of speed and efficiency. Our research does not focus on preparing the dataset for training the classifier; instead, it presents a novel design architecture for an intrusion detection system. Data preparation is a much broader research area. We did not want to reinvent the wheel so, for practical use, we propose to make use of the approach discussed in [21] to extract the relevant features from the real-time raw packet data generated by tcpdump. We would like to point out that this approach is feasible for our system since it uses Snort, which also generates the packet data in tcpdump format.
As Snort generates the tcpdump file, tshark [20] converts the binary packet data into a CSV file. An example for the single-line command that translates the binary packet data into a CSV file is as follows:
snort-l /log-b
# Start tshark to convert tcpdump data to ASCII
tshark-F text-E header=y separator=”,”-T fields-e tcp.ack-e tcp.port-e frame.coloring_rule.name-e ip.checksum_good-e frame.len-e ip.src-e ip.dst-e tcp.port-e udp.port
Note that the fields extracted from the packets are determined by the technique presented in [21].
Once we determine the features that are useful for intrusion detection, we can utilize more elaborate and realistic network traces, such as the ISCX dataset presented in [23]. The ISCX dataset consists of network traces representing connections that are normal or a type of attack. The network traces can be used for training the Hadoop-based algorithm and generating the knowledge model. This knowledge model can then be used to label each packet-related record as “normal” or as “attack.” Alternatively, we envision that NetFlow data can be used to train our model. A practical system that uses NetFlow data for detecting intrusions has been discussed in [23]. However, to train our Hadoop-based classifier, we require labeled NetFlow records.
Summary
Our Hadoop-based Naive Bayes Classifier is faster than the standalone Naive Bayes Classifier. There is scope for further increase in performance by upgrading hardware and performing software optimizations. We have learned that a homogeneous cluster performs better than a heterogeneous cluster. The choice of hardware is of utmost importance while setting up a cluster for running MapReduce jobs. In the case of our system, we succeeded in building a fault-tolerant, scalable, and reliable architecture for detecting intrusions in real time. As part of our future work, we intend to port our code to the Storm API [24], which shares similar features with Hadoop, such as fault tolerance, reliability, and distributed processing. Storm API provides real-time processing capabilities like that of HStreaming. Moreover, Storm is open source; hence, it is more economical than HStreaming, which requires a fee for the full edition. The choice of the Naive Bayes algorithm for our system is worthwhile, yet other performance-oriented algorithms can be used, as well. Our approach is not directed at improving classification accuracy or detection rate. Instead, we focused on designing an architecture that has the advantages of the Hadoop framework with real-time processing capabilities thanks to the HStreaming API. We believe that our Web-based visualizations would help security analysts stay abreast of intrusions and network traffic.
References
1. Hosaka T. Thousands of PlayStation network accounts targeted by massive attack. Sony Hack. [Internet]. 2011 Oct. Retrieved from: <http://www.informationweek.com/security/attacks/twitter-battles-syrian-hackers/240153424>; 2011.
2. Schwartz M. Twitter battles Syrian hackers. [Internet]. Retrieved from: <http://www.thedailybeast.com/articles/2010/12/11/hackers-10-most-famous-attacks-worms-and-ddos-takedowns.html>; 2013.
3. Ries B. Most famous attacks, worms, and DDos takedowns. [Internet]. Retrieved from: http://www.thedailybeast.com/articles/2010/12/11/hackers-10-most-famous-attacks-worms-and-ddos-takedowns.html; 2010.
4. Welcome to Apache™ Hadoop®! The Apache Software Foundation. [Internet]. Retrieved from: <http://hadoop.apache.org/>; 2013 [accessed 03.06.13].
5. White T. Hadoop: The definitive guide. Web 1st ed. O’Reilly Media, Inc. 2009.
6. Mujummdar P. Home-Apache Hive-Apache Software Foundation. [Internet]. Retrieved from: <https://cwiki.apache.org/confluence/display/Hive/Home>; 2013.
7. Release 1.1.b2. (2011, December 20). HStreaming Developer Guide, pp. 6–9.
8. Bace R, Mell P. NIST special publication on intrusion detection systems. Booz Allen Hamilton Inc McLean VA 2001.
9. Innella P. The evolution of intrusion detection systems | Symantec connect community. Symantec. [Internet]. Retrieved from: <http://www.symantec.com/connect/articles/evolution-intrusion-detection-systems>; 2001.
10. Roesch M. Snort-lightweight intrusion detection for networks. In: Proceedings of the 13th USENIX Conference on System Administration; 1999. p. 229–238.
11. Bostock M. D3. js: Data-driven documents. 2011.
12. Massie ML, Chun BN, Culler DE. The ganglia distributed monitoring system: Design, implementation, and experience. Parallel Computing. 2004;30(7):817–840.
13. Farid D, Rahman M. Anomaly network intrusion detection based on improved self adaptive Bayesian algorithm. Journal Of Computers. 2010;5(1):23–31. doi 10.4304/jcp.5.1.23–31.
14. Sharma N, Mukherjee S. Layered approach for intrusion detection using naïve Bayes classifier. Proceedings of the International Conference on Advances in Computing, Communications and Informatics 2012;639–644 ACM.
15. Lee Y, Lee Y Detecting DDoS attacks with Hadoop. In: Proceedings of The ACM CoNEXT Student Workshop ACM; 2011. p. 7.
16. Lee W, Stolfo SJ, Chan PK, Eskin E, Fan W, Miller M, et al. Real time data mining-based intrusion detection. In: DARPA Information Survivability Conference & Exposition II, 2001. DISCEX’01. Proceedings IEEE. 2001;1:89–100.
17. May C, Baker M, Gabbard D, Good T, Grimes G, Holmgren M, et al. Advanced information assurance handbook (No. CMU/SEI-2004-HB-001). Carnegie-Mellon Univ Pittsburgh Pa Software Engineering Inst; 2004.
18. Paxson V. Bro: a system for detecting network intruders in real-time. Computer Networks. 1999;31(23):2435–2463.
19. Olusola AA, Oladele AS, Abosede DO. Analysis of KDD’99 intrusion detection dataset for selection of relevance features. In: Proceedings of the World Congress on Engineering and Computer Science. 2010;1:20–22.
20. tshark-The Wireshark network analyzer 1.10.0. [Internet]. Retrieved from: <http://www.wireshark.org/docs/man-pages/tshark.html>; [accessed 10.07.13].
21. Esposito M, Mazzariello C, Oliviero F, Romano SP, Sansone C. Evaluating pattern recognition techniques in intrusion detection systems. In: PRIS; 2005. p. 144–153.
22. Shiravi A, Shiravi H, Tavallaee M, Ghorbani AA. Toward developing a systematic approach to generate benchmark datasets for intrusion detection. Computers & Security. 2012;31(3):357–374.
23. Ahamad T, Aljumah A, Ahmad Y. Detecting cyber attacks at data dribble. Network and Complex Systems. 2012;2(5):1–7.
24. Leibiusky J, Eisbruch G, Simonassi D. Getting started with storm O’Reilly Media, Inc. 2012.