
Advanced Security Network Metrics
Ivan Homoliak, Maros Barabas, Petr Chmelar, Michal Drozd and Petr Hanacek, Brno University of Technology, Brno, Czech Republic
In this chapter we propose a method for the extraction of data from network flow and a contextual separation of partial connections, using a set of network metrics that create a signature defining the connection behavior. We begin with defining the input dataset of captured communication and the process of extracting metrics from separated connections. Then we define the set of metrics included in the final behavioral signature. The second part of the chapter describes experiments performed with a state-of-the-art set of network metrics, with comparison to our proposed experimental set. The chapter concludes with the results of our experiments.
Keywords
behavioral signature; detection; IDS; network metrics; security
Information in this chapter
Introduction
There is considerable interest in developing novel detection methods based on new metrics that describe network flow to identify connection characteristics, for example, to permit early identification of emerging security incidents, rapid detection of infections within internal networks, and instantaneous prevention of forming attacks. Buffer overflows continue to be one of the most common vulnerabilities prevalent today, especially in undetected and most dangerous "zero-day" attacks. This has motivated researchers to create more or less sophisticated defenses addressing this threat. The first line of defense is based on memory randomization (ASR), which makes the attack harder to accomplish, but unfortunately it is still possible to offset the current process address. The second line of defense is based on automated signature generation techniques that generate filters to block network traffic similar to an attack payload signature. Unfortunately, polymorphic attacks can evade these signatures, and hence subsequent research has focused on behavioral signatures that favor the development of several data mining methods defining sets of network metrics that describe the attack vector by its behavioral features. These methods use either the existing NetFlow standard or network traffic packets. Several earlier research studies left NetFlow to create its own set of network metrics, which provided more information and context in analyzed connections.
Recognizing the importance of the quality of network metrics for successful detection, our approach proposes a new set of metrics with a high detection and low false positive ratio. It is expected that detection algorithms based on these new network behavioral metrics will outperform existing methods and will be applicable to a wider range of intrusion detection and prevention systems.
Our primary goal is to create a network-based system for online defense against zero-day buffer overflow attacks in the production environment. We described the reduction of attack types to buffer overflow in a previous article [1]. The secondary goal of this research is (a) to design the architecture of a detection framework that will enhance the overall network security level with the ability to learn new attack behaviors without human intervention by using expert knowledge from honeypot (or similar) systems; and (b) to find the most suitable set of metrics for describing attack behaviors in network traffic and significantly increasing the detection rate and lowering the false positive rate.
In our previous article [1] we proposed a framework architecture that could be used for the detection of various network threats. The paper presented a novel Automated Intrusion Prevention System (AIPS) that uses honeypot systems for the detection of new attacks and automatic generation of behavioral signatures based on network flow metrics. We have successfully experimented with the architecture of the AIPS system and have defined 112 metrics (recently updated to 167), divided into five categories according to type. These metrics are used to describe properties of a detected attack, based not on the fingerprint of a common signature but on its behavior.
In this chapter we define the method used for generating network behavioral signatures from a set of network security metrics, Advanced Security Network Metrics (ASNM), consisting of 167 metrics enhancing the ability of detecting potential attacks from network traffic.
Related work
Since 1999, the KDD'99 [2] dataset, based on the DARPA'98 IDS evaluation program, has been used for evaluating new intrusion detection methods based on analyzing network traffic. The training dataset consists of approximately 4.9 million single connection vectors, each labeled either normal or attack, containing 41 features per connection record. This dataset is criticized [3] mainly because it does not seem to be similar to traffic in real networks, and also for its attack taxonomies and performance issues. As a result, many researchers have proposed new measures to overcome these deficiencies.
The DARPA IDS evaluation dataset [4] was created for training and testing intrusion detectors. However, in the dataset, all the traffic was generated by software that is not publicly available, so it is not possible to determine the accuracy of the background traffic used in the evaluation. Also, evaluation criteria do not account for the system resources used, ease of use, or what type of system it is.
The 2005 Moore sets of data [5] are intended to aid in the assessment of classification work. A number of data sets are described; each data set consists of a number of objects, and each object is described by a set of features (also referred to as discriminators). Leveraged by a quantity of hand-classified data, each object within each data set represents a single flow of TCP packets between client and server. Features of each object consist of (application-centrist) classification derived elsewhere plus a number of features derived as input to probabilistic classification techniques.
In the classification, applications with similar dynamics are put into the same class. A naive Bayesian classificator is used in the algorithm in which the Bayes formula is used to calculate the posterior probability of a testing sample and selects the largest probability class as the classification result. Approximately 200 features of a network flow are used to train the model, and a kernel-based function is used to estimate the distribution function [6]. The total accuracy is about 95 percent in the dimension of a flow number being correctly classified and 84 percent in the dimension of the flow size.
In our research, classifying IP traffic is crucial, and it is important to include general classification techniques for classifying network attacks. A survey paper [7] reviewed the state of the art work in machine learning IP traffic classification between 2004 and 2007. This paper proposed four categories of machine learning classification techniques: clustering approach, supervised learning, hybrid, and comparisons with related work approaches. Each category was reviewed according to a number of requirements divided between offline and real-time classification.
Auld et al., based on a Bayesian method introduced in [6], proposed the Bayesian Neutral Network method [8]. Compared with the Bayesian method, it increased the classification correct rate to 99 percent on data from a single site for two days, eight months apart.
In [9], a novel probabilistic approach was proposed that uses the Markov chain for probabilistic modeling of abnormal events in network systems. The performance of this approach was evaluated through a set of experiments using the above-mentioned DARPA 2000 data set. The proposed approach achieves high detection performance while representing a level of attacks in stages.
None of these approaches can be used in a real-time evaluation of network traffic due to performance issues or a high false positive ratio. Only a little research has been done on creating new network metrics for the behavioral description of network attacks as a way of raising the classification accuracy, which makes this area still attractive for researchers.
Method description
In this section we provide the abstract description of a method used for extracting network connections and generating attack signatures.
Principle of the method
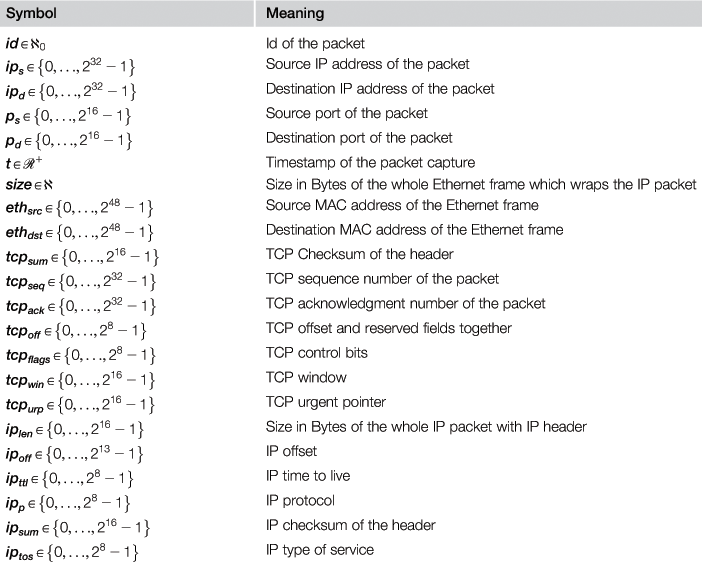
The method of our approach is based on the extraction of various types of properties from each analyzed TCP connection. We suppose having all packets set P. The identification of each packet is represented by its index i. A packet pi can be expressed as a tuple:
pi=(id; ips; ipd; ps; pd; t; size; ethsrc; ethdst; ps; pd; tcpsum; tcpseq; tcpack; tcpoff; tcpflags; tcpwin; tcpurp; iplen; ipoff ; ipttl; ipp; ipsum; iptos).
Symbols used in the packet tuple are described in Table 12.1.
TCP connection c is represented by tuple c=(ips; ipd; ps; pd; ts; te; idsyn; idsynack; idack; idfinack; Ps; Pd). The symbols used in the tuple is briefly described in Table 12.2.
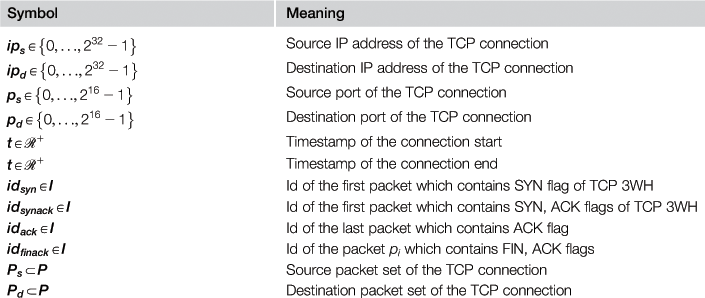
The source part of the TCP connection is the one with the initiation of the connection, and the destination part is the opposite part of the connection.
The set of all packets can also be interpreted as a set of all TCP connections C. The minimum packets count, which is necessary to identify the TCP connection, is three packets, which are used to establish a TCP connection according to TCP specifications. These three or more packets must contain the same IP addresses (ips, ipd), ports (ps, pd) and fields tcpseq, tcpack corresponding to a three-way handshake specification stated in RFC 793.1
Then we define a sliding window of length τ and a set of TCP connections Wj that are delimited by the sliding window:
![]()
![]()
![]()
The next fact about each TCP connection cj is an unambiguous association of cj to the particular sliding window Wj. We can interpret the start time ts of the TCP connection ck as a center of the sliding window Wj. We can also denote that a shift of the sliding window Δ(Wj) is always defined by start time differences of two consecutive TCP connections in C:
![]()
![]()
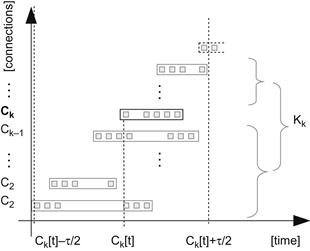
Next we define the context of the TCP connection, which is a set of all connections in a particular sliding window Wk without an analyzed TCP connection ck:
![]()
The defined terms are shown in figure Figure 12.1. In this figure the x axis displays time, while along the y axis, TCP connections are shown in their order of occurrence. Packets are represented by small squares, and TCP connections are represented by rectangular boundaries around particular packets. A bold line and font highlights the analyzed TCP connection ck, which has an associated sliding window Wk and context Kk. TCP connections that are part of the sliding window Wk are drawn using a full-line boundary, and TCP connections that are not part of this sliding window are drawn using a dashed-line boundary.
Metrics extraction
Having identified all TCP connections set C in a set of all packets P, next we extract metrics for each TCP connection from a set C in the order of their beginnings. It should be noted that real data stream conditions are simplified by set notation for the sake of this discussion.
The metrics extraction process is defined as an advanced process of signature computation from all packets of analyzed TCP connection and its context. We define metric m as a tuple consisting of natural or real numbers or an enumerated set of finite symbolic literals:
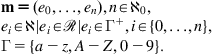
The input of the metrics extraction process is sliding window set Wk, TCP connection ck with meta-information of its associated packets. The output of the process is the set of all extracted metrics ![]() , where D is the number of all defined metrics and
, where D is the number of all defined metrics and ![]() contains a tuple of values specific for analyzed input TCP connection ck and its sliding window set Wk.
contains a tuple of values specific for analyzed input TCP connection ck and its sliding window set Wk.
Functions for metrics extraction
Metrics for the particular connection ck are extracted by several functions with very similar input, which in all cases includes an analyzed TCP connection ck. The other part of the input may be, in some cases, context Kk of the TCP connection ck.
There are exactly 30 functions used for metrics extraction, and 7 of them use the context of the TCP connection. Some functions return more than one metric when these can be directly extracted. Other functions are parameterized by various parameters as a direction of the TCP connection, order and type of polynomial, thresholds of the data size or packet count, etc.
One metric extraction function f declaration has the following form:
![]()
where mk is the set of values of one defined metric m for input TCP connection ck. Kk is the context of input TCP connection. The function fextr can be parameterized by additional arguments in many cases (as we mention above).
Metrics definition
All metrics were defined by properties, process, and behavior of network attacks or legitimate TCP connections. By using these metrics we have a higher probability of identifying an attack. For the best relevant signature of the TCP connections we use 167 metrics as signature. These 167 metrics are, in many cases, the result of reasonable parameterization of base metrics functions. Since writint our previous article [1] we have slightly changed the categorization of the set of all metrics and have also defined several new metrics with emphasis on the behavior of a TCP connection. Our metrics sets are depicted in Table 12.3 with a number of them in each category. We decided to name the categories of metrics according to their principles, not according to static data representation. Vector and polynomial metrics from our previous article [1] were arranged into behavioral and distributed metrics categories. The list of all metrics with regard to the categorization is introduced in a master’s thesis [10].
Table 12.3
| Metric | Count |
| Statistical | 50 |
| Dynamic | 32 |
| Localization | 8 |
| Distributed | 34 |
| Behavioral | 43 |
Statistical metrics
In the statistical category of our proposed metrics, statistic properties of TCP connections are identified. All packets of the TCP connection were considered in order to determine count, mode, median, mean, standard deviation, and ratios of some header fields of packets or the packets themselves. This category of metrics partially uses a time representation of packet occurrences contrary to the dynamic category definition. Therefore, it includes particularly dynamic properties of the analyzed TCP connection, but without any of its context. Most of the metrics in this category also distinguish inbound and outbound packets of analyzed TCP connection. In total, 50 statistical metrics are defined (50 features).
Dynamic metrics
Dynamic metrics were defined in order to examine dynamic properties of the analyzed TCP connection and transfer channel such as speed or error rate. These properties can be real or simulated. Fourteen of the metrics consider the context of an analyzed TCP connection. The difference between some of the statistic and dynamic metrics from a dynamic view can be demonstrated in two instances of the same TCP connection, which performs the same packet transfers, but in different context conditions and with different packet retransmissions and attempts to start or finish the TCP connection. Thirty-two dynamic metrics were defined in total (32 features). Many of them distinguish between inbound and outbound directions of the packets and consider statistic properties of the packets and their sizes as mentioned in the section on statistical metrics.
Localization metrics
The principal character of the localization metrics category is that it contains static properties of the TCP connection. These properties represent the localization of participating machines and their ports used for communication. In some metrics, localization is expressed indirectly by a flag that distinguishes whether participating machines lie in a local network or not. Metrics included in this category do not consider the context of the analyzed TCP connection, but they distinguish the analyzed TCP connection’s direction. We defined eight localization metrics (eight features).
Distributed metrics
One characteristic property of distributed metrics category is the fact that they distribute packets or their lengths to a fixed number of intervals per unit time specified by a logarithmic scale (1 s, 4 s, 8 s, 32 s, and 64 s). A logarithmic scale of fixed time intervals was proposed for better performance of used classification methods. Another principal property of this category is vector representation. All of these metrics are supposed to work in the context of an analyzed TCP connection. Altogether, we defined 34 metrics (480 features) in this category. These are the result of parameterization of two functions, which accept as their parameters unit time, threshold, direction, and the context of an analyzed TCP connection.
Behavioral metrics
Behavioral metrics are based on a description of the properties directly associated with TCP connection behavior. Examples include legal or illegal connection closing, the number of flows at defined time intervals, and polynomial approximation of the length of packets in a time domain or in an index of occurrence domain. Since writing our previous article [1] we have proposed new behavioral metrics:
• Count of mutual TCP flows of participating nodes before an analyzed TCP connection bounded by a specified time interval. The context of an analyzed TCP connection is considered.
• Count of new TCP flows after starting an analyzed TCP connection. This also works in the context of an analyzed TCP connection.
• Coefficients of Fourier series in a trigonometric representation with distinguished direction of an analyzed TCP connection.
• Standard deviation of time intervals between TCP connections on the same ports and the same IP addresses.
• Standard deviation of time intervals between TCP connections on the same IP addresses.
• Normalized products of the analyzed communication with $1,ldots,n$ Gaussian curves with regard to direction.
We defined 43 behavioral metrics (308 features). Most of them use the direction of the analyzed TCP connection, and six of them consider the context.
Description of experiments
The performance of our behavioral metrics was evaluated in comparison with discriminators suggested by [5]. The authors of that paper considered only TCP connections to perform extraction of discriminators the same way we did, so there are equivalent conditions for performance comparison between our suggested metrics and the discriminators suggested in the above-mentioned work. There were $248$ discriminators defined, including all items of vector types. Unlike their approach, we considered the entire particular vector metric as one. In their work, each TCP flow is described by three modes according to packet transmissions: idle, interactive, and bulk. Many discriminators use these three modes as their input. The authors did not mention any explicit categorization of defined discriminators. The only possible categorization follows implicitly from a direction of the TCP flow. We performed a similar analysis of discriminators and metrics definition. We discovered that approximately 20 percent of discriminators’ definitions were principally similar to or the same as in the metrics case. Unique properties of discriminators’ definitions include, for example, the use of quartiles for a statistical analysis, analysis of selective acknowledgment of TCP, a number of window probe indications, pushed or duplicate packets, and so on.
A dataset CDX 2009 was used for these experiments, which was generated by Sangster et al. in [11]. This dataset is available from URL [12]. It contains data captured by NSA, data captured outside the West Point network border (in TCP dump format), and snort intrusion prevention log as relevant sources for our experiments.
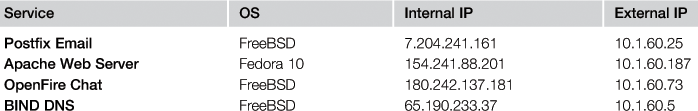
The CDX 2009 dataset was created during the network warfare competition, in which one of the goals was to generate a labeled dataset. By “labeled dataset,” the authors meant TCP dump traces of all simulated communications and snort log with information about occurrences of intrusions. The network infrastructure contained four servers with four vulnerable services (one per server). These services, with IP addresses of their hosted servers, are described in Table 12.4. Two types of IP addresses are shown in this table:
• internal IP addresses – corresponding to snort log, and
• external IP addresses – corresponding to a TCP dump network captured outside the West Point network border.
This fact has to be considered in the process of matching snort log entries with a TCP dump capture.
We noticed that specific versions of services described in [11] were not announced. Since this fact was not crucial for our research, it was of no concern to us.
We discovered that the snort log can be associated only with data capture outside the West Point network border and only with significant timestamp differences—approximately $930$ days. We did not find any association between the snort log and data capture performed by the National Security Agency. We focused only on buffer overflow attacks found in a log from snort IDS, and a match with the packets contained in the West Point network border capture was performed. Buffer overflow attacks were performed only on two services: Postfix Email and Apache Web Server. An example of the buffer overflow snort log entry follows:
[**] [124:4:1] (smtp) Attempted specific command
buffer overflow: HELO, 2320 chars [**]
[Priority: 3]
11/09-14:22:25.794792
10.2.195.251:2792 –> 7.204.241.161:25
TCP TTL:240 TOS:0×10 ID:0 IpLen:20 DgmLen:2360
***AP*** Seq: 0×68750738 Ack: 0×24941B59
Win: 0xFDC0 TcpLen: 20.
We used IP addresses (5th row), ports (5th row), time of occurrence (4th row), and TCP sequence and acknowledgment numbers (7th row) as information to match the snort log entries with particular TCP connections identified in TCP dump traces.
Despite all efforts, exactly 44 buffer overflow attacks were matched out of all 65, and these identified attacks were used as expert knowledge for the data mining process. To correctly match snort entries, it was necessary to remap IP addresses of the internal to external network, because a snort detection was realized in the internal network and TCP dump data capture contains entries from outside the IP address space.
The content of buffer overflow attacks, which were matched with data capture, were in only two TCP dump files: 2009-04-21-07-47-35.dmp, 2009-04-21-07-47-35.dmp2. Due to the enormous count of all packets (approximately four million) in all dump files, only two files were considered. These contained 1,538,182 packets. We also noticed that network data density increased at the time the attacks were performed. Consequently, we made another reduction of packets, which filtered enough of the temporal neighborhood of the attack occurrences. As a result, 204,953 packets were used for the next phases of our experiments.
The whole process of metrics and discriminators extraction with data mining comparison is illustrated in Figure 12.2.
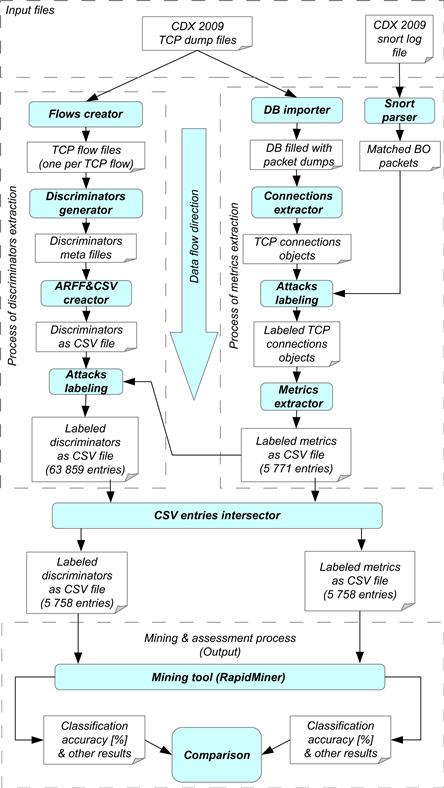
Four segments and data flow direction from top to bottom are depicted in the figure. White boxes represent data as input or output of some processes and filled ovals represent working components that perform some action. A working component takes input data and outputs output data. The upper segment represents the input of the whole experiment process and includes input data files CDX 2009 TCP dump files and CDX 2009 snort log file. The CDX 2009 TCP dump files are the mutual input of both extraction processes. The input of expert knowledge (CDX 2009 snort log file) is directly provided to the metrics extraction process and is indirectly bounded to extracted discriminators after the end of metrics extraction process. The right segment contains the metrics extraction process with expert knowledge processing, and the left segment contains phases of discriminators extraction.
Metrics extraction process
In Figure 12.2, an all packets set P is represented by the input of CDX 2009 TCP dump files, which are imported into the database by a DB importer component. Next, an active component Connection extractor performs the identification of all TCP connections set C in all packet set P. The extraction of TCP connections is followed by expert knowledge information processing, which means matching extracted TCP connections with parsed snort log information. If a match occurrs, the TCP connection is labeled as an attack by the Attacks labeling component. Then metrics extraction is performed for each TCP connection in C by the Metrics extractor component; the result of this step are metrics values for each TCP connection object in CSV file. It should be noted that the metrics extraction process is independent of expert knowledge information.
Discriminators extraction process
The input of the discriminators extraction process is the same for the metrics extraction process. The component Flows creator performs the identification of TCP connections with the netdude tool2 and creates a TCP dump file for each identified TCP connection. These TCP dump files are used as input for Discriminator generator component, which performs extraction of discriminators for each identified TCP connection. This component performs an operation equivalent to that performed by the Metrics extractor component during metrics extraction. It generates discriminators meta files, which contain intermediate results of discriminators values. These meta files are processed and joined by the ARFF&CSV creator component into a CSV file. After this step, the attack TCP connections are labeled by the Attack labeling component.
Mining and assessment process
The mining and assessment process is depicted in the lower part of Figure 12.2. Before this process takes place, it is necessary to make an intersection between output CSV files of metrics and discriminators extraction processes; this is performed by the CSV entries intersector component. At the output of this step there are metrics and discriminators of the same TCP connections objects, so there are equivalent conditions for the data mining process. Two intersected CSV files with equal numbers of entries are used as the input of the Mining tool component, and output consists of classification accuracy and other results suitable for comparison.
It should be noted that we found 5,771 TCP connections by our TCP connections extractor and 63,859 TCP connections by the TCP demultiplexer from netdude framework used in discriminators extraction. This is because we consider only established TCP connections, since only an established TCP connection can perform a buffer overflow attack. The intersection of metrics and discriminators outputs contained 5,758 objects and 44 of them represented attacks. This intersection was used in the data mining process and, therefore, these outputs were adjusted according to the same conditions applied to both metrics and discriminators outputs with the same TCP connections entries. Thirteen established TCP connections were not found by the TCP demultiplexer. The discriminators extraction was performed using a source code available from the author’s website.3 The whole process of discriminators extraction itself was not described in [5], so we deduced it from a source code and README instructions. It was also necessary to debug some of the functionality of provided tools. During the preparation for discriminators extraction, there were some compatibility issues caused by old versions of dependencies. We finally used Linux Fedora 4 as the most suitable operating system for the operation.
Results of experiments
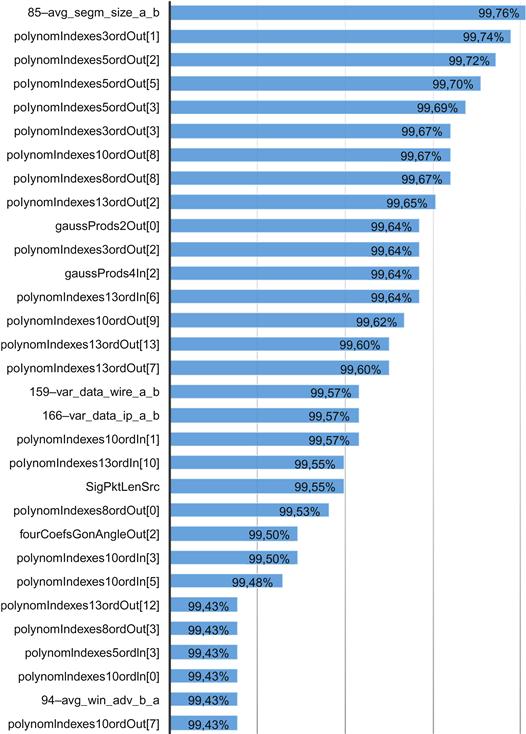
We analyzed the joined outputs of metrics and discriminators extraction processes by the RapidMiner tool.4 Our training model used the Naive Bayes classificator kernel. A stratified sampling with five-cross fold validation for every experiment was performed. A feature selection component was used that tries to select the most relevant attributes for final model generation. We focused only on the accuracy evaluation of particular metrics and discriminators. Our experiments were adjusted for maximal classification accuracy of input data. The best results were merged from both input CSV files. In Figure 12.3 the best metrics and discriminators (over 99.43% overall accuracy) are shown, sorted by the overall accuracy.
The names of discriminators consist of a number and label defined in [5]. The names of metrics are defined in [10].
The names of polynomial approximation metrics consist of five parts: polynomial metric label, method of approximation (indexes or time), order of polynomial, direction, and coefficient index. Fourier coefficient metrics’ names consist of the Fourier coefficient metric label, the goniometric representation, the angle or the module, the direction, and the coefficient index. Gaussian products metrics’ names are a compound of the Gaussian metric label, the number of Gaussian curves, the direction and the product index (e.g., PolynomIndexes5OrdOut [1]).
We can see that the best classification accuracy for the metrics sets was achieved by several polynomial approximation metrics. In most of these cases we achieved better results by the output direction, but we were also able to achieve interesting results with the input direction. A good performance was also achieved by Gaussian curves approximation and Fourier coefficients. The relevance in the case of standard deviation of packet length in the output direction (sigPktLenSrc) is also presented.
In the set of discriminators, the best results were achieved by an average segment size discriminator in the direction from client to server (avg_segm_size_a_b). It could be caused by the fact that the exploit’s payload contains a huge amount of data necessary to perform application buffer overflow and that these data are segmented. Another distinguished discriminator is the variance of bytes count in Ethernet or IP datagram in the destination direction (var_data_wire_ab and var_data_ip_a_b). This discriminator is equivalent to the average standard deviation metric of packet length in the output direction and brings nearly equivalent results. Also, the average window advertisement in the input direction (avg_win_adv_b_a) holds relevant information potentially useful in the process of classification.
We have successfully increased the detection rate by 0.9 percent from the previous state-of-the-art classification method (99.0%) by extending the set of network metrics used for classification.
Conclusion
In this chapter, we focus on defining the process of extraction metrics from separated connections of captured network traffic and consequently focus attention on the experiments that proved the concept of a designed metrics set. In the experiments described we achieved 99.9 percent accuracy of detecting buffer overflow attacks by combining an existing proposed metrics set with our solution.
Accuracy is highly dependent on training samples parsed from captured network traffic. The training and testing samples may be biased towards a certain class of traffic. For example, valid communication (according to the separation into valid and attack connections) represents a large majority of the samples in the testing dataset [6] (approximately 99.24%). The reason for the high classification capability of fewer metrics is that classification of buffer overflow attacks was highly predictable due to the size of data in fragmented packets, which caused the overflow, and the nature of valid communication with a small number of fragmented packets.
Our future work focuses on extending the metrics set to achieve better results in the detection of buffer overflow attacks. We plan to perform more experiments with actual metric sets. The efficiency of the current detection method was tested only on a small number of attacks. In the near future, we plan to create a public detection set that will challenge the development of detection algorithms in order to detect unknown attacks.
References
1. Barabas M, Drozd M, Hanacek P. Behavioral signature generation using shadow honeypot. In: World Academy of Science, Engineering and Technology; 2012.
2. Stolfo S, Wei F, Lee W, Prodromidis A, Chan P. KDD cup knowledge discovery and data mining competition; 1999.
3. Stolfo SJ, Fan W, Lee W, Prodromidis A, Chan PK. Cost-based modeling for fraud and intrusion detection: Results from the JAM project. In DISCEX'00: DARPA Information Survivability Conference and Exposition; 2000; Proceedings. 2000.
4. Thomas C, Sharma V, Balakrishnan N. Usefulness of DARPA dataset for intrusion detection system evaluation. In: SPIE Defense and Security Symposium; 2008.
5. Moore AW, Zuev D, Crogan M. Discriminators for use in flow-based classification; 2005.
6. Moore AW, Zuev D. Internet traffic classification using Bayesian analysis techniques. In: ACM SIGMETRICS Performance Evaluation Review; 2005.
7. Nguyen TT, Armitage G. A survey of techniques for Internet traffic classification using machine learning. Communications Surveys & Tutorials, IEEE. 2008;10(4):56–76.
8. Auld T, Moore AW, Gull SF. Bayesian neural networks for Internet traffic classification. IEEE Trans Neural Networks. 2007;18(1):223–239.
9. Shin S, Lee S, Kim H, Kim S. advanced probabilistic approach for network intrusion forecasting and detection. Expert Systems with Applications 2012.
10. Homoliak I. Metrics for intrusion detection in network traffic; 2011.
11. Sangster B, O’Connor T, Cook T, Fanelli R, Dean E, Adams WJ, et al. Toward instrumenting network warfare competitions to generate labeled datasets. In CSET'09: Proc of the 2nd Workshop on Cyber Security Experimentation and Test; 2009.
12. Toward instrumenting network warfare competitions to generate labeled datasets. [Internet]. Available from: https://www.itoc.usma.edu/research/dataset.