We start our journey through the various disciplines of systems management with one of the most commonly known characteristics of any computer system—availability. As with any term that is widely used but often misunderstood, a good place to begin is with a clear definition of the word. Discussions about availability often include several words or phrases closely associated with this process, and it is important to understand the differences in meanings of these expressions. We differentiate the term availability from other terms like uptime, downtime, slow response, and high availability. This leads to showing the benefits of a single process owner and prioritizing some of the desirable traits in a candidate for the position of availability process owner.
We then describe effective techniques to use to develop and analyze meaningful measurements of availability. The main thrust of this chapter centers around methods to achieve high availability, which are presented in the form of the seven Rs of high availability. An offshoot of this is a discussion on how to empirically analyze the impact of component failures. We close the chapter by showing how customized assessment sheets can be used to evaluate the availability process of any infrastructure.
Before we present techniques to improve availability, it is important to define exactly what we mean by the term. You may think that this should be a fairly simple concept to describe, and to most end-users, it normally is. If the system is up and running, it is available to them. If it is not up and running, regardless of the reason, it is not available to them.
We can draw a useful analogy to any telephone system. When you pick up the receiver of a desk telephone or activate a mobile phone you generally expect an immediate connection. In those rare instances when a connection cannot be made, the entire telephone system appears to be down, or unavailable, to the user. In reality, it may be a problem with the central office, the switching station, or any one of a number of other components that have failed and are causing the outage. In the case of a mobile phone, it may simply be searching for an available cell.
As a customer you typically are less concerned with the root cause of the problem and more interested in when service will be restored. But the telephone technician who is responsible for maximizing the uptime of your service needs to focus on cause, analysis, and prevention, in addition to restoring service as quickly as possible.
By the same token, infrastructure analysts focus not only on the timely recovery from outages to service, but on methods to reduce their frequency and duration to maximize availability. This leads us to the following formal definition of availability.
There are several other terms and expressions closely associated with the term availability. These include uptime, downtime, slow response, and high availability. A clear understanding of how their meanings differ from one another can help bring the topic of availability into sharper focus. The next few sections will explain these different meanings.
The simplest way to distinguish the terms availability and uptime is to think of availability as oriented toward customers and the uptime as oriented toward suppliers. Customers, or end-users, are primarily interested in their system being up and running—that is, available to them. The suppliers (meaning the support groups within the infrastructure), by nature of their responsibilities, are interested in keeping their particular components of the system up and running. For example, systems administrators focus on keeping the server hardware and software up and operational. Network administrators have a similar focus on network hardware and software, and database administrators do the same with their database software.
What this all means is that the terms sometimes draw different inferences depending on your point of view. End-users mainly want assurances that the application system they need to do their jobs is available to them when and where they need it. Infrastructure specialists primarily want assurances that the components of the system for which they are responsible are meeting or exceeding their uptime expectations. Exactly which components’ individual uptimes influence availability the most? The following list shows 10 of the most common. This list is by no means exhaustive. In fact, for purposes of clarity I have included within the list selected subcomponents. For example, the server component has the subcomponents of processor, memory, and channels. Most of the major components shown have multiple subcomponents, and many of those have subcomponents of their own. Depending on how detailed we wish to be, we could easily identify 40-50 entities that come into play during the processing of an online transaction in a typical IT environment.
- Data center facility
- Server hardware (processor, memory, channels)
- Server system software (operating system, program products)
- Application software (program, database management)
- Disk hardware (controllers, arrays, disk volumes)
- Database software (data files, control files)
- Network software
- Network hardware (controllers, switches, lines, hubs, routers, repeaters, modems)
- Desktop software (operating system, program products, applications)
- Desktop hardware (processor, memory, disk, interface cards)
The large number of diverse components leads to two common dilemmas faced by infrastructure professionals in managing availability:
• Trading the costs of outages against the costs of total redundancy. Any component acting as a single source of failure puts overall system availability at risk and can undermine the excellent uptime of other components. The end-user whose critical application is unavailable due to a malfunctioning server will care very little that network uptime is at an all-time high. We will present some techniques for reducing this risk when we discuss the seven Rs of high availability later in this chapter.
• Multiple components usually correspond to multiple technical owners. This can be a formula for disaster when it comes to managing overall availability. One of the first tenets of management says that when several people are in charge, there is no one in charge. This is why it is important to distinguish availability—what the end-user experiences when all components of a system are operating—from uptime, which is what most owners of a single component focus on. The solution to this dilemma is an availability manager, or availability process owner, who is responsible for all facets of availability, regardless of the components involved. This may seem obvious, but many shops elect not to do this for technical, managerial, or political reasons. Most robust infrastructures follow this model. The overall availability process owner needs to exhibit a rare blend of traits—we will look at them shortly.
Slow response can infuriate users and frustrate infrastructure specialists. The following factors can contribute to slow response times:
• Traffic on the network
• Contention for disk volumes
• Disabling of processors or portions of main memory in servers
Each of these conditions requires analysis and resolution by infrastructure professionals. Understandably, users are normally unaware of these root causes and sometimes interpret extremely slow response as downtime to their systems. The threshold of time at which this interpretation occurs varies from user to user. It does not matter to users whether the problem is due to slowly responding software (slow response) or malfunctioning hardware (downtime). What does matter is that slow or non-responsive transactions can infuriate users who expect quick, consistent response times.
But slow response is different from downtime, and the root cause of these problems does matter a great deal to infrastructure analysts and administrators. They are charged with identifying, correcting, and permanently resolving the root causes of these service disruptions. Understanding the nature of the problem affects the course of action taken to resolve it. Slow response is usually a performance and tuning issue involving personnel, processes, and process owners which are different than those involved with downtime, which is an availability issue.
The primary difference between availability and high availability is that the latter is designed to tolerate virtually no downtime. All online computer systems are intended to maximize availability, or to minimize downtime, as much as possible.
In high-availability environments, a number of design considerations are employed to make online systems as fault tolerant as possible. I refer to these considerations as the seven Rs of high availability and discuss them later in this chapter. Figure 7-1 shows an example of a fault-tolerant computer manufactured by Stratus Technologies.

As we mentioned previously, managers of robust infrastructures select a single individual to be the process owner of availability. Some shops refer to this person as the availability manager. In some instances, it is the operations managers; in others, it is a strong technical lead in technical support. Regardless who these individuals are, or to whom they report, they should be knowledgeable in a variety of areas, including systems, networks, databases, and facilities; they also must be able to think and act tactically. A slightly less critical, but desirable, trait of an ideal candidate for availability process owner is a knowledge of software and hardware configurations, backup systems, and desktop hardware and software. Table 7-1 lists these traits and others, in priority order, for a likely applicant for the position of availability process owner.

The percentage of system availability is a very common measurement. It is found in almost all service-level agreements and is calculated by dividing the amount of actual time a system was available by the total time it was scheduled to be up. For example, suppose an online system is scheduled to be up from 6 a.m. to midnight Monday through Friday and from 7 a.m. to 5 p.m. on Saturday. The total time it is scheduled to be up in hours is (18 × 5) + 10 = 100 hours. When online systems first began being used for critical business processing in the 1970s, availability rates between 90 percent and 95 percent was common, expected, and reluctantly accepted. In our example, that would mean the system was up 90-95 hours per week or, more significantly, down for 5-10 hours per week and 20-40 hours per month. The formula for calculating the percent availability, or percent uptime as it is sometimes referred, is:
Percent Availability (Uptime) = (Hours Agreed Up - Hours Down)/Hours Agreed Up
Table 7-2 shows in a tabular form how this calculation is performed.

Customers quickly realized that 10 hours a week of downtime was unacceptable and began negotiating service levels of 98 percent and even 99 percent guaranteed availability. As companies expanded worldwide and 24/7 systems became prevalent, the 99 percent level was questioned. Systems needing to operate around the clock were scheduled for 168 hours of uptime per week. At 99 percent availability, these systems were down, on average, approximately 1.7 hours per week. Infrastructure groups began targeting 99.9 percent uptime as their goal for availability for critical business systems. This target allowed for just more than 10 minutes of downtime per week, but even this was not acceptable for systems such as worldwide email or e-commerce websites.
Another method of measuring availability or uptime is to use a rolling average, similar to that described in the following Real Life Experience. Table 7-3 shows how this calculation and others are performed.

So the question becomes: Is the percentage of scheduled service delivered really the best measure of quality and of availability? An incident at Federal Express several years ago involving the measurement of service delivery illustrates some points that could apply equally well to the IT industry. FedEx had built its reputation on guaranteed overnight delivery. For many years its principal slogan was:
When it positively, absolutely has to be there overnight, Federal Express.
FedEx guaranteed a package or letter would arrive on time, at the correct address, and in the proper condition. One of its key measurements of service delivery was the percentage of time that this guarantee was met. Early on, the initial goals of 99 percent and later 99.9 percent were easily met. The number of letters and packages they handled on a nightly basis was steadily growing from a few thousand to more than 10,000; less than 10 items were lost or delivered improperly.
A funny thing happened as the growth of their company started to explode in the 1980s. The target goal of 99.9 percent was not adjusted as the number of items handled daily approached one million. This meant that 1,000 packages or letters could be lost or improperly delivered every night and their service metric would still be met. One proposal to address this was to increase the target goal to 99.99 percent, but this goal could have been met while still allowing 100 items a night to be mishandled. A new set of deceptively simple measurements was established in which the number of items lost, damaged, delivered late, and delivered to the wrong address was tracked nightly regardless of the total number of objects handled.
The new set of measurements offered several benefits. By not tying it to percentages, it gave more visibility to the actual number of delivery errors occurring nightly. This helped in planning for anticipated customer calls, recovery efforts, and adjustments to revenue. By breaking incidents into three subcategories, each incident could be tracked separately as well as looked at in totals. Finally, by analyzing trends, patterns, and relationships, managers could pinpoint problem areas and recommend corrective actions. In many ways, this experience with service delivery metrics at Federal Express relates closely to availability metrics in IT infrastructures. A small, start-up shop may initially offer online services only on weekdays for 10 hours and target for 99 percent availability. The 1 percent against the 50 scheduled hours allows for 0.5 hours of downtime per week. If the company grows to the point of offering similar online services 24/7 with 99 percent availability, the allowable downtime grows to approximately 1.7 hours.
A better approach is to track the quantity of downtime occurring on a daily, weekly, and monthly basis. As was the case with FedEx, infrastructure personnel can pinpoint and proactively correct problem areas by analyzing the trends, patterns, and relationships of these downtimes. Robust infrastructures also track several of the major components comprising an online system. The areas most commonly measured are the server environment, the disk storage environment, databases, and networks.
The tendency of many service suppliers to measure their availability in percentages of uptime is sometimes referred to as the rule of nines. Nines are continually added to the target availability goal (see Table 7-4). The table shows how the weekly minutes of allowable downtime changes from our example of the online system with 100 weekly hours and how the number of allowable undelivered items changes from our FedEx example.

Improving levels of availability often involves capital expenditures which most companies are reluctant to invest in unless a strong, convincing business justification is offered. Calculating and presenting the cost of a single hour of downtime can be a very convincing business justification. The costs should be verified with representatives from both the user community and the finance committee. Table 7-5 lists the cost of a single hour of downtime for various businesses.

The goal of all availability process owners is to maximize the uptime of the various online systems for which they are responsible—in essence, to make them completely fault tolerant. Constraints inside and outside the IT environment make this challenge close to impossible. Some of the factors working against that elusive goal of 100 percent availability—the ultimate expression of high availability—include the following:
• Budget limitations
• Component failures
• Faulty code
• Human error
• Flawed design
• Natural disasters
• Unforeseen business shifts (such as mergers, downturns, political changes)
There are several approaches that can be taken to maximize availability without breaking the budget bank. Each approach starts with the same letter, so we refer to them as the seven Rs of high availability (see the following list). We will explain each one separately.
- Redundancy
- Reputation
- Reliability
- Repairability
- Recoverability
- Responsiveness
- Robustness
Manufacturers have been designing this into their products for years in the form of redundant:
• Power supplies
• Multiple processors
• Segmented memory
• Redundant disks
This can also refer to entire server systems running in a hot standby mode. Infrastructure analysts can take a similar approach by configuring disk and tape controllers, and servers with dual paths, splitting network loads over dual lines, and providing alternate control consoles—in short, eliminate as much as possible any single points of failure that could disrupt service availability.
The next three approaches—reputation, reliability, and repairability—are closely related. Reputation refers to the track record of key suppliers. Reliability pertains to the dependability of the components and the coding that go into their products. Repairability is a measure of how quickly and easily suppliers can fix or replace failing parts. We will look at each of these a bit more closely.
The reputation of key suppliers of servers, disk storage systems, database management systems, and network hardware and software plays a principle role in striving for high availability. It is always best to go with the best. Reputations can be verified in several ways, including the following:
• Percent of market share
• Reports from industry analysts such as Gartner Group
• Publications such Wall Street Journal and ComputerWorld
• Track record of reliability and repairability
• Customer references
Customer references can be especially useful when it comes to confirming such factors as cost, service, quality of the product, training of service personnel, and trustworthiness.
The reliability of the hardware and software can also be verified from customer references and industry analysts. Beyond that, you should consider performing what we call an empirical component reliability analysis. The following list describes the seven steps required to accomplish this.
- Review and analyze problem management logs.
- Review and analyze supplier logs.
- Acquire feedback from operations personnel.
- Acquire feedback from support personnel.
- Acquire feedback from supplier repair personnel.
- Compare experiences with other shops.
- Study reports from industry analysts.
An analysis of problem logs should reveal any unusual patterns of failure and should be studied by supplier, product, using department, time and day of failures, frequency of failures, and time to repair. Suppliers often keep onsite repair logs that can be perused to conduct a similar analysis. Table 7-6 shows a sample supplier repair log.

Feedback from operations personnel can often be candid and revealing as to how components are truly performing. This can especially be the case for offsite operators. For example, they may be doing numerous resets on a particular network component every morning prior to start-up, but they may not bother to log it since it always comes up. Similar conversations with various support personnel such as systems administrators, network administrators, and database administrators may solicit similar revelations. You might think that feedback from repair personnel from suppliers could be biased, but in my experience they can be just as candid and revealing about the true reliability of their products as the people using them. This then becomes another valuable source of information for evaluating component reliability, as is comparing experiences with other shops. Shops that are closely aligned with your own in terms of platforms, configurations, services offered, and customers can be especially helpful. Reports from reputable industry analysts can also be used to predict component reliability.
A common metric for reliability of components, applications or systems is the average or mean time between failures (MTBF). This is a measure of the average length of time an entity is expected to stay up and operational over a given period of time; this timeframe is often a year and it’s known as the sampling interval. The formula used to compute MTBF is:
MTBF = sampling interval / # of failures during sampling interval
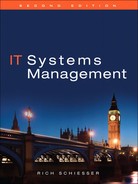
Table 7-7 shows how the MTBF of three months would be computed (along with MTTR described in next section) for the reliability of a component during calendar year (CY) 2009.
This refers to is the relative ease with which service technicians can resolve or replace failing components. A common metric used to evaluate this trait is the average or mean time to repair (MTTR). MTTR is sometimes interpreted as the mean time to recover, the mean time to restore, or the mean time to resolve. It measures the average time it takes to do the actual repair. The formula used to compute MTTR is:
MTTR = sum of repair times / # of failures
For example, if a component failed four times in the last year with repair times (see Table 7-6), the average—or mean—time to repair would be 41 minutes. In more sophisticated systems, repairs can be done from remote diagnostic centers where failures are detected and circumvented, and arrangements are made for permanent resolution with little or no involvement of operations personnel.
The next characteristic of high availability is recoverability. This refers to the ability to overcome a momentary failure in such a way that there is no impact on end-user availability. It could be as small as a portion of main memory recovering from a single-bit memory error; it can be as large as having an entire server system switch over to its standby system with no loss of data or transactions. Recoverability also includes retries of attempted reads and writes out to disk or tape, as well as the retrying of transmissions down network lines.
Recoverability was a major design factor when the communication protocols for the Internet were being developed, especially the two major ones of the Transmission Control Protocol (TCP) and the Internet Protocol (IP). TCP receives 8-bit bytes of data from an application and segments them into packets. TCP then passes the packets on to the IP, which delivers them through a network of networks (the Internet) to their destination, where a receiving TCP module accepts them. TCP checks to make sure that no packets are lost by giving each packet a sequence number, which is also used to make sure that the data are delivered in the correct order. The TCP module at the far end sends back an acknowledgement for packets which have been successfully received. If a set of packets is not received properly, no acknowledgement is returned and the whole set is re-transmitted. This aspect of recoverability adds greatly to network availability.
This trait is the sense of urgency all people involved with high availability need to exhibit. This includes having well-trained suppliers and in-house support personnel who can respond to problems quickly and efficiently. It also pertains to how quickly the automated recovery of resources such as disks or servers can be enacted. Escalation is another aspect of responsiveness that ensures higher levels of technical expertise and management support are involved to restore availability as quickly as possible. Escalation guidelines are usually documented in service-level agreements between IT and business customers.
This is the final characteristic of high availability and it describes the overall design of the availability process. A robust process will be able to withstand a variety of forces—both internal and external—that could easily disrupt and undermine availability in a weaker environment. Robustness puts a high premium on documentation and training to withstand the following:
• Technical changes as they relate to:
Platforms
Products
Services
Customers
• Personnel changes as they relate to:
Turnover
Expansion
Rotation
• Business changes as they relate to:
New direction
Acquisitions
Mergers
These seven Rs of high availability all contribute in a unique way to extending uptime, minimizing downtime, and improving the overall level of service provided by online systems.
Over the years, many clients have asked me for a quick and simple method to evaluate the quality, efficiency, and effectiveness of their systems management processes. In response to these requests, I developed the assessment worksheet shown in Figure 7-2. Process owners and their managers collaborate with other appropriate individuals to fill out this form. Along the left column are 10 categories of characteristics about a process. The degree to which each characteristic is put to use in designing and managing a process is a good measure of its relative robustness.

The categories that assess the overall quality of a process are:
• Executive support
• Process owner
• Process documentation
Categories assessing the overall efficiency of a process consist of:
• Supplier involvement
• Process metrics
• Process integration
• Streamlining/automation
The categories used to assess effectiveness include:
• Customer involvement
• Service metrics
• The training of staff
The evaluation of each category is a very simple procedure. The relative degree to which the characteristics within each category are present and being used is rated on a scale of 1 to 4, with 1 indicating no presence and 4 indicating a large presence of the characteristic. Although the categories are the same for each of the 12 processes, the type of specific characteristics within each category varies from process to process. I address these differences by customizing the worksheet for each process being evaluated.
For example, suppose the executive sponsor for the availability process demonstrated some initial support for the process by carefully selecting and coaching the process owner. However, presume that over time this same executive showed no interest in analyzing trending reports or holding direct report managers accountable for outages. I would consequently rate the overall degree to which this executive showed support for this process as little and rate it a 2 on the scale of 1 to 4. On the other hand, if the process owner actively engages key customers in the design and use of the process, particularly as it pertains to availability metrics and service level agreements, I would rate that category a 4.
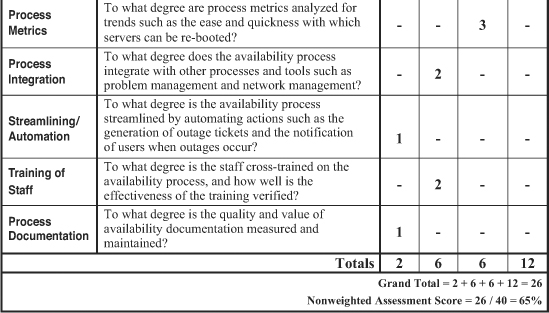
Each category is similarly rated (see Figure 10–6). Obviously, a single column could be used to record the ratings of each category; however, if we format separate columns for each of the four possible scores, categories scoring the lowest and highest ratings stand out visually. I have filled in sample responses for each category to show how the entire assessment might work. We now sum the numerical scores within each column. In our sample worksheet this totals to 2 + 6 + 6 + 12 = 26. This total is then divided by the maximum possible rating of 40 for an assessment score of 65 percent.
Apart from its obvious value of quantifying areas of strength and weakness for a given process, this rating provides two other significant benefits to an infrastructure. One is that it serves as a baseline benchmark from which future process refinements can be quantitatively measured and compared. The second is that the score of this particular process can be compared to those of other infrastructure processes to determine which ones need most attention.
In my experience, many infrastructures do not attribute the same amount of importance to each of the 10 categories within a process, just as they do not all associate the same degree of value to each of the 12 systems management processes. I refined the assessment worksheet to account for this uneven distribution of category significance—I allowed weights to be assigned to each of the categories. The weights range from 1 for least important to 5 for most important, with a default of 3.
Figure 7-3 shows an example of how this works. I provide sample weights for each of the rated categories from our sample in Figure 7-2. The weight for each category is multiplied by its rating to produce a final score. For example, the executive support category is weighted at 3 and rated at 2 for a final score of 6. We generate scores for the other nine categories in a similar manner and sum up the numbers in each column. In our sample worksheet, the weights add up to 30, the ratings add up to 26 as before, and the new scores add up to 90.


The overall weighted assessment score is calculated by dividing this final score of 90 by the maximum weighted score (MWS). By definition, the MWS will vary from process to process and from shop to shop, since it reflects the specific weighting of categories tailored to a given environment. The MWS is the product of the sum of the 10 weights % 4, the maximum rating for any category. In our example, the sum of the 10 weights is 30, so our MWS = 90 / (30 % 4) = 75 percent.
Your next questions could well be: Why is the overall weighted assessment score of 75 percent higher than the nonweighted assessment score of 65 percent? And what is the significance of this? The answer to the first question is quantitative; the answer to the second one is qualitative. The weighted score will be higher whenever categories with high weights receive high ratings or categories with low weights receive low ratings. When the reverse occurs, the weighted score will be lower than the nonweighted one. In this case, the categories of customer involvement, supplier involvement, and service metrics were given the maximum weights and scored high on the ratings, resulting in a higher overall score.
The significance of this is that a weighted score will reflect a more accurate assessment of a process because each category is assigned a customized weight. The more frequently the weight deviates from the default value of 3, the greater the difference will be between the weighted and nonweighted values.
We can measure and streamline the availability process with the help of the assessment worksheet shown in Figure 7-2. We can measure the effectiveness of an availability process with service metrics such as the percentage of downtime to users and time lost due to outages in dollars. Process metrics—such as the ease and quickness with which servers can be re-booted—help us gauge the efficiency of the process. And we can streamline the availability process by automating actions such as the generation of outage tickets whenever an online system goes down (rather than having service desk staff doing this) and by notifying users with automated voicemails and emails (if email is up) when outages occur.
This chapter described the first of our 12 systems management processes—availability. We began with a formal definition of the process and differentiated it from the related terms of uptime, downtime, slow response, and high availability. This led us to the benefits of a single process owner, for which we prioritized a list of desirable traits this individual should possess. We next discussed methods to measure and analyze availability and included an example from Federal Express to help illustrate these points.
The main portion of this chapter centered on approaches we can use to strive for high availability. We called these the seven Rs of high availability: redundancy, reputation, reliability, repairability, recoverability, responsiveness, and robustness. Each was described at some length. We concluded this chapter with a detailed discussion on how to quickly assess the quality, efficiency, and effectiveness of an infrastructure’s availability process. We presented two assessment worksheets along with an explanation of how to perform such an assessment.
1. With so many components influencing system uptime, it is usually preferred to have several individuals responsible for availability. (True or False)
2. A 24x7 system contracted to be available 99.0 percent can be down for 1.5 hours per week and still be in compliance. (True or False)
3. One of the most effective measurements of availability is:
a. percent of uptime
b. percent of downtime
c. amount of time up
d. amount of time down
4. For a 24x7x365 product or service, how much annual down time would result from seven 9’s availability? __________ four 9’s?__________ five 9’s? __________
5. If you were providing Internet services and availability was one of its major features, how would you market it?
3. Association for Computer Operations Managers (AFCOM); www.afcom.com