One of the distinctions that separate world-class infrastructures from those that are just marginal is the robustness of their processes. In this chapter we examine how to develop robust processes for maximum effectiveness. We also show how this prepares them for the appropriate use of technology.
We begin by reviewing several of the other factors that are usually evident in any world-class infrastructure. Next we discuss in detail the 24 characteristics common to any well-designed robust process, with examples to clarify some of the salient points. The last of these 24 characteristics involves the application of technology to automate selected steps. It is this use, and occasional misuse, of technology and automation that often separates the well-managed infrastructure from the poorly operated one. We conclude the chapter by discussing the differences between formal and informal processes, effective brainstorming ground rules, and methods to prioritize requirements.
There are many criteria that distinguish a world-class infrastructure from that of a mediocre one. Table 19-1 summarizes 11 of the most common of these factors. We will look at each of these criteria more closely.

As we discussed in Chapter 1, “Acquiring Executive Support,” executive support is one of the primary prerequisites for implementing a world-class infrastructure. Executive support does not mean the mere approval of budgets for hardware, software, and human resources—executives in many firms with mediocre infrastructures readily approve budgets. Executive support begins with an IT executive who actively participates in the planning, development, and decision-making processes of systems management, but there must also be support from executives of other areas as well.
Active participation by executives can take on many forms. It may involve executives taking the time to understand the challenges and obstacles of providing sound infrastructures. It may consist of managers helping to prioritize which functions of systems management are most important to their firms. It may result in executives backing up their staffs when negotiating reasonable—rather than unrealistic (more frequently the case)—service levels with customers. Finally, it may be the CIO or his or her representative ensuring that other departments within IT, notably applications development, actively support and comply with established infrastructure policies, procedures, and standards.
Over the years I have observed that one of the most common characteristics that differentiate well-managed infrastructures from those poorly managed is the use of metrics. One of the first distinctions in this regard is the difference between merely collecting data and establishing truly meaningful metrics as derived from this data.
For example, most companies today collect some type of data about outages to their online systems, regardless of whether the systems are hosted on mainframes, client-servers, or the Internet. A typical metric may be to measure a particular system’s percentage of uptime over a given period of time and to establish a target goal—for instance, 99 percent uptime. The data collected in this example may include the start and end times of the outage, the systems impacted, and the corrective actions taken to restore service. The metric itself is the computation of the uptime percentage on a daily, weekly, or monthly basis for each online system measured. Compiling the outage data into a more meaningful metric may involve segregating the uptime percentage between prime shift and off shift. Or it could be reporting on actual system downtime in minutes or hours, as opposed to the percentage of availability. A meaningful availability metric may also be a measure of output as defined by the customer. For example, we had a purchasing officer customer who requested that we measure availability based on the number of purchase orders his staff was able to process on a weekly basis.
Instituting meaningful metrics helps improve the overall management of an infrastructure, but the ultimate use of them involves their analysis to reveal trends, patterns, and relationships. This in-depth analysis can often lead to the root cause of problems and a more proactive approach to meeting service levels.
World-class infrastructures employ a proactive approach to identify and prevent potential problems impacting performance and availability. Marginal infrastructures are forced to take a more reactive approach toward problem solving. For example, a proactive strategy may use the analysis of meaningful utilization metrics to predict when an out-of-capacity condition is likely to occur. Armed with this information, technicians can then decide whether to add more capacity or to reschedule or reduce workloads to prevent outages or performance problems. A reactive approach allows no time to identify these conditions and to make proactive decisions. Other performance and capacity indicators such as memory swaps and bandwidths can similarly be analyzed to proactively identify and prevent bottlenecks and outages.
Well-managed infrastructures do far more than simply log problems in their call centers. Technicians in these environments track, age, and escalate calls; they pinpoint root causes and solicit customer feedback; and they analyze trends, patterns, and relationships between problems, changes, and other factors. Call management is really the cornerstone of a sound problem management philosophy. Marginal infrastructure organizations often do not see or understand the integrated relationships between problem management and other management areas such as change, availability, networks, and performance and tuning.
Many firms are reluctant to empower their employees. Some managers believe only supervisory-level staff are capable of making technical decisions or personnel judgments. Others may feel employees are not capable or well trained enough to be decisive. Still others fear that that granting employees more authority results in them requesting more compensation. Progressive infrastructure organizations tend to mitigate these empowerment issues with communication, training, empathy, and support.
The issue of management support can be key in determining an employee-empowerment program’s success or failure. Employees are bound to make incorrect judgments on occasion when empowered with new decision-making authorities. Supportive managers who show the interest and time to understand and correct the faulty decision-making seldom see poor judgments repeated.
Standards can apply to virtually every aspect of IT, from versions of desktop software to mainframe operating systems; from dataset naming conventions to password construction; and from email systems to network protocols. When properly applied, standards can simplify maintenance, shorten deployment times, and ultimately reduce costs. But proper application requires that standards be thoroughly developed and effectively enforced.
Many shops develop only those standards that are simple to deploy or easy to enforce. In this sense these companies are similar to those that collect only the metrics that are simple to implement or easy to measure. In both cases, the real value of these activities is compromised.
A world-class infrastructure, on the other hand, usually identify all stakeholders of a particular standard prior to its development and invite them to participate in its design, implementation, and enforcement. These stakeholders typically consist of representatives of user groups most impacted by the standard, including internal and external customers and suppliers. Their participation goes a long way to ensuring buy-in, support, and compliance.
World-class infrastructures invest heavily in training their staffs. This training may take the form of on-the-job training, onsite classroom instruction, offsite courses at local facilities, out-of town classes, or customized training conducted by vendors. Top-rated infrastructures often employ a buddy system, or a one-on-one mentoring program in which experienced senior-level technicians share both the content and the application of their knowledge with junior-level staff. Cross-training between infrastructure departments—such as between operations and networks or between system administration and database administration—is another effective method used by well-managed organizations to optimize employee training.
World-class infrastructures not only have well-trained employees, they have well-equipped employees. Less-sophisticated shops sometimes sacrifice hardware and software tools in the name of cost savings. This is often a false economy that can drag out problem resolution times, extend the length of outages, occasionally duplicate work efforts, and eventually frustrate key staff members to the point that they seek employment elsewhere.
While budget items need to be justified and managed, top-rated infrastructures usually find the means to provide the tools their technicians need. These tools may include pagers, cell phones, personal assistant palmtops, laptops, at-home high-speed network connections, and specialized software for desktops.
World-class infrastructures know how to develop, design, and maintain robust processes. This topic will be described at length in the next section.
Managers of highly regarded infrastructures understand that the best application of technology—especially automation—comes only after processes have been designed with robustness and then streamlined. Mediocre shops often rush to automate prior to streamlining. This almost inevitably leads to chaos brought about by processes that are highly automated but poorly designed. The next chapter will cover this in detail.
World-class infrastructures go beyond just having well-designed systems management functions. The leaders of these organizations know how to select and integrate several of these processes. Chapter 21, “Integrating Systems Management Processes,” explains the importance of combining some of these functions and describes in detail how both tactical and strategic functions should be integrated.
The ninth criterion of a world-class infrastructure, as we just saw, is the use of robust processes. What exactly is meant by a process being truly robust and what characteristics are inherent in such a process? This section addresses those questions. The following lists 24 of the most common attributes of a robust process. We will discuss each of them in detail.
- Process objective is identified.
- Executive sponsor is identified and involved.
- Process owner is identified and given responsibility for and authority over the process.
- Key customers are identified and involved.
- Secondary customers are identified and consulted.
- Process suppliers are identified and involved.
- Process inputs are identified.
- Process outputs are identified.
- Process is described by a sound business model.
- Process hierarchy is understood.
- Execution is enforceable.
- Process is designed to provide service metrics.
- Service metrics are recorded and analyzed, not just collected.
- Process is designed to provide process metrics.
- Process metrics are recorded and analyzed, not just collected.
- Documentation is thorough, accurate, and easily understood.
- Process contains all required value-added steps.
- Process eliminates all non-value-added steps.
- Process guarantees accountability.
- Process provides incentives for compliance and penalties for avoidance or circumvention.
- Process is standardized across all appropriate departments and remote sites.
- Process is streamlined as much as possible and practical.
- Process is automated wherever practical, but only after streamlining.
- Process integrates with all other appropriate processes.
The overall objective of the process needs to be stated, written down, shared with all appropriate parties, and agreed to and clearly understood by all process design participants. The objective should answer the questions of what problem the process will solve, which issues it will address, and how the process will add value and quality to the environment.
Each process needs to have an executive sponsor who is passionate about the successful design and ongoing execution of the process. This person provides support, resources, insight, and executive leadership. Any required participation or communication with other groups, either inside or outside of the infrastructure, is typically arranged by the executive sponsor. This individual is often the manager of the process owner.
This person leads the team that designs the process, identifies the key customers and suppliers of it, and documents its use. The process owner executes, communicates, and measures the effectiveness of the process on an ongoing basis.
Key customers are those individuals who are the immediate users and direct beneficiaries of the process. For example, suppose you are designing processes to request the reprint of a report or the restoration of a file. Key customers for these processes may be users who are most likely to request these services on a regular basis. Their involvement in developing the process is important to ensure practical design and ease of use.
Secondary customers are those that may use a process less frequently than primary customers or who may be the eventual rather than immediate beneficiaries of the process. Using the example in #4, if administrative assistants are making the original requests for reprints or restorations, then their managers are likely to be the secondary customers of the process. Their consultation can be helpful since they may be the ultimate users of the process.
Process suppliers are the individuals who provide the specific inputs to a process. These suppliers may be
• Internal to an IT infrastructure (for example, data-entry departments)
• External to an IT infrastructure but internal to IT (a development group inputting change requests)
• External to IT but internal to a company (an outside user group supplying report modification information)
• External to a company (hardware and software vendors who may provide details about how an upgrade is to be performed)
These are the specific deliverables or services being provided to the primary and secondary customers. The quality of the delivery and content of these outputs is usually measured with service metrics.
These are the specific input entities required by the process. They may take the form of soft inputs such as data, information, or requests; or they may be hard inputs such as diskettes, tapes, or other physical entities.
In simple terms, a robust process should make common business sense. The benefits of using the process should exceed the cost and efforts expended to design, execute, and maintain the process. The business side of a robust process sometimes involves leasing agreements, maintenance agreements, and service level agreements.
Some processes have secondary processes, or sub-processes, underneath them. Individuals who are developing well-designed robust processes know and understand the relationships between the primary and secondary processes.
Almost any process, regardless of design, must be enforced to be effective. Whenever possible and practical, software techniques such as passwords, authorizations, audit trails, or locks should be used to enforce compliance with a process. When technical enforcement is not practical, management support, review boards, metrics, or other procedural techniques should be used to ensure enforcement.
Most processes measure something associated with their output. Often this involves a quantitative measure such as transaction processes per second or jobs completed per hour.
In addition to these, a robust process also focuses on qualitative measures that are oriented toward the end-user. These metrics show the relative quality of the service being provided. For example, service metrics involving a report-delivery process may include not only how often the report is delivered on time but whether it was delivered to the right individual, in the correct format, with accurate content, and on the proper media. Service metrics should measure the benefits of the process to the end-users in their own terms. The metrics should be customer oriented and focused on measuring the right thing; that is, these metrics should exhibit effectiveness.
Mediocre infrastructures often invest a fair amount of time, money, and energy to collect and compile metrics; then they do little to analyze them. The real value of meaningful measurements comes from thoroughly and consistently examining these metrics for trends, patterns, and relationships and then applying the results of the analysis to improve the effectiveness of the particular service being measured.
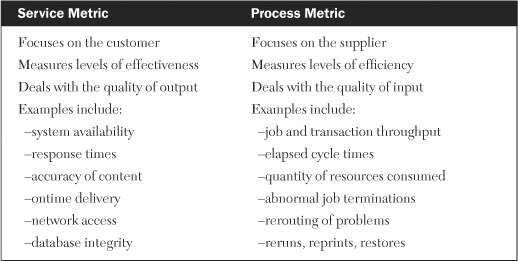
Robust processes have not only service metrics associated with them but process metrics as well. The key difference between a service metric and a process metric is that a service metric focuses on how effective a process is in regards to a customer, while a process metric focuses on how efficient a process is in regards to a supplier.
A process metric indicates the productivity of a procedure by measuring such things as resources consumed or cycle times. The frequency of on-time delivery of reports is a service metric because it measures the end result of the process (which is what the customer gets). The number of times the report had to be reprinted to obtain acceptable quality is a process metric because it measures the amount of effort required to produce the end product. Common examples of process metrics include abnormally ending job processing, rerouting problems, rerunning jobs, reprinting reports, and restoring files.
In Chapter 4, “Customer Service,” we discussed an enhanced version of the customer/supplier matrix that incorporated both service metrics and process metrics. This characteristic reinforces the notion that process metrics should be supplier-oriented and focused on measuring the entity right rather than measuring the right entity. In other words, these metrics determine efficiency. Table 19-2 summarizes the differences between service metrics and process metrics.
Just as service metrics need to be compiled and analyzed, so do process metrics. The importance of analyzing missed process metrics is often overlooked when the associated service metrics are met. This could be the case in terms of a service metric involving output delivery being met even though the job and its output had to be reprocessed numerous times. As with service metrics, the real value of meaningful process metrics comes from thoroughly and consistently examining them for trends, patterns, and relationships and then applying the results of the analysis to improve the efficiency of the particular service being measured.
Documentation is one of the fundamentals that clearly separate mediocre infrastructures from those that are truly world-class. Well-written documentation facilitates the training, maintenance, and marketing of key processes. Progressive shops hold appropriate staffs accountable for reading and understanding key documentation by making it part of their performance reviews. These shops also have their new employees test the clarity and readability of the writing while ensuring that senior analysts and technical leads have validated the accuracy of the material. Thorough documentation eases the tasks of verifying that all required value-added steps are present and that all non-value-added steps have been eliminated.
Effective documentation can come in various forms and can be evaluated in various ways. Some of these forms include online and hard-copy narrative procedures, diagramed illustrations (such as flowcharts or bubble charts), and Web-enabled help menus. Later in this chapter we offer a proven method for effectively evaluating all the various forms of process documentation.
To use a legal analogy, value-added steps are to a robust process what the truth is to a credible witness’s testimony. The process should contain the value-added steps, all of the value-added steps, and nothing but the value-added steps. Two key attributes of a robust process are those of effectiveness and efficiency. Process effectiveness means that all existing steps are adding value to the end result. Key customers, suppliers, and process owners should meet prior to and after development of the documentation to identify all the value-added steps and to ensure that all are appropriately inserted into the final process.
If a step is not directly contributing value to the overall objective of the process, it should be eliminated. This attribute is critical to eventually automating the process. Two activities are required to completely eliminate all non-value-added steps:
- All steps in a process, regardless of how small, even if previously undocumented, need to be identified. This comprehensive list of the exact steps of a procedure is commonly referred to as the informal process. (The next section discusses the differences between and significance of formal and informal processes.)
- An extremely critical evaluation of each of these steps needs to be conducted with an eye toward eliminating any steps that do not directly contribute to the desired output of a process.
Process metrics, performance charts, and trending reports should be used to quickly identify when a department or an individual is not following the prescribed procedure, with direct feedback to and consequences from management. In order for this to work, the process designers and owners must give management sufficient tools to carry out their enforcement. Management, in turn, must follow up with fair, timely, and appropriate actions to ensure process compliance in the future.
One of the most effective incentives for compliance is efficiency. If it takes more time and effort to go around a process than to go through it, most employees will choose to go through it (use the process). The challenge is to remove the obstacles normally associated with using a process and to insert roadblocks for circumvention. Properly streamlining and then automating a process can encourage its use. Security measures such as passwords and locks, as well as management measures such as exception reports and accountability, can discourage circumvention.
Some processes may have been developed at different remote sites at different times and consequently have slightly different standards of implementation. For example, one of my clients had an older change management process at a remote site based on an email system and a newer version at the central site based on an Access database system. Before either process could be optimized, an agreed standard needed to be reached, which it was. Nonstandard processes often come into play as a result of acquisitions, mergers, or takeovers. The technical challenge of implementing an agreed-upon standard is often much easier than actually reaching that consensus in the first place, which often involves politics.
Streamlining a process involves removing all non-value-added steps, eliminating redundant steps, placing the steps in the most efficient sequence possible, and streamlining individual steps as much as possible. For long established processes, this may be difficult to accomplish due to users being deeply entrenched in inefficient practices. Here are three of the most common responses we get when we ask why a particular process cannot or should not be changed:
• We’ve always done it that way.
• It seems to work most of the time, so why bother changing it?
• Analyst X designed this process, and only he can change it.
(We hear this last response even after analyst X has left the department.) These explanations are not adequate justifications for keeping a process the same when improvements through streamlining are clearly warranted. Once non-value-added steps are removed, streamlining should proceed: eliminate redundant steps, place the steps in the most efficient sequence possible, and streamline individual steps as much as possible.
Automation can end up being either beneficial or detrimental depending on how the automation is designed and implemented. Due to the importance and complexity of this attribute, we will discuss it more in the next section.
Several processes within systems management naturally complement each other. For example, problem and change management are separate processes, but they often rely on each other for optimum effectiveness. Similarly, performance/tuning and capacity planning are almost always closely related to each other. The degree to which processes complement and integrate with each other is a valuable characteristic and is the topic of Chapter 21, “Integrating Systems Management Processes.”
Most IT professionals are familiar with the concept of a formal process. By this we mean a procedure or methodology in which all of the major steps are explained and documented. The write-up is normally signed off on by a manager in authority, disseminated to appropriate members of the staff, and made accessible for future reference in either electronic or hard-copy form. Written procedures on how to reboot servers, initiate online systems, or back up or restore data are common examples of formal processes.
An informal process is a far more detailed account of its corresponding formal process. An analogy from the culinary arts illustrates this difference. Suppose you decide to duplicate a specialty of a gourmet cook by following his published recipe. You adhere precisely to each of the prescribed steps and create a dish that looks exactly like the original. But after the first bite, you know immediately that something just doesn’t seem right. It’s close but just a bit off the mark. Soon afterward you have the opportunity to watch this chef prepare the exact same dish in person. With her recipe in your hand, you note how she follows the exact steps in the exact order as you did. But occasionally she swirls the pan briefly and adds a pinch of this and a dash of that—steps so seemingly insignificant as to almost be ignored. In this case, the recipe listing the steps is the formal process, but if the small, innocuous steps that make the dish taste just right are included in the directions, you have the informal process—the sum of all the actual detailed steps involved.
The reason this is important is that knowledge of the small, critical steps of a process—little known and almost always undocumented—is a prerequisite to effective process improvement, streamlining, and eventual automation. Shops unaware of the complete informal procedure associated with a systems management process often fail in their attempts to redesign it into a robust process; they fail because tiny but significant steps are left out.
The development of a robust process requires several activities that are best facilitated with brainstorming sessions. These sessions can prove to be invaluable in gathering optimal designs, consensus of opinion, and all-important buy-in from diverse groups. But if they aren’t managed properly, they can also be time-consuming, expensive, and lacking in results. Over the years I have accumulated a list of helpful ground rules to make brainstorming sessions efficient, worthwhile, and effective:
- Agree on the clear objective(s) of the brainstorming.
- Stay focused on the objectives(s).
- Treat everyone as equals.
- Listen respectfully to each person’s input.
- Participate honestly and candidly.
- Maintain confidentiality when appropriate.
- Keep an open mind; suspend personal agendas.
- Ask anything—there are no dumb questions.
- Question anything you don’t understand.
- Speak only one voice at a time; no side conversations.
- Ensure everything relevant gets written down.
- If prioritizing, agree upon specific technique.
- If attempting consensus, agree upon voting method.
- Start and end on time—session, breaks, lunch.
- Critique the brainstorming session for improvements.
- Treat these as guidelines, not rules; customize as needed.
A common use of brainstorming is to identify the requirements for a particular discipline. Once members of a cross-functional team have identified a large list of requirements, they often struggle with ways to gain consensus on prioritizing them. Getting 10-15 members of a team to agree on the rankings of as many as 50 items can be a laborious, frustrating, time-consuming challenge. There are several effective methods that teams can use to develop an agreed-upon list of requirements by order of importance.
Three administrative tasks need to occur before establishing priorities:
- Display all requirements in plain view of all members of the cross-functional team. Flip charts, whiteboards, smart-boards, or laptop projection systems are ideal for this.
- The team needs to closely scrutinize the list to merge any similar requirements and to reword requirements needing additional clarity. Revisions to the list must be done with the consent of the entire team.
- Finally, the new list of requirements should be renumbered.
The most straightforward team approach for prioritizing a list of requirements is to ask each team member to assign a high, medium, or low designation to each requirement. These designations can be converted to numerical values (for example, high = 3, medium = 2, low = 1) to develop a quantification matrix like the sample shown in Table 19-3. The requirements can then be ranked according to their total values.
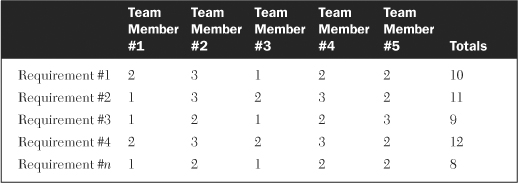
In the example shown in the table, the cross-functional team consists of five members who are evaluating n requirements. One drawback of this approach, particularly for small teams, is that it limits the range of priority values. With five members voting, the maximum value of a requirement is 5 * 3 = 15 and the minimum is 5 * 1 = 5. This means only 11 unique values (5 through 15) could be assigned. If 30 or 40 requirements are being evaluated, many will have duplicate values assigned to them. One way to address this is to add two more designations for each requirement and to adjust the values accordingly. One designation would be a combination of high/medium and the other a combination of medium/low. The new values now become high = 5, high/medium = 4, medium = 3, medium/low = 2, and low = 1. The new range of values now becomes 5 through 25, resulting in 21 unique values. This obviously does not guarantee the elimination of requirements with identical priorities, but it does greatly reduce their likelihood.
Another method—and one that yields the greatest range of priorities—is to have each member of the team numerically rank all requirements from the most important to the least important, with the most important given a value of 1, the second most important given a value of 2, and so on. The values of each requirement are then totaled. The requirement with the lowest total value is ranked first in the list of priorities (highest priority), the requirement with the next lowest total value is ranked second, and so on. This method is known as the nominal group technique (NGT) and is best used when precise delineations of priorities are needed. The drawback to it is the additional administrative work needed to generate and compile all of the necessary values.
A popular variation to the NGT is to limit the number of items ranked to only the top half or top quarter, depending on the number of requirements and team members. This works particularly well when there is a large number of requirements to prioritize and a relatively small group of individuals to rank them. For example, if there are 20 requirements to be ranked by a team of 10 members, then having each member ranking half or 10 of the items is a good approach. On the other hand, if there are 30 requirements to be prioritized by a team of 5 members, then asking each member to rank one-quarter, or 7, of the items is the approach to take.
This chapter began by presenting 11 criteria that distinguish a world-class infrastructure from that of a mediocre one. Then we looked at each of these in detail. Since one of the key criteria is that the processes used by an infrastructure be robust in nature, we went on to describe 24 characteristics of a robust process, including the automation of processes, the evaluation of documentation, and the integration of systems management processes. The next Chapter covers the automation and documentation of processes, and Chapter 21 covers process integration.
1. A robust process eliminates all non-value-added steps. (True or False)
2. Most any process, regardless of design, must be enforced to be effective. (True or False)
3. Which one of the following is more of a service metric rather than a process metric?
a. reruns of jobs
b. reprints of reports
c. response times of transactions
d. restores of files
4. The key difference between a service metric and a process metric is that a service metric focuses on how effective a process is in regards to a __________ while a process metric focuses on how efficient a process is in regards to a _________.
5. What types of training would you recommend for service-desk personnel to enable them to improve the quality of their services to users?