One of the distinctions that separate world-class infrastructures from marginal ones is the degree to which their processes are automated. In the first part of this chapter we present three important preparatory steps necessary for automating a process successfully and discuss how to use technology properly in this activity.
We then show how to evaluate the robustness of any process, using both weighted and nonweighted methods, based on 24 characteristics of the process. We conclude with a thorough discussion on how to evaluate the quality and value of any type of infrastructure process documentation.
How well a process is automated with technology often distinguishes whether an infrastructure is world-class, merely average, or even mediocre. The reason for this is that automation can frequently be a double-edged sword for IT shops. When properly applied, automation can greatly streamline processes, reduce cycle times, increase efficiency, minimize errors, and generally improve the overall service levels of an infrastructure.
When improperly applied, automation can do more harm than if never attempted in the first place. This can be due to the fact that applying automation to a poorly designed process merely results in a highly automated poor process. The output may be arrived at more quickly, but in all likelihood it will be unacceptable in quality and content. Applying the wrong type of technology to automate a process can also cause more problems than not automating at all. For example, one company attempted to automate part of their output processing with mechanical feeders that virtually eliminated the expensive and highly repetitive manual loading of paper into laser printers. Later, managers realized that only a limited type of specially bonded paper worked properly, causing them to eventually go back to the manual process.
Processes should not be automated until three key conditions have been met:
- The process should be well-designed and standardized to the maximum extent achievable. Say, for example, the process you are automating is used in multiple instances or at multiple sites. If the process has been well-designed and standardized at the outset, the eventual automation techniques can be migrated to the other occurrences of the process. This helps to cost-justify the expense of the automation.
- The process must be streamlined as much as possible. This is accomplished by eliminating all non-value-added steps and by ensuring all the necessary value-added steps are included. This should apply to all instances of a standardized process. This ensures that, no matter which parts of the process are selected as candidates for automation, they are, in fact, vital elements of the procedure.
- Discretion should be exercised. Select only those parts of a process for which automation solidly applies and then apply the proper type of technology. In other words, this is no time to be a proving ground for new technology. Many well-intentioned attempts at automating an entire process have failed miserably due to managers rushing to be the first to use their environments as a test bed for advanced but unproven techniques. This same automation may work in small parts of a process but not the process in its entirety.
Managers should fully understand the type and scope of automation being planned. Automation types usually come in the form of hardware, software, or some combination of the two. For example, some large-volume, high-speed laser printers use both hardware and software to automate the functions of loading, stacking, separating, bursting, and decollating output. Similarly, tape library systems can be automated to load, mount, dismount, and store tape cartridges.
In each example, both the type and scope of automation come into play. Automation of one centralized, high-speed laser printer may be appropriate for an output process that is well-designed, homegrown, and highly controlled. It may not be appropriate for smaller, diverse departmental printing due to cost, complexity, and maintainability. Similarly, an automated tape library system may not be appropriate in environments of low-volume, high-diversity, low-centralization, and multiple platforms. The message here is to thoroughly evaluate the type and scope of technology of the automation tools you might choose to use for each particular part of a process.
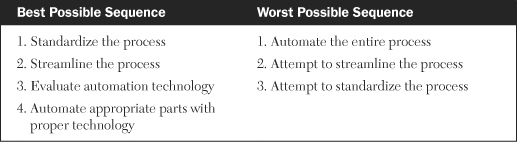
Understanding the need to standardize, streamline, and evaluate before one automates is only part of the puzzle. The sequence of these four activities is extremely critical to the success of any automation initiative. Many shops I have worked with want to automate first, thinking it will be bring about immediate efficiencies, cost savings, and improved quality of services. In most instances, the result is just the reverse. Instead of having a poorly designed manual process, you now end up with a poorly designed automated process. Greater inefficiencies, lower levels of quality, and eventually higher costs normally follow.
The only correct sequence of activities is as follows:
- Standardize a well-designed process.
- Streamline that process.
- Evaluate thoroughly the relative fit of the automation technology to the process parts.
- Automate the appropriate pieces with proper technology.
One of my more literature-oriented clients put this guideline to rhyme to help his staff remember it:
First standardize, streamline, and evaluate, Before you decide to automate.
Table 20-1 summarizes the best and the worst possible sequence scenarios for preparing for the automation of infrastructure processes.
Once you are familiar with the attributes that characterize a robust process, you can evaluate almost any process within your infrastructure. There are a variety of methods for doing this, and I will describe two common methods that I have used with prior clients.
- A straightforward nonweighted technique.
- A customized variation of the first that employs weighted values for each of the attributes.
In the first method, each of the 24 attributes is rated as to the level of its importance. In many cases, the attribute is either clearly in existence or it is not. If the attribute is present, it is given a rating of 2; if it is not present, it is given a rating of 0. In those cases where it may be difficult to ascertain whether a characteristic is fully realized but is, in some degree, present, it is rated as 1. Table 20-2 shows the results of an evaluation I conducted at three separate companies involving a process to install and migrate new levels of operating system software. Company X represents a prime defense contractor; company Y depicts a major motion picture studio; and company Z signifies a start-up dotcom e-tailor. The advantage of this method is that it is quick, simple, and easy to understand. Manager and analysts can use technology in the form of spreadsheets and databases to automate parts of this evaluation process by setting up templates and directories to sort and categorize these evaluations.


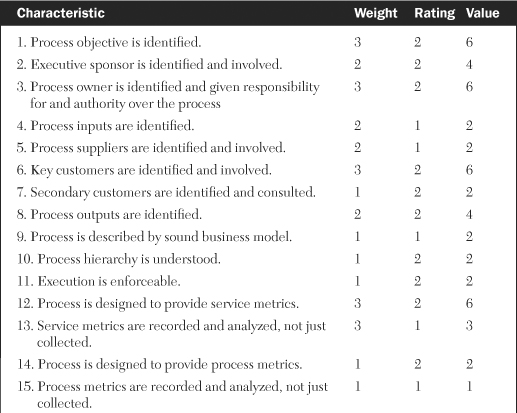
An alternative method of evaluating a process involves using weighted attributes. While all 24 attributes of a robust process are considered important, some characteristics may be more relevant or less significant than others, depending on an infrastructure’s particular environment. In this case, a numerical weighted value is assigned to each attribute. A common practice is to assign a weight of 3 for high importance, 2 for medium, and 1 for low importance. Each attribute is then evaluated for a 0, 1, or 2 rating similar to the nonweighted method. The weight and rating is then multiplied to give a final value for each characteristic.
The advantage of this method over the nonweighted one is that this technique allows you to customize the weightings to suit your particular environment and thus give a more accurate appraisal of your process. This method is especially useful when evaluating multiple processes in the same infrastructure so that comparisons and inferences against a standard can be drawn. Table 20-3 shows the weightings, ratings, and values from an evaluation I recently performed for a change management process. Managers and analysts can again use technology similar to that proposed for the nonweighted method to help automate parts of this technique.

An important aspect of any process is the documentation that accompanies it. Many shops develop excellent processes but fail to document them adequately. After an initially successful implementation of the process, many of these procedures become unused due to lack of documentation, particularly as new staff members who are unfamiliar with the process attempt to use it.
Some documentation is usually better than none at all, but adding value and quality to it increases the likelihood of the proper use of the process it describes. Evaluating the quality of documentation can easily become a very subjective activity. Few techniques exist to objectively quantify the quality and value of process documentation. That is why the following methodology is so unique and beneficial. I developed this approach over several years while working with many clients who were struggling with ways to determine both the quality and the value of their process documentation.
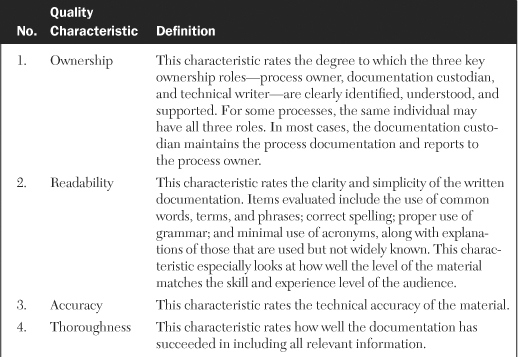
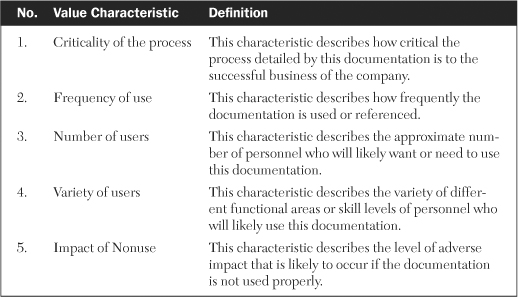
The purpose of evaluating the quality of content is to show to what degree the material is suitable for use. The purpose of evaluating its value is to show how important the documentation is to the support of the process and how important the process is to the support of the business. The quality of the content of documentation is evaluated with 10 common characteristics of usability. Table 20-4 lists these characteristics of quality of content and gives a definition of each.

The characteristic in both the quality and value figures were rated on a 0 to 3 scale based on the degree to which elements of each characteristic were met. Table 20-6 describes these ratings and their meanings.

There are three major benefits to this method of documentation evaluation:
- It gives a snapshot of the quality of existing documentation. It supplies this at a particular point in time, particularly documentation of high value. If improvements are made to the material which result in new ratings, they can be compared to the current rating.
- This method provides the ability to customize the criteria for measuring the quality and value of documentation. This allows for an evaluator to reflect changes in priority, strategy, or direction. In this way, the methodology remains applicable regardless of the specific criteria used.
- It allows for comparisons. The third benefit of this method is that it allows for comparisons of documentation between different types of processes within an infrastructure using the same standard of measure.
A client at a satellite broadcasting company recently asked me to evaluate a variety of their infrastructure process documentation. Table 20-7 lists the 32 pieces of documentation that I assessed and shows the wide diversity of material involved in the review.

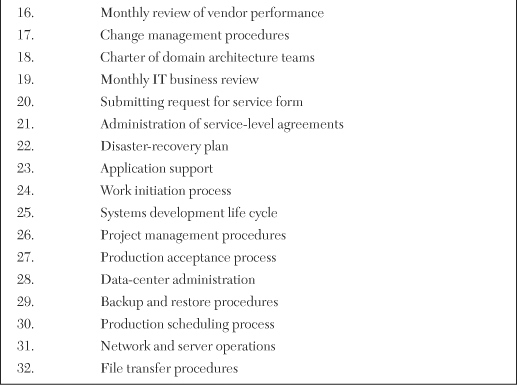
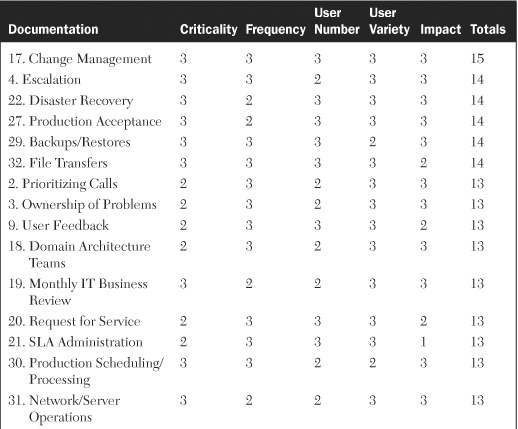
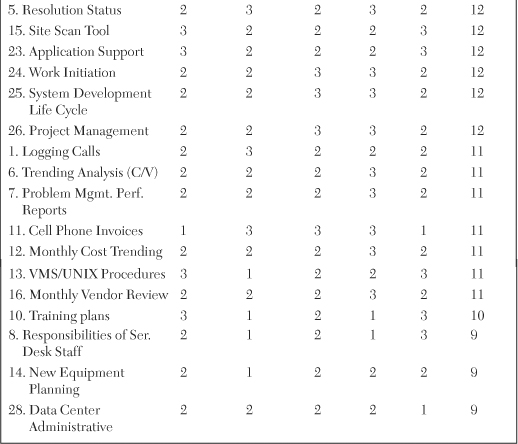
Table 20-8 lists the results of assessing the quality characteristics of each piece of documentation and shows the variety of numerical totals that resulted. Table 20-9 lists the results of assessing the value characteristics for each of the same pieces of documentation. Next we’ll discuss how these two pieces of information can be used together to indicate which pieces of documentation should be improved upon first.
Table 20-8. Ratings of Quality Characteristics for Various Types of Infrastructure Process Documentation

Table 20-9. Ratings of Value Characteristics for Various Types of Infrastructure Process Documentation
Once both the quality and value characteristics are evaluated, the two sets of attributes can be shown on a quality/value matrix (see Figure 20-1). Quality ratings are shown along the horizontal axis increasing to the right. Value ratings are shown along the vertical axis increasing as it ascends. Each axis is scaled from the lowest quality and value ratings up to the maximum possible. The benefit of this matrix is that it depicts both the value and quality of each piece of documentation on a single chart.
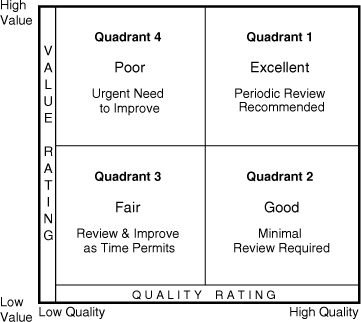
The matrix is then divided into four quadrants. Points in the upper-right quadrant (1) represent documentation that is both high in value and high in quality. This is the desired place to be and constitutes excellent documentation that requires little or no improvements and only periodic reviews to ensure continued high quality. Points in the lower-right quadrant (2) signify material that is high in quality but of a lower value to a particular infrastructure. Documentation in this area is generally rated as good but could be improved.
The lower-left quadrant (3) represents documentation that is relatively low in both value and quality. Material in this area is designated as only fair and needs to be improved in quality. Since the value is low, improvements are suggested on a time-permitting basis. Points in the upper-left quadrant (4) indicate documentation that is high in value but low in quality. Documentation in this area is considered to be at the greatest risk since it represents material that is of particular importance to this organization but is of poor quality. Documentation in this quarter of the matrix should be improved as soon as possible to prevent adverse impact to processes, procedures, and services.
Table 20-10 shows the combinations of the totals of the quality ratings from Table 20-8 and the totals of the value ratings from Table 20-9. Each entry is again numbered with the identifiers used in Table 20-7. Figure 20-2 shows the quality/value matrix populated with the identifiers of each piece of documentation in their appropriate quadrants. This depiction clearly shows which pieces of documentation need the greatest improvement in the most urgent manner.
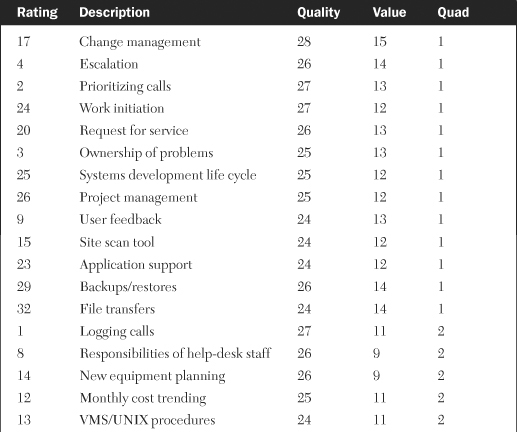
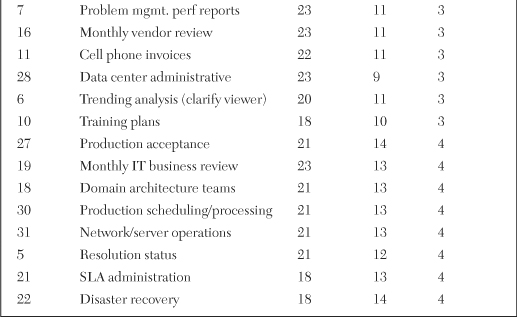

Those identifiers closest to the upper-left corner of quadrant 4 are in the greatest need of quick improvement because they are of the highest value to the organization and yet have the lowest level of quality. In this specific evaluation, it happened to be the documentation for disaster recovery denoted by identifier 22. Once these particular pieces of documentation are identified in the populated quality/value matrix, Table 20-8 can be used to determine which specific characteristics of documentation quality need to be improved most.
Software technology in the form of statistical analysis programs that integrate with any number of graphical presentation products provide a means to automate the generation of these displays and reports.
First we discussed the fact that processes must be well-designed, standardized, and streamlined before any attempt is made at automation. And then automation should be done only on those parts of a process for which it makes sense. Next we looked at the key activities involved with automating a process and emphasized the importance of following the proper sequence of steps.
Then we talked about ways to evaluate infrastructure processes in terms of robustness. We looked at both weighted and nonweighted rating methods using 24 attributes of a robust process.
An effective methodology for evaluating process documentation concluded this chapter. We looked at the importance of evaluating both the quality and the value of the documentation content, giving 10 quality characteristics and 5 value characteristics. Then we offered 32 types of infrastructure documentation that might be evaluated for quality and value and saw how the resulting ratings can be plotted on a quality/value matrix. Where they fall on the matrix indicates which documentation needs to be improved the quickest to keep infrastructure processes as robust as possible.
1. Automation types usually come in the form of either hardware-only or software-only but not a combination of the two. (True or False)
2. Many shops develop excellent processes but fail to document them adequately. (True or False)
3. When planning for the automation of a process, the correct sequence of activities is:
a. standardize, streamline, evaluate, automate
b. streamline, evaluate, standardize, automate
c. evaluate, automate, streamline, standardize
d. standardize, evaluate, automate, streamline
4. Two primary characteristics used to evaluate documentation are __________ and __________.
5. Discuss some of the drawbacks of automating a process before it has been streamlined.