
CHAPTER 9
INVENTORIES
After completing this chapter, you will be able to do the following:
- Distinguish between costs included in inventories and costs recognized as expenses in the period in which they are incurred.
- Describe different inventory valuation methods (cost formulas).
- Calculate and compare cost of sales, gross profit, and ending inventory using different inventory valuation methods and using periodic and perpetual inventory systems.
- Calculate and explain effects of inflation and deflation of inventory costs on the financial statements and ratios of companies that use different inventory valuation methods (cost formulas or cost flow assumptions).
- Explain LIFO reserve and LIFO liquidation and their effects on financial statements and ratios.
- Convert a company’s reported financial statements from LIFO to FIFO for purposes of comparison.
- Describe implications of valuing inventory at net realizable value for financial statements and ratios.
- Describe the financial statement presentation of and disclosures relating to inventories.
- Explain issues that analysts should consider when examining a company’s inventory disclosures and other sources of information.
- Analyze and compare the financial statements and ratios of companies, including those that use different inventory valuation methods.
Merchandising and manufacturing companies generate revenues and profits through the sale of inventory. Further, inventory may represent a significant asset on these companies’ balance sheets. Merchandisers (wholesalers and retailers) purchase inventory, ready for sale, from manufacturers and thus account for only one type of inventory—finished goods inventory. Manufacturers, however, purchase raw materials from suppliers and then add value by transforming the raw materials into finished goods. They typically classify inventory into three different categories:1 raw materials, work in progress,2 and finished goods. Work-in-progress inventories have started the conversion process from raw materials but are not yet finished goods ready for sale. Manufacturers may report either the separate carrying amounts of their raw materials, work-in-progress, and finished goods inventories on the balance sheet or simply the total inventory amount. If the latter approach is used, the company must then disclose the carrying amounts of its raw materials, work-in-progress, and finished goods inventories in a footnote to the financial statements.
Inventories and cost of sales (cost of goods sold)3 are significant items in the financial statements of many companies. Comparing the performance of these companies is challenging because of the allowable choices for valuing inventories: Differences in the choice of inventory valuation method can result in significantly different amounts being assigned to inventory and cost of sales. Financial statement analysis would be much easier if all companies used the same inventory valuation method or if inventory price levels remained constant over time. If there was no inflation or deflation with respect to inventory costs and thus unit costs were unchanged, the choice of inventory valuation method would be irrelevant. However, inventory price levels typically do change over time.
International Financial Reporting Standards (IFRS) permit the assignment of inventory costs (costs of goods available for sale) to inventories and cost of sales by three cost formulas: specific identification, first-in, first-out (FIFO), and weighted average cost.4 U.S. generally accepted accounting principles (U.S. GAAP) allow the same three inventory valuation methods, referred to as cost flow assumptions in U.S. GAAP, but also include a fourth method called last-in, first-out (LIFO).5 The choice of inventory valuation method affects the allocation of the cost of goods available for sale to ending inventory and cost of sales. Analysts must understand the various inventory valuation methods and the related impact on financial statements and financial ratios in order to evaluate a company’s performance over time and relative to industry peers. The company’s financial statements and related notes provide important information that the analyst can use in assessing the impact of the choice of inventory valuation method on financial statements and financial ratios.
This reading is organized as follows: Section 2 discusses the costs that are included in inventory and the costs that are recognized as expenses in the period in which they are incurred. Section 3 describes inventory valuation methods and compares the measurement of ending inventory, cost of sales and gross profit under each method, and when using periodic versus perpetual inventory systems. Section 4 describes the LIFO method, LIFO reserve, and effects of LIFO liquidations, and demonstrates the adjustments required to compare a company that uses LIFO with one that uses FIFO. Section 5 describes the financial statement effects of a change in inventory valuation method. Section 6 discusses the measurement and reporting of inventory when its value changes. Section 7 describes the presentation of inventories on the financial statements and related disclosures, discusses inventory ratios and their interpretation, and shows examples of financial analysis with respect to inventories. A summary and practice problems conclude the reading.
Under IFRS, the costs to include in inventories are “all costs of purchase, costs of conversion, and other costs incurred in bringing the inventories to their present location and condition.”6 The costs of purchase include the purchase price, import and tax-related duties, transport, insurance during transport, handling, and other costs directly attributable to the acquisition of finished goods, materials, and services. Trade discounts, rebates, and similar items reduce the price paid and the costs of purchase. The costs of conversion include costs directly related to the units produced, such as direct labor, and fixed and variable overhead costs.7 Including these product-related costs in inventory (i.e., as an asset) means that they will not be recognized as an expense (i.e., as cost of sales) on the income statement until the inventory is sold. U.S. GAAP provide a similar description of the costs to be included in inventory.8
Both IFRS and U.S. GAAP exclude the following costs from inventory: abnormal costs incurred as a result of waste of materials, labor or other production conversion inputs, any storage costs (unless required as part of the production process), and all administrative overhead and selling costs. These excluded costs are treated as expenses and recognized on the income statement in the period in which they are incurred. Including costs in inventory defers their recognition as an expense on the income statement until the inventory is sold. Therefore, including costs in inventory that should be expensed will overstate profitability on the income statement (because of the inappropriate deferral of cost recognition) and create an overstated inventory value on the balance sheet.
EXAMPLE 9-1 Treatment of Inventory-Related Costs
Acme Enterprises, a hypothetical company that prepares its financial statements in accordance with IFRS, manufactures tables. In 2009, the factory produced 900,000 finished tables and scrapped 1,000 tables. For the finished tables, raw material costs were €9 million, direct labor conversion costs were €18 million, and production overhead costs were €1.8 million. The 1,000 scrapped tables (attributable to abnormal waste) had a total production cost of €30,000 (€10,000 raw material costs and €20,000 conversion costs; these costs are not included in the €9 million raw material and €19.8 million total conversion costs of the finished tables). During the year, Acme spent €1 million for freight delivery charges on raw materials and €500,000 for storing finished goods inventory. Acme does not have any work-in-progress inventory at the end of the year.
1. What costs should be included in inventory in 2009?
2. What costs should be expensed in 2009?
Solution to 1: Total inventory costs for 2009 are as follows:
| Raw materials | €9,000,000 |
| Direct labor | 18,000,000 |
| Production overhead | 1,800,000 |
| Transportation for raw materials | 1,000,000 |
| Total inventory costs | €29,800,000 |
Solution to 2: Total costs that should be expensed (not included in inventory) are as follows:
| Abnormal waste | €30,000 |
| Storage of finished goods inventory | 500,000 |
| Total | €530,000 |
3. INVENTORY VALUATION METHODS
Generally, inventory purchase costs and manufacturing conversion costs change over time. As a result, the allocation of total inventory costs (i.e., cost of goods available for sale) between cost of sales on the income statement and inventory on the balance sheet will vary depending on the inventory valuation method used by the company. As mentioned in the introduction, inventory valuation methods are referred to as cost formulas and cost flow assumptions under IFRS and U.S. GAAP, respectively. If the choice of method results in more cost being allocated to cost of sales and less cost being allocated to inventory than would be the case with other methods, the chosen method will cause, in the current year, reported gross profit, net income, and inventory carrying amount to be lower than if alternative methods had been used. Accounting for inventory, and consequently the allocation of costs, thus has a direct impact on financial statements and their comparability.
Both IFRS and U.S. GAAP allow companies to use the following inventory valuation methods: specific identification; first-in, first-out (FIFO); and weighted average cost. U.S. GAAP allow companies to use an additional method: last-in, first-out (LIFO). A company must use the same inventory valuation method for all items that have a similar nature and use. For items with a different nature or use, a different inventory valuation method can be used.9 When items are sold, the carrying amount of the inventory is recognized as an expense (cost of sales) according to the cost formula (cost flow assumption) in use.
Specific identification is used for inventory items that are not ordinarily interchangeable, whereas FIFO, weighted average cost, and LIFO are typically used when there are large numbers of interchangeable items in inventory. Specific identification matches the actual historical costs of the specific inventory items to their physical flow; the costs remain in inventory until the actual identifiable inventory is sold. FIFO, weighted average cost, and LIFO are based on cost flow assumptions. Under these methods, companies must make certain assumptions about which goods are sold and which goods remain in ending inventory. As a result, the allocation of costs to the units sold and to the units in ending inventory can be different from the physical movement of the items.
The choice of inventory valuation method would be largely irrelevant if inventory costs remained constant or relatively constant over time. Given relatively constant prices, the allocation of costs between cost of goods sold and ending inventory would be very similar under each of the four methods. Given changing price levels, however, the choice of inventory valuation method can have a significant impact on the amount of reported cost of sales and inventory. And the reported cost of sales and inventory balances affect other items, such as gross profit, net income, current assets, and total assets.
3.1. Specific Identification
The specific identification method is used for inventory items that are not ordinarily interchangeable and for goods that have been produced and segregated for specific projects. This method is also commonly used for expensive goods that are uniquely identifiable, such as precious gemstones. Under this method, the cost of sales and the cost of ending inventory reflect the actual costs incurred to purchase (or manufacture) the items specifically identified as sold and the items specifically identified as remaining in inventory. Therefore, this method matches the physical flow of the specific items sold and remaining in inventory to their actual cost.
3.2. First-In, First-Out (FIFO)
FIFO assumes that the oldest goods purchased (or manufactured) are sold first and the newest goods purchased (or manufactured) remain in ending inventory. In other words, the first units included in inventory are assumed to be the first units sold from inventory. Therefore, cost of sales reflects the cost of goods in beginning inventory plus the cost of items purchased (or manufactured) earliest in the accounting period, and the value of ending inventory reflects the costs of goods purchased (or manufactured) more recently. In periods of rising prices, the costs assigned to the units in ending inventory are higher than the costs assigned to the units sold. Conversely, in periods of declining prices, the costs assigned to the units in ending inventory are lower than the costs assigned to the units sold.
3.3. Weighted Average Cost
Weighted average cost assigns the average cost of the goods available for sale (beginning inventory plus purchase, conversion, and other costs) during the accounting period to the units that are sold as well as to the units in ending inventory. In an accounting period, the weighted average cost per unit is calculated as the total cost of the units available for sale divided by the total number of units available for sale in the period (Total cost of goods available for sale/Total units available for sale).
3.4. Last-In, First-Out (LIFO)
LIFO is permitted only under U.S. GAAP. This method assumes that the newest goods purchased (or manufactured) are sold first and the oldest goods purchased (or manufactured), including beginning inventory, remain in ending inventory. In other words, the last units included in inventory are assumed to be the first units sold from inventory. Therefore, cost of sales reflects the cost of goods purchased (or manufactured) more recently, and the value of ending inventory reflects the cost of older goods. In periods of rising prices, the costs assigned to the units in ending inventory are lower than the costs assigned to the units sold. Conversely, in periods of declining prices, the costs assigned to the units in ending inventory are higher than the costs assigned to the units sold.
3.5. Calculation of Cost of Sales, Gross Profit, and Ending Inventory
In periods of changing prices, the allocation of total inventory costs (i.e., cost of goods available for sale) between cost of sales on the income statement and inventory on the balance sheet will vary depending on the inventory valuation method used by the company. The following example illustrates how cost of sales, gross profit, and ending inventory differ based on the choice of inventory valuation method.
EXAMPLE 9-2 Inventory Cost Flow Illustration for the Specific Identification, Weighted Average Cost, FIFO, and LIFO Methods
Global Sales, Inc. (GSI) is a hypothetical distributor of consumer products, including bars of violet essence soap. The soap is sold by the kilogram. GSI began operations in 2009, during which it purchased and received initially 100,000 kg of soap at 110 yuan/kg, then 200,000 kg of soap at 100 yuan/kg, and finally 300,000 kg of soap at 90 yuan/kg. GSI sold 520,000 kg of soap at 240 yuan/kg. GSI stores its soap in its warehouse so that soap from each shipment received is readily identifiable. During 2009, the entire 100,000 kg from the first shipment received, 180,000 kg of the second shipment received, and 240,000 kg of the final shipment received was sent to customers. Answers to the following questions should be rounded to the nearest 1,000 yuan.
1. What are the reported cost of sales, gross profit, and ending inventory balances for 2009 under the specific identification method?
2. What are the reported cost of sales, gross profit, and ending inventory balances for 2009 under the weighted average cost method?
3. What are the reported cost of sales, gross profit, and ending inventory balances for 2009 under the FIFO method?
4. What are the reported cost of sales, gross profit, and ending inventory balances for 2009 under the LIFO method?
Solution to 1: Under the specific identification method, the physical flow of the specific inventory items sold is matched to their actual cost.
Sales = 520,000 × 240 = 124,800,000 yuan
Cost of sales = (100,000 × 110)+(180,000 × 100)+(240,000 × 90) = 50,600,000 yuan
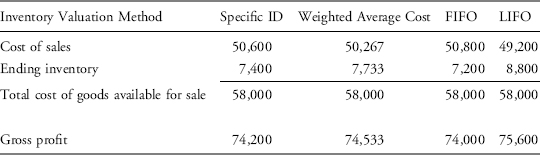
Gross profit = 124,800,000 − 50,600,000 = 74,200,000 yuan
Ending inventory = (20,000 × 100)+(60,000 × 90) = 7,400,000 yuan
Note that in spite of the segregation of inventory within the warehouse, it would be inappropriate to use specific identification for this inventory of interchangeable items. The use of specific identification could potentially result in earnings manipulation through the shipment decision.
Solution to 2: Under the weighted average cost method, costs are allocated to cost of sales and ending inventory by using a weighted average mix of the actual costs incurred for all inventory items. The weighted average cost per unit is determined by dividing the total cost of goods available for sale by the number of units available for sale.
Weighted average cost = [(100,000 × 110)+(200,000 × 100)+(300,000 × 90)]/600,000 = 96.667 yuan/kg
Sales = 520,000 × 240 = 124,800,000 yuan
Cost of sales = 520,000 × 96.667 = 50,267,000 yuan
Gross profit = 124,800,000 − 50,267,000 = 74,533,000 yuan
Ending inventory = 80,000 × 96.667 = 7,733,000 yuan
Solution to 3: Under the FIFO method, the oldest inventory units acquired are assumed to be the first units sold. Ending inventory, therefore, is assumed to consist of those inventory units most recently acquired.
Sales = 520,000 × 240 = 124,800,000 yuan
Cost of sales = (100,000 × 110)+(200,000 × 100)+(220,000 × 90) = 50,800,000 yuan
Gross profit = 124,800,000 − 50,800,000 = 74,000,000 yuan
Ending inventory = 80,000 × 90 = 7,200,000 yuan
Solution to 4: Under the LIFO method, the newest inventory units acquired are assumed to be the first units sold. Ending inventory, therefore, is assumed to consist of the oldest inventory units.
Sales = 520,000 × 240 = 124,800,000 yuan
Cost of sales = (20,000 × 110)+(200,000 × 100)+(300,000 × 90) = 49,200,000 yuan
Gross profit = 124,800,000 − 49,200,000 = 75,600,000 yuan
Ending inventory = 80,000 × 110 = 8,800,000 yuan
The following table (in thousands of yuan) summarizes the cost of sales, the ending inventory, and the cost of goods available for sale that were calculated for each of the four inventory valuation methods. Note that in the first year of operation, the total cost of goods available for sale is the same under all four methods. Subsequently, the cost of goods available for sale will typically differ because beginning inventories will differ. Also shown is the gross profit figure for each of the four methods. Because the cost of a kg of soap declined over the period, LIFO had the highest ending inventory amount, the lowest cost of sales, and the highest gross profit. FIFO had the lowest ending inventory amount, the highest cost of sales, and the lowest gross profit.
3.6. Periodic versus Perpetual Inventory Systems
Companies typically record changes to inventory using either a periodic inventory system or a perpetual inventory system. Under a periodic inventory system, inventory values and costs of sales are determined at the end of an accounting period. Purchases are recorded in a purchases account. The total of purchases and beginning inventory is the amount of goods available for sale during the period. The ending inventory amount is subtracted from the goods available for sale to arrive at the cost of sales. The quantity of goods in ending inventory is usually obtained or verified through a physical count of the units in inventory. Under a perpetual inventory system, inventory values and cost of sales are continuously updated to reflect purchases and sales.
Under either system, the allocation of goods available for sale to cost of sales and ending inventory is the same if the inventory valuation method used is either specific identification or FIFO. This is not generally true for the weighted average cost method. Under a periodic inventory system, the amount of cost of goods available for sale allocated to cost of sales and ending inventory may be quite different using the FIFO method compared to the weighted average cost method. Under a perpetual inventory system, inventory values and cost of sales are continuously updated to reflect purchases and sales. As a result, the amount of cost of goods available for sale allocated to cost of sales and ending inventory is similar under the FIFO and weighted average cost methods. Because of lack of disclosure and the dominance of perpetual inventory systems, analysts typically do not make adjustments when comparing a company using the weighted average cost method with a company using the FIFO method.
Using the LIFO method, the periodic and perpetual inventory systems will generally result in different allocations to cost of sales and ending inventory. Under either a perpetual or periodic inventory system, the use of the LIFO method will generally result in significantly different allocations to cost of sales and ending inventory compared to other inventory valuation methods. When inventory costs are increasing and inventory unit levels are stable or increasing, using the LIFO method will result in higher cost of sales and lower inventory carrying amounts than using the FIFO method. The higher cost of sales under LIFO will result in lower gross profit, operating income, income before taxes, and net income. Income tax expense will be lower under LIFO, causing the company’s net operating cash flow to be higher. On the balance sheet, the lower inventory carrying amount will result in lower reported current assets, working capital, and total assets. Analysts must carefully assess the financial statement implications of the choice of inventory valuation method when comparing companies that use the LIFO method with companies that use the FIFO method.
Example 9-3 illustrates the impact of the choice of system under LIFO.
EXAMPLE 9-3 Perpetual versus Periodic Inventory Systems
If GSI (the company in Example 9-2) had used a perpetual inventory system, the timing of purchases and sales would affect the amounts of cost of sales and inventory. Following is a record of the purchases, sales, and quantity of inventory on hand after the transaction in 2009.
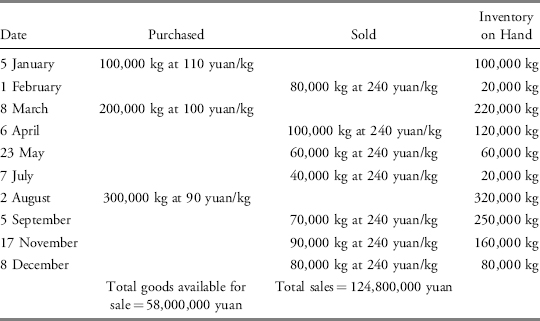
The amounts for total goods available for sale and sales are the same under either the perpetual or periodic system in this first year of operation. The carrying amount of the ending inventory, however, may differ because the perpetual system will apply LIFO continuously throughout the year. Under the periodic system, it was assumed that the ending inventory was composed of 80,000 units of the oldest inventory, which cost 110 yuan/kg.
What are the ending inventory, cost of sales, and gross profit amounts using the perpetual system and the LIFO method? How do these compare with the amounts using the periodic system and the LIFO method, as in Example 9-2?
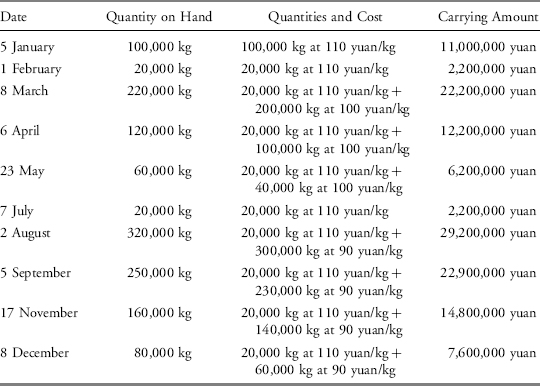
Solution: The carrying amounts of the inventory at the different time points using the perpetual inventory system are as follows:
Perpetual system
Sales = 520,000 × 240 = 124,800,000 yuan
Cost of sales = 58,000,000 − 7,600,000 = 50,400,000 yuan
Gross profit = 124,800,000 − 50,400,000 = 74,400,000 yuan
Ending inventory = 7,600,000 yuan
Periodic system from Example 9-2
Sales = 520,000 × 240 = 124,800,000 yuan
Cost of sales = (20,000 × 110)+(200,000 × 100)+(300,000 × 90) = 49,200,000 yuan
Gross profit = 124,800,000 − 49,200,000 = 75,600,000 yuan
Ending inventory = 80,000 × 110 = 8,800,000 yuan
In this example, the ending inventory amount is lower under the perpetual system because only 20,000 kg of the oldest inventory with the highest cost is assumed to remain in inventory. The cost of sales is higher and the gross profit is lower under the perpetual system compared to the periodic system.
3.7. Comparison of Inventory Valuation Methods
As shown in Example 9-2, the allocation of the total cost of goods available for sale to cost of sales on the income statement and to ending inventory on the balance sheet varies under the different inventory valuation methods. In an environment of declining inventory unit costs and constant or increasing inventory quantities, FIFO (in comparison with weighted average cost or LIFO) will allocate a higher amount of the total cost of goods available for sale to cost of sales on the income statement and a lower amount to ending inventory on the balance sheet. Accordingly, because cost of sales will be higher under FIFO, a company’s gross profit, operating profit, and income before taxes will be lower.
Conversely, in an environment of rising inventory unit costs and constant or increasing inventory quantities, FIFO (in comparison with weighted average cost or LIFO) will allocate a lower amount of the total cost of goods available for sale to cost of sales on the income statement and a higher amount to ending inventory on the balance sheet. Accordingly, because cost of sales will be lower under FIFO, a company’s gross profit, operating profit, and income before taxes will be higher.
The carrying amount of inventories under FIFO will more closely reflect current replacement values because inventories are assumed to consist of the most recently purchased items. The cost of sales under LIFO will more closely reflect current replacement value. LIFO ending inventory amounts are typically not reflective of current replacement value because the ending inventory is assumed to be the oldest inventory and costs are allocated accordingly. Example 9-4 illustrates the different results obtained by using either the FIFO or LIFO methods to account for inventory.
EXAMPLE 9-4 Impact of Inflation Using LIFO Compared to FIFO
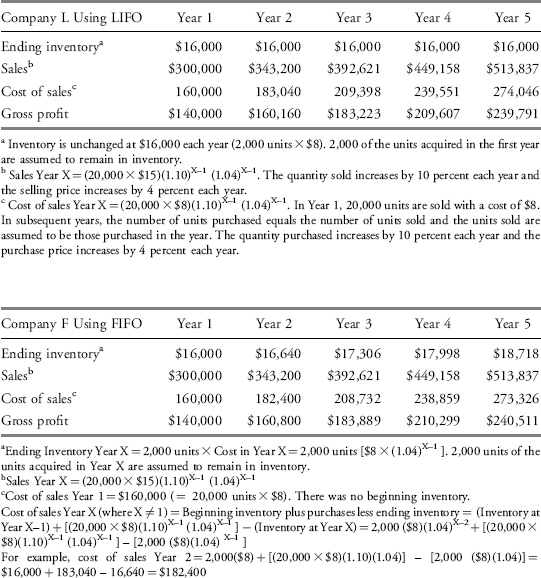
Company L and Company F are identical in all respects except that Company L uses the LIFO method and Company F uses the FIFO method. Each company has been in business for five years and maintains a base inventory of 2,000 units each year. Each year, except the first year, the number of units purchased equaled the number of units sold. Over the five year period, unit sales increased 10 percent each year and the unit purchase and selling prices increased at the beginning of each year to reflect inflation of 4 percent per year. In the first year, 20,000 units were sold at a price of $15.00 per unit and the unit purchase price was $8.00.
1. What was the end of year inventory, sales, cost of sales, and gross profit for each company for each of the five years?
2. Compare the inventory turnover ratios (based on ending inventory carrying amounts) and gross profit margins over the five year period and between companies.
Note that if the company sold more units than it purchased in a year, inventory would decrease. This is referred to as LIFO liquidation. The cost of sales of the units sold in excess of those purchased would reflect the inventory carrying amount. In this example, each unit sold in excess of those purchased would have a cost of sales of $8 and a higher gross profit.
Solution 1:
Solution to 2:
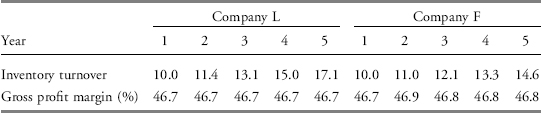
Inventory turnover ratio = Cost of sales ÷ Ending inventory. The inventory turnover ratio increased each year for both companies because the units sold increased, whereas the units in ending inventory remained unchanged. The increase in the inventory turnover ratio is higher for Company L because Company L’s cost of sales is increasing for inflation but the inventory carrying amount is unaffected by inflation. It might appear that a company using the LIFO method manages its inventory more effectively, but this is deceptive. Both companies have identical quantities and prices of purchases and sales and only differ in the inventory valuation method used.
Gross profit margin = Gross profit ÷ Sales. The gross profit margin is stable under LIFO because both sales and cost of sales increase at the same rate of inflation. The gross profit margin is slightly higher under the FIFO method after the first year because a proportion of the cost of sales reflects an older purchase price.
In the United States, the LIFO method is widely used (approximately 36 percent of U.S. companies use the LIFO method). The potential income tax savings are a benefit of using the LIFO method when inventory costs are increasing. The higher cash flows due to lower income taxes may make the company more valuable because the value of a company is based on the present value of its future cash flows. Under the “LIFO conformity rule,” the U.S. tax code requires that companies using the LIFO method for tax purposes must also use the LIFO method for financial reporting. Under the LIFO method, ending inventory is assumed to consist of those units that have been held the longest. This generally results in ending inventories with carrying amounts lower than current replacement costs because inventory costs typically increase over time. Cost of sales will more closely reflect current replacement costs.
If the purchase prices (purchase costs) or production costs of inventory are increasing, the income statement consequences of using the LIFO method compared to other methods will include higher cost of sales, and lower gross profit, operating profit, income tax expense, and net income. The balance sheet consequences include lower ending inventory, working capital, total assets, retained earnings, and shareholders’ equity. The lower income tax paid will result in higher net cash flow from operating activities. Some of the financial ratio effects are a lower current ratio, higher debt-to-equity ratios, and lower profitability ratios.
If the purchase prices or production costs of inventory are decreasing, it is unlikely that a company will use the LIFO method for tax purposes (and therefore for financial reporting purposes due to the LIFO conformity rule) because this will result in lower cost of sales, and higher taxable income and income taxes. However, if the company had elected to use the LIFO method and cannot justify changing the inventory valuation method for tax and financial reporting purposes when inventory costs begin to decrease, the income statement, balance sheet, and ratio effects will be opposite to the effects during a period of increasing costs.
The U.S. Securities Exchange Commission (SEC) has proposed the full adoption of IFRS by all U.S. reporting companies beginning in 2014. An important consequence of this proposal would be the complete elimination of the LIFO inventory method for financial reporting and, due to the LIFO conformity rule, tax reporting by U.S. companies. As a consequence of the restatement of financial statements to the FIFO or weighted average cost method, significant immediate income tax liabilities may arise in the year of transition from the LIFO method to either the FIFO or weighted average cost method.
4.1. LIFO Reserve
For companies using the LIFO method, U.S. GAAP requires disclosure, in the notes to the financial statements or on the balance sheet, of the amount of the LIFO reserve. The LIFO reserve is the difference between the reported LIFO inventory carrying amount and the inventory amount that would have been reported if the FIFO method had been used (in other words, the FIFO inventory value less the LIFO inventory value). The disclosure provides the information that analysts need to adjust a company’s cost of sales (cost of goods sold) and ending inventory balance based on the LIFO method, to the FIFO method.
To compare companies using LIFO with companies not using LIFO, inventory is adjusted by adding the disclosed LIFO reserve to the inventory balance that is reported on the balance sheet. The reported inventory balance, using LIFO, plus the LIFO reserve equals the inventory that would have been reported under FIFO. Cost of sales is adjusted by subtracting the increase in the LIFO reserve during the period from the cost of sales amount that is reported on the income statement. If the LIFO reserve has declined during the period,10 the decrease in the reserve is added to the cost of sales amount that is reported on the income statement. The LIFO reserve disclosure can be used to adjust the financial statements of a U.S. company using the LIFO method to make them comparable with a similar company using the FIFO method.
EXAMPLE 9-5 Inventory Conversion from LIFO to FIFO
Caterpillar Inc. (NYSE: CAT), based in Peoria, Illinois, USA, is the largest maker of construction and mining equipment, diesel and natural gas engines, and industrial gas turbines in the world. Excerpts from CAT’s consolidated financial statements are shown in Exhibits 9-1 and 9-2; notes pertaining to CAT’s inventories are presented in Exhibit 9-3. Assume tax rates of 20 percent for 2008 and 30 percent for earlier years. The assumed tax rates are based on the provision for taxes as a percentage of consolidated profits before taxes rather than the U.S. corporate statutory tax rate of 35 percent.
EXHIBIT 9-1 Caterpillar Inc. Consolidated Results of Operation (US$ millions)
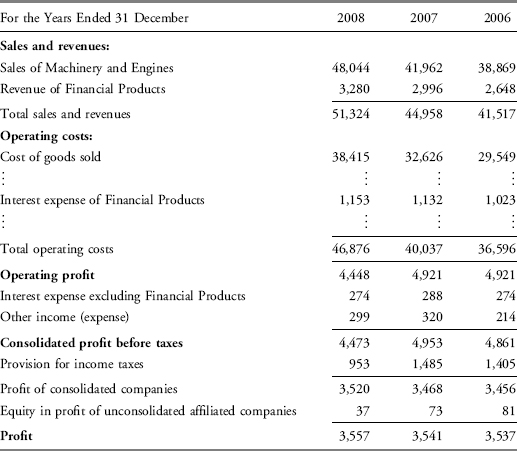
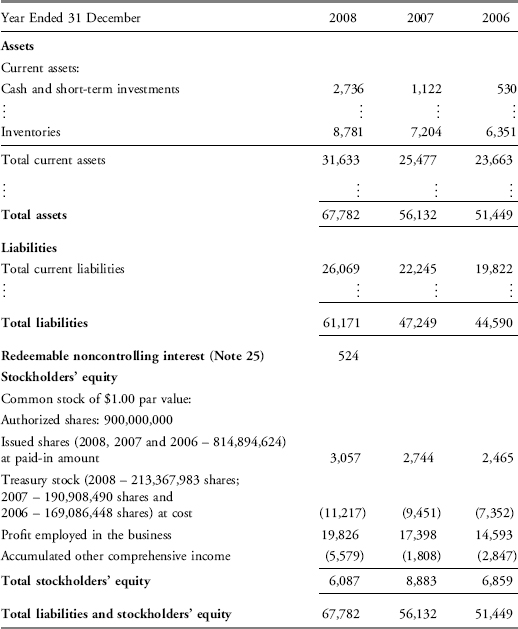
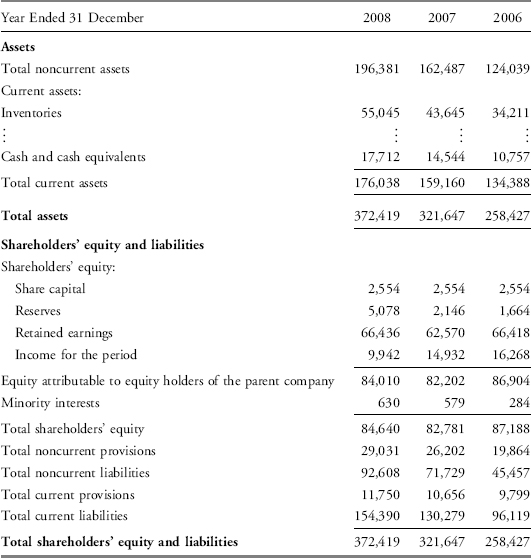
EXHIBIT 9-2 Caterpillar Inc. Consolidated Financial Position (US$ millions)
1. What inventory values would CAT report for 2008, 2007, and 2006 if it had used the FIFO method instead of the LIFO method?
2. What amount would CAT’s cost of goods sold for 2008 and 2007 be if it had used the FIFO method instead of the LIFO method?
3. What net income (profit) would CAT report for 2008 and 2007 if it had used the FIFO method instead of the LIFO method?
4. By what amount would CAT’s 2008 and 2007 net cash flow from operating activities decline if CAT used the FIFO method instead of the LIFO method?
5. What is the cumulative amount of income tax savings that CAT has generated through 2008 by using the LIFO method instead of the FIFO method?
6. What amount would be added to CAT’s retained earnings (profit employed in the business) at 31 December 2008 if CAT had used the FIFO method instead of the LIFO method?
7. What would be the change in Cat’s cash balance if CAT had used the FIFO method instead of the LIFO method?
8. Calculate and compare the following for 2008 under the LIFO method and the FIFO method: inventory turnover ratio, days of inventory on hand, gross profit margin, net profit margin, return on assets, current ratio, and total liabilities-to-equity ratio.
EXHIBIT 9-3 Caterpillar Inc. Selected Notes to Consolidated Financial Statements
Note 1. Operations and Summary of Significant Accounting Policies
D. Inventories
Inventories are stated at the lower of cost or market. Cost is principally determined using the last-in, first-out (LIFO) method. The value of inventories on the LIFO basis represented about 70% of total inventories at December 31, 2008 and about 75% of total inventories at December 31, 2007 and 2006.
If the FIFO (first-in, first-out) method had been in use, inventories would have been $3,183 million, $2,617 million and $2,403 million higher than reported at December 31, 2008, 2007, and 2006, respectively.
Note 9. Inventories
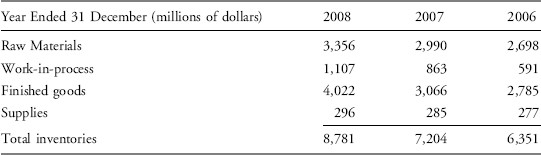
We had long-term material purchase obligations of approximately $363 million at December 31, 2008.
Solution to 1:

Solution to 2:
| 31 December (millions of dollars) | 2008 | 2007 |
| Cost of goods sold (LIFO method) | 38,415 | 32,626 |
| Less: Increase in LIFO reserve* | −566 | −214 |
| Cost of goods sold (FIFO method) | 37,849 | 32,412 |
*From Note 1.D, the increase in LIFO reserve for 2008 is 566 (3,183 − 2,617) and for 2007 is 214 (2,617 − 2,403).
Solution to 3:
| 31 December (millions of dollars) | 2008 | 2007 |
| Net income (LIFO method) | 3,557 | 3,541 |
| Reduction in cost of goods sold (increase in operating profit) | 566 | 214 |
| Taxes on increased operating profit* | *113 | *64 |
| Net income (FIFO method) | 4,010 | 3,691 |
*The taxes on the increased operating profit are assumed to be 113 (566 × 20%) for 2008 and 64 (214 × 30%) for 2007.
Solution to 4: The effect on a company’s net cash flow from operating activities is limited to the impact of the change on income taxes paid; changes in allocating inventory costs to ending inventory and cost of goods sold does not change any cash flows except income taxes. Consequently, the effect of using FIFO on CAT’s net operating cash flow from operating activities would be a decline of $113 million in 2008 and a decline of $64 million in 2007. These are the approximate incremental increases in income taxes that CAT would have incurred if the FIFO method were used instead of the LIFO method (see earlier solution to 3).
Solution to 5: Assuming tax rates of 20 percent for 2008 and 30 percent for earlier years, the cumulative amount of income tax savings that CAT has generated by using the LIFO method instead of FIFO is approximately $898 million (566 × 20%+2,617 × 30%). Note 1.D indicates a LIFO reserve of $2,617 million at the end of 2007 and an increase in the LIFO reserve of $566 million in 2008. Therefore, under the FIFO method, cumulative gross profits would have been $2,617 million higher as of the end of 2007 and an additional $566 million higher as of the end of 2008. The estimated tax savings would be higher (lower) if income tax rates were assumed to be higher (lower).
Solution to 6: The amount that would be added to CAT’s retained earnings is $2,285 million (3,183 − 898) or (566 × 80%+2,617 × 70%). This represents the cumulative increase in operating profit due to the decrease in cost of goods sold (LIFO reserve of $3,183 million) less the assumed taxes on that profit ($898 million, see solution to 5). Some analysts advocate ignoring the tax consequences and suggest simply adjusting inventory and equity by the same amount. They argue that the reported equity of the firm is understated by the difference between the current value of its inventory (approximated by the value under FIFO) and its carrying value (value under LIFO).
Solution to 7: Under the FIFO method, an additional $898 million is assumed to have been incurred for tax expenses. If CAT switched to FIFO, it would have an additional tax liability of $898 million as a consequence of the restatement of financial statements to the FIFO method. This illustrates the significant immediate income tax liabilities that may arise in the year of transition from the LIFO method to the FIFO method. If CAT switched to FIFO for tax purposes, there would be a cash outflow for the additional taxes. However, because the company is not actually converting at this point for either tax or reporting purposes, it is appropriate to reflect a deferred tax liability rather than a reduction in cash. In this case for analysis purposes, under FIFO, inventory would increase by $3,153 million, equity by $2,285 million, and noncurrent liabilities by $898 million.
Solution to 8: CAT’s ratios for 2008 under the LIFO and FIFO methods are as follows:
| LIFO | FIFO | |
| Inventory turnover | 4.81 | 3.47 |
| Days of inventory on hand | 76.1 days | 105.5 days |
| Gross profit margin | 20.04% | 21.22% |
| Net profit margin | 6.93% | 7.81% |
| Return on assets | 5.74% | 6.18% |
| Current ratio | 1.21 | 1.34 |
| Total liabilities-to-equity ratio | 10.05 | 7.41 |
Inventory turnover ratio = Cost of goods sold ÷ Average inventory
LIFO = 4.81 = 38,415 ÷ [(8,781+7,204) ÷ 2]
FIFO = 3.47 = 37,849 ÷ [(11,964+9,821) ÷ 2]
The ratio is higher under LIFO because, given rising inventory costs, cost of goods sold will be higher and inventory carrying amounts will be lower under LIFO. If an analyst made no adjustment for the difference in inventory methods, it might appear that a company using the LIFO method manages its inventory more effectively.
Days of inventory on hand = Number of days in period÷Inventory turnover ratio
LIFO = 76.1 days = (366 days* ÷ 4.81)
FIFO = 105.5 days = (366 days ÷ 3.47)
*2008 was a leap year.
Without adjustment, a company using the LIFO method might appear to manage its inventory more effectively. This is primarily the result of the lower inventory carrying amounts under LIFO.
Gross profit margin = Gross profit ÷ Total revenue
LIFO = 20.04 percent = [(48,044 − 38,415) ÷ 48,044]
FIFO = 21.22 percent = [(48,044 − 37,849) ÷ 48,044]
Revenue of financial products is excluded from the calculation of gross profit. Gross profit is sales of machinery and engines less cost of goods sold. The gross profit margin is lower under LIFO because the cost of goods sold is higher given rising inventory costs.
Net profit margin = Net income ÷ Total revenue
LIFO = 6.93 percent = (3,557 ÷ 51,324)
FIFO = 7.81 percent = (4,010 ÷ 51,324)
The net profit margin is lower under LIFO because the cost of goods sold is higher. The absolute percentage difference is less than that of the gross profit margin because of income taxes on the increased income reported under FIFO and because net income is divided by total revenue including sales of machinery and engines and revenue of financial products. The company appears to be less profitable under LIFO.
Return on assets = Net income ÷ Average total assets
LIFO = 5.74 percent = 3,557 ÷ [(67,782+56,132) ÷ 2]
FIFO = 6.18 percent = 4,010 ÷ [(67,782+3,183)+(56,132+2,617) ÷ 2]
The total assets under FIFO are the LIFO total assets increased by the LIFO reserve. The return on assets is lower under LIFO because the lower net income due to the higher cost of goods sold has a greater impact on the ratio than the lower total assets, which are the result of lower inventory carrying amounts. The company appears to be less profitable under LIFO.
Current ratio = Current assets ÷ Current liabilities
LIFO = 1.21 = (31,633 ÷ 26,069)
FIFO = 1.34 = [(31,633+3,183) ÷ 26,069]
The current ratio is lower under LIFO primarily because of lower inventory carrying amount. The company appears to be less liquid under LIFO.
Total liabilities-to-equity ratio = Total liabilities ÷ Total shareholders’ equity
LIFO = 10.05 = (61,171 ÷ 6,087)
FIFO = 7.41 = [(61,171 +898) ÷ (6,087+2,285)]
The ratio is higher under LIFO because the addition to retained earnings under FIFO reduces the ratio. The company appears to be more highly leveraged under LIFO.
In summary, the company appears to be less profitable, less liquid, and more highly leveraged under LIFO. Yet, because a company’s value is based on the present value of future cash flows, LIFO will increase the company’s value because the cash flows are higher in earlier years due to lower taxes. LIFO is primarily used for the tax benefits it provides.
4.2. LIFO Liquidations
In periods of rising inventory unit costs, the carrying amount of inventory under FIFO will always exceed the carrying amount of inventory under LIFO. The LIFO reserve may increase over time as the result of the increasing difference between the older costs used to value inventory under LIFO and the more recent costs used to value inventory under FIFO. Also, when the number of inventory units manufactured or purchased exceeds the number of units sold, the LIFO reserve may increase as the result of the addition of new LIFO layers (the quantity of inventory units is increasing and each increase in quantity creates a new LIFO layer).
When the number of units sold exceeds the number of units purchased or manufactured, the number of units in ending inventory is lower than the number of units in beginning inventory and a company using LIFO will experience a LIFO liquidation (some of the older units held in inventory are assumed to have been sold). If inventory unit costs have been rising from period to period and LIFO liquidation occurs, this will produce an inventory-related increase in gross profits. The increase in gross profits occurs because of the lower inventory carrying amounts of the liquidated units. The lower inventory carrying amounts are used for cost of sales and the sales are at the current prices. The gross profit on these units is higher than the gross profit that would be recognized using more current costs. These inventory profits caused by a LIFO liquidation, however, are one-time events and are not sustainable.
LIFO liquidations can occur for a variety of reasons. The reduction in inventory levels may be outside of management’s control; for example, labor strikes at a supplier may force a company to reduce inventory levels to meet customer demands. In periods of economic recession or when customer demand is declining, a company may choose to reduce existing inventory levels rather than invest in new inventory. Analysts should be aware that management can potentially manipulate and inflate their company’s reported gross profits and net income at critical times by intentionally reducing inventory quantities and liquidating older layers of LIFO inventory (selling some units of beginning inventory). During economic downturns, LIFO liquidation may result in higher gross profit than would otherwise be realized. If LIFO layers of inventory are temporarily depleted and not replaced by fiscal year-end, LIFO liquidation will occur resulting in unsustainable higher gross profits. Therefore, it is imperative to review the LIFO reserve footnote disclosures to determine if LIFO liquidation has occurred. A decline in the LIFO reserve from the prior period may be indicative of LIFO liquidation.
EXAMPLE 9-6 LIFO Liquidation: Financial Statement Impact and Disclosure
The following excerpts are from the 2007 10-K of Sturm Ruger & Co., Inc. (NYSE:RGR):
Item 7—Management’s Discussion and Analysis of Financial Condition and Results of Operations
“Reduction in inventory generated positive cash flow for the Company, partially offset by the tax impact of the consequent LIFO liquidation, which generated negative cash flow as it created taxable income, resulting in higher tax payments.”
Balance Sheets
| Year Ended December 31 (In thousands, except per share data) | 2007 | 2006 |
| Assets | ||
| Current Assets | ||
| ⋮ | ⋮ | ⋮ |
| Gross inventories: Less LIFO reserve Less excess and obsolescence reserve |
64,330 (46,890) (4,143) |
87,477 (57,555) (5,516) |
| Net inventories | 13,297 | 24,406 |
| ⋮ | ⋮ | ⋮ |
| Total Current Assets | 73,512 | 81,785 |
| ⋮ | ⋮ | ⋮ |
| Total Assets | $101,882 | $117,066 |
Statements of Income
| Year Ended December 31(In thousands, except per share data) | 2007 | 2006 |
| ⋮ | ⋮ | ⋮ |
| Total net sales | 156,485 | 167,620 |
| Cost of products sold | 117,186 | 139,610 |
| Gross profit | 39,299 | 28,010 |
| Expenses: | ||
| ⋮ | ⋮ | ⋮ |
| Total expenses | 30,184 | 27,088 |
| Operating income | 9,115 | 922 |
| ⋮ | ⋮ | ⋮ |
| Total other income, net | 7,544 | 921 |
| Income before income taxes | 16,659 | 1,843 |
| Income taxes | 6,330 | 739 |
| Net income | $10,329 | $1,104 |
| Basic and Diluted Earnings Per Share | $0.46 | $0.04 |
| Cash Dividends Per Share | $0.00 | $0.00 |
Notes to Financial Statements
1. Significant Accounting Policies
⋮
Inventories
Inventories are stated at the lower of cost, principally determined by the last-in, first-out (LIFO) method, or market. If inventories had been valued using the first-in, first-out method, inventory values would have been higher by approximately $46.9 million and $57.6 million at December 31, 2007 and 2006, respectively. During 2007 and 2006, inventory quantities were reduced. This reduction resulted in a liquidation of LIFO inventory quantities carried at lower costs prevailing in prior years as compared with the current cost of purchases, the effect of which decreased costs of products sold by approximately $12.1 million and $7.1 million in 2007 and 2006, respectively. There was no LIFO liquidation in 2005.
1. What is the decrease in the LIFO reserve on the balance sheet? How much less was the cost of products sold in 2007, because of LIFO liquidation, according to the note disclosure?
2. How did the decreased cost of products sold compare to operating income in 2007?
3. How did the LIFO liquidation affect cash flows?
Solution to 1: The LIFO reserve decreased by $10,665 thousands (57,555 − 46,890) in 2007. The LIFO liquidation decreased costs of products sold by approximately $12.1 million in 2007. The decrease in the LIFO reserve is indicative of a LIFO liquidation but is not sufficient to determine the exact amount of the LIFO liquidation.
Solution to 2: The decreased cost of products sold of approximately $12.1 million exceeds the operating income of approximately $9 million.
Solution to 3: The LIFO liquidation (reduction in inventory) generated positive cash flow. The positive cash flow effect of the LIFO liquidation was reduced by its tax impact. The LIFO liquidation resulted in higher taxable income and higher tax payments.
EXAMPLE 9-7 LIFO Liquidation Illustration
Reliable Fans, Inc. (RF), a hypothetical company, sells high quality fans and has been in business since 2006. Exhibit 9-4 provides relevant data and financial statement information about RF’s inventory purchases and sales of fan inventory for the years 2006 through 2009. RF uses the LIFO method and a periodic inventory system. What amount of RF’s 2009 gross profit is due to LIFO liquidation?
EXHIBIT 9-4 RF Financial Statement Information under LIFO
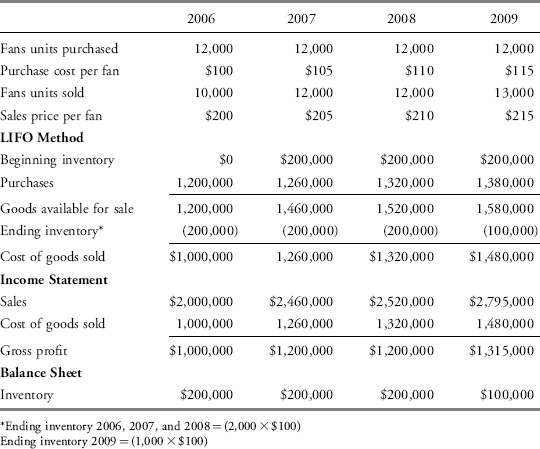
Solution: RF’s reported gross profit for 2009 is $1,315,000. RF’s 2009 gross profit due to LIFO liquidation is $15,000. If RF had purchased 13,000 fans in 2009 rather than 12,000 fans, the cost of goods sold under the LIFO method would have been $1,495,000 (13,000 fans sold at $115.00 purchase cost per fan), and the reported gross profit would have been $1,300,000 ($2,795,000 less $1,495,000). The gross profit due to LIFO liquidation is $15,000 ($1,315,000 reported gross profit less the $1,300,000 gross profit that would have been reported without the LIFO liquidation). The gross profit due to LIFO liquidation may also be determined by multiplying the number of units liquidated times the difference between the replacement cost of the units liquidated and their historical purchase cost. For RF, 1,000 units times $15 ($115 replacement cost per fan less the $100 historical cost per fan) equals the $15,000 gross profit due to LIFO liquidation.
Companies on rare occasion change inventory valuation methods. Under IFRS, a change in method is acceptable only if the change “results in the financial statements providing reliable and more relevant information about the effects of transactions, other events, or conditions on the business entity’s financial position, financial performance, or cash flows.”11 If the change is justifiable, then it is applied retrospectively.
This means that the change is applied to comparative information for prior periods as far back as is practicable. The cumulative amount of the adjustments relating to periods prior to those presented in the current financial statements is made to the opening balance of each affected component of equity (i.e., retained earnings or comprehensive income) of the earliest period presented. For example, if a company changes its inventory method in 2009 and it presents three years of comparative financial statements (2007, 2008, and 2009) in its annual report, it would retrospectively reflect this change as far back as possible. The change would be reflected in the three years of financial statements presented; the financial statements for 2007 and 2008 would be restated as if the new method had been used in these periods, and the cumulative effect of the change on periods prior to 2007 would be reflected in the 2007 opening balance of each affected component of equity. An exemption to the restatement applies when it is impracticable to determine either the period-specific effects or the cumulative effect of the change.
Under U.S. GAAP, the conditions to make a change in accounting policy and the accounting for a change in inventory policy are similar to IFRS.12 U.S. GAAP, however, requires companies to thoroughly explain why the newly adopted inventory accounting method is superior and preferable to the old method. If a company decides to change from LIFO to another inventory method, U.S. GAAP requires a retrospective restatement as described earlier. However, if a company decides to change to the LIFO method, it must do so on a prospective basis and retrospective adjustments are not made to the financial statements. The carrying amount of inventory under the old method becomes the initial LIFO layer in the year of LIFO adoption.
Analysts should carefully evaluate changes in inventory valuation methods. Although the stated reason for the inventory change may be to better match inventory costs with sales revenue (or some other plausible business explanation), the real underlying (and unstated) purpose may be to reduce income tax expense (if changing to LIFO from FIFO or average cost), or to increase reported profits (if changing from LIFO to FIFO or average cost). As always, the choice of inventory valuation method can have a significant impact on financial statements and the financial ratios that are derived from them. As a consequence, analysts must carefully consider the impact of the change in inventory valuation methods and the differences in inventory valuation methods when comparing a company’s performance with that of its industry or its competitors.
Significant financial risk can result from the holding of inventory. The cost of inventory may not be recoverable due to spoilage, obsolescence, or declines in selling prices. IFRS state that inventories shall be measured (and carried on the balance sheet) at the lower of cost and net realizable value.13 Net realizable value is the estimated selling price in the ordinary course of business less the estimated costs necessary to make the sale and estimated costs to get the inventory in condition for sale. The assessment of net realizable value is typically done item by item or by groups of similar or related items. In the event that the value of inventory declines below the carrying amount on the balance sheet, the inventory carrying amount must be written down to its net realizable value14 and the loss (reduction in value) recognized as an expense on the income statement. This expense may be included as part of cost of sales or reported separately.
In each subsequent period, a new assessment of net realizable value is made. Reversal (limited to the amount of the original write-down) is required for a subsequent increase in value of inventory previously written down. The reversal of any write-down of inventories is recognized as a reduction in cost of sales (reduction in the amount of inventories recognized as an expense).
U.S. GAAP specify the lower of cost or market to value inventories.15 This is broadly consistent with IFRS with one major difference: U.S. GAAP prohibit the reversal of write-downs. Market value is defined as current replacement cost subject to upper and lower limits. Market value cannot exceed net realizable value (selling price less reasonably estimated costs of completion and disposal). The lower limit of market value is net realizable value less a normal profit margin. Any write-down reduces the value of the inventory, and the loss in value (expense) is generally reflected in the income statement in cost of goods sold.
An inventory write-down reduces both profit and the carrying amount of inventory on the balance sheet and thus has a negative effect on profitability, liquidity, and solvency ratios. However, activity ratios (for example, inventory turnover and total asset turnover) will be positively affected by a write-down because the asset base (denominator) is reduced. The negative impact on some key ratios, due to the decrease in profit, may result in the reluctance by some companies to record inventory write-downs unless there is strong evidence that the decline in the value of inventory is permanent. This is especially true under U.S. GAAP where reversal of a write-down is prohibited.
IAS 2 [Inventories] does not apply to the inventories of producers of agricultural and forest products and minerals and mineral products, nor to commodity broker–traders. These inventories may be measured at net realizable value (fair value less costs to sell and complete) according to well-established industry practices. If an active market exists for these products, the quoted market price in that market is the appropriate basis for determining the fair value of that asset. If an active market does not exist, a company may use market determined prices or values (such as the most recent market transaction price) when available for determining fair value. Changes in the value of inventory (increase or decrease) are recognized in profit or loss in the period of the change. U.S. GAAP is similar to IFRS in its treatment of inventories of agricultural and forest products and mineral ores. Mark-to-market inventory accounting is allowed for bullion.
EXAMPLE 9-8 Accounting for Declines and Recoveries of Inventory Value
Acme Enterprises, a hypothetical company, manufactures computers and prepares its financial statements in accordance with IFRS. In 2008, the cost of ending inventory was €5.2 million but its net realizable value was €4.9 million. The current replacement cost of the inventory is €4.7 million. This figure exceeds the net realizable value less a normal profit margin. In 2009, the net realizable value of Acme’s inventory was €0.5 million greater than the carrying amount.
1. What was the effect of the write-down on Acme’s 2008 financial statements? What was the effect of the recovery on Acme’s 2009 financial statements?
2. Under U.S. GAAP, what would be the effects of the write-down on Acme’s 2008 financial statements and of the recovery on Acme’s 2009 financial statements?
3. What would be the effect of the recovery on Acme’s 2009 financial statements if Acme’s inventory were agricultural products instead of computers?
Solution to 1: For 2008, Acme would write its inventory down to €4.9 million and record the change in value of €0.3 million as an expense on the income statement. For 2009, Acme would increase the carrying amount of its inventory and reduce the cost of sales by €0.3 million (the recovery is limited to the amount of the original write-down).
Solution to 2: Under U.S. GAAP, for 2008, Acme would write its inventory down to €4.7 million and typically include the change in value of €0.5 million in cost of goods sold on the income statement. For 2009, Acme would not reverse the write-down.
Solution to 3: If Acme’s inventory were agricultural products instead of computers, inventory would be measured at net realizable value and Acme would, therefore, increase inventory by and record a gain of €0.5 million for 2009.
Analysts should consider the possibility of an inventory write-down because the impact on a company’s financial ratios may be substantial. The potential for inventory write-downs can be high for companies in industries where technological obsolescence of inventories is a significant risk. Analysts should carefully evaluate prospective inventory impairments (as well as other potential asset impairments) and their potential effects on the financial ratios when debt covenants include financial ratio requirements. The breaching of debt covenants can have a significant impact on a company.
Companies that use specific identification, weighted average cost, or FIFO methods are more likely to incur inventory write-downs than companies that use the LIFO method. Under the LIFO method, the oldest costs are reflected in the inventory carrying amount on the balance sheet. Given increasing inventory costs, the inventory carrying amounts under the LIFO method are already conservatively presented at the oldest and lowest costs. Thus, it is far less likely that inventory write-downs will occur under LIFO—and if a write-down does occur, it is likely to be of a lesser magnitude.
EXAMPLE 9-9 Effect of Inventory Write-Downs on Financial Ratios
The Volvo Group (OMX Nordic Exchange: VOLV B), based in Göteborg, Sweden, is a leading supplier of commercial transport products such as construction equipment, trucks, buses, and drive systems for marine and industrial applications as well as aircraft engine components.16 Excerpts from Volvo’s consolidated financial statements are shown in Exhibits 9-5 and 9-6. Notes pertaining to Volvo’s inventories are presented in Exhibit 9-7.
EXHIBIT 9-5 Volvo Group Consolidated Income Statements (Swedish Krona in millions, except per share data)
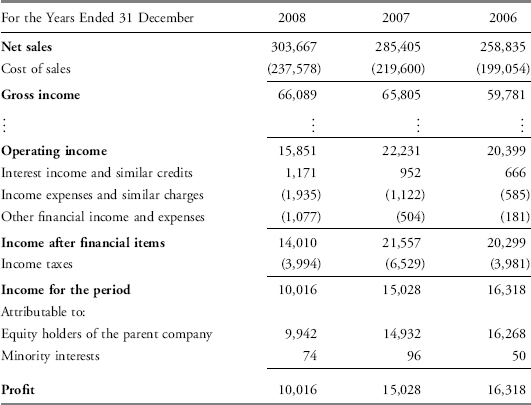
EXHIBIT 9-6 Volvo Group Consolidated Balance Sheets (Swedish Krona in millions)
1. What inventory values would Volvo have reported for 2008, 2007, and 2006 if it had no allowance for inventory obsolescence?
2. Assuming that any changes to the allowance for inventory obsolescence are reflected in the cost of sales, what amount would Volvo’s cost of sales be for 2008 and 2007 if it had not recorded inventory write-downs in 2008 and 2007?
3. What amount would Volvo’s profit (net income) be for 2008 and 2007 if it had not recorded inventory write-downs in 2008 and 2007? Assume tax rates of 28.5 percent for 2008 and 30 percent for 2007.
4. What would Volvo’s 2008 profit (net income) have been if it had reversed all past inventory write-downs in 2008? This question is independent of 1, 2, and 3. Assume a tax rate of 28.5 percent for 2008.
5. Compare the following for 2008 based on the numbers as reported and those assuming no allowance for inventory obsolescence as in questions 1, 2, and 3: inventory turnover ratio, days of inventory on hand, gross profit margin, and net profit margin.
6. CAT (Example 9-5) has no disclosures indicative of either inventory write-downs or a cumulative allowance for inventory obsolescence in its 2008 financial statements. Provide a conceptual explanation as to why Volvo incurred inventory write-downs for 2008 but CAT did not.
EXHIBIT 9-7 Volvo Group Selected Notes to Consolidated Financial Statements
NOTE 1. ACCOUNTING PRINCIPLES
Inventories
Inventories are reported at the lower of cost, in accordance with the first-in, first-out method (FIFO), or net realizable value. The acquisition value is based on the standard cost method, including costs for all direct manufacturing expenses and the apportionable share of the capacity and other related manufacturing costs. The standard costs are tested regularly and adjustments are made based on current conditions. Costs for research and development, selling, administration and financial expenses are not included. Net realizable value is calculated as the selling price less costs attributable to the sale.
NOTE 2. KEY SOURCES OF ESTIMATION UNCERTAINTY
Inventory obsolescence
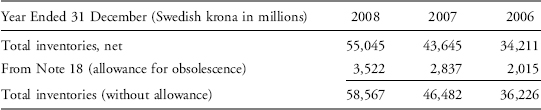
Inventories are reported at the lower of cost, in accordance with the first-in, first-out method (FIFO), or net realizable value. The estimated net realizable value includes management consideration of outdated articles, overstocking, physical damages, inventory-lead-time, handling and other selling costs. If the estimated net realizable value is lower than cost, a valuation allowance is established for inventory obsolescence. The total inventory value, net of inventory obsolescence allowance, is per 31 December 2008, SEK (in millions) 55,045.
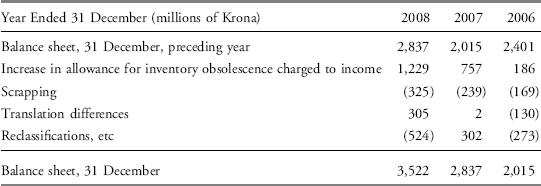
NOTE 18. INVENTORIES
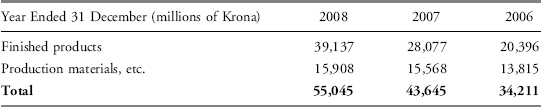
Increase (decrease) in allowance for inventory obsolescence
Solution to 1:
Solution to 2:
| Year Ended 31 December (Swedish krona in millions) | 2008 | 2007 |
| Cost of sales | 237,578 | 219,600 |
| Less: Increase in allowance for obsolescence* | −685 | −822 |
| Cost of sales (without allowance) | 236,893 | 218,778 |
*From Note 18, the increase in allowance for obsolescence for 2008 is 685 (3,522 − 2,837) and for 2007 is 822 (2,837 − 2,015).
Solution to 3:
| Year Ended 31 December (Swedish krona in millions) | 2008 | 2007 |
| Profit (net income) | 10,016 | 15,028 |
| Reduction in cost of sales (increase in operating profit) | 685 | 822 |
| Taxes on increased operating profit* | −195 | −247 |
| Profit (without allowance) | 10,506 | 15,603 |
*Taxes on the increased operating profit are assumed to be 195 (685 × 28.5%) for 2008 and 247 (822 × 30%) for 2007.
Solution to 4:
| Year Ended 31 December (Swedish krona in millions) | 2008 |
| Profit (net income) | 10,016 |
| Reduction in cost of sales (increase in operating profit) | 3,522 |
| Taxes on increased operating profit* | −1,004 |
| Profit (after recovery of previous write-downs) | 12,534 |
*Taxes on the increased operating profit are assumed to be 1,004 (3,522 × 28.5%) for 2008.
Solution to 5: The Volvo Group’s financial ratios for 2008 with the allowance for inventory obsolescence and without the allowance for inventory obsolescence are as follows:
| With Allowance (as Reported) | Without Allowance (Adjusted) | |
| Inventory turnover ratio | 4.81 | 4.51 |
| Days of inventory on hand | 76.1 | 81.2 |
| Gross profit margin | 21.76% | 21.99% |
| Net profit margin | 3.30% | 3.46% |
Inventory turnover ratio = Cost of sales÷Average inventory
With allowance (as reported) = 4.81 = 237,578÷[(55,045+43,645)÷2]
Without allowance (adjusted) = 4.51 = 236,893÷[(58,567+46,482)÷2]
Inventory turnover is higher based on the numbers as reported because cost of sales will be higher (assuming inventory write-downs are reported as part of cost of sales) and inventory carrying amounts will be lower with an allowance for inventory obsolescence. The company appears to manage its inventory more efficiently when it has inventory write-downs.
Days of inventory on hand = Number of days in period÷Inventory turnover ratio
With allowance (as reported) = 76.1 days = (366 days* ÷4.81)
Without allowance (adjusted) = 81.2 days = (366 days÷4.51)
*2008 was a leap year.
Days of inventory on hand are lower based on the numbers as reported because the inventory turnover is higher. A company with inventory write-downs might appear to manage its inventory more effectively. This is primarily the result of the lower inventory carrying amounts.
Gross profit margin = Gross income÷Net sales
With allowance (as reported) = 21.76 percent = (66,089÷303,667)
Without allowance (adjusted) = 21.99 percent = [(66,089+685)÷303,667]
The gross profit margin is lower with inventory write-downs because the cost of sales is higher. This assumes that inventory write-downs are reported as part of cost of sales.
Net profit margin = Profit÷Net sales
With allowance (as reported) = 3.30 percent = (10,016÷303,667)
Without allowance (adjusted) = 3.46 percent = (10,506÷303,667)
The net profit margin is lower with inventory write-downs because the cost of sales is higher (assuming the inventory write-downs are reported as part of cost of sales). The absolute percentage difference is less than that of the gross profit margin because of income taxes on the increased income without write-downs.
The profitability ratios (gross profit margin and net profit margin) for Volvo Group would have been slightly better (higher) for 2008 if the company had not recorded inventory write-downs. The activity ratio (inventory turnover ratio) would appear less attractive without the write-downs. The inventory turnover ratio is slightly better (higher) with inventory write-downs because inventory write-downs increase cost of sales (numerator) and decrease the average inventory (denominator), making inventory management appear more efficient with write-downs.
Solution to 6: CAT uses the LIFO method whereas Volvo uses the FIFO method. Given increasing inventory costs, companies that use the FIFO inventory method are far more likely to incur inventory write-downs than those companies that use the LIFO method. This is because under the LIFO method, the inventory carrying amounts reflect the oldest costs and therefore the lowest costs given increasing inventory costs. Because inventory carrying amounts under the LIFO method are already conservatively presented, it is less likely that inventory write-downs will occur.
7. EVALUATION OF INVENTORY MANAGEMENT
The choice of inventory valuation method impacts the financial statements. The financial statement items impacted include cost of sales, gross profit, net income, inventories, current assets, and total assets. Therefore, the choice of inventory valuation method also affects financial ratios that contain these items. Ratios such as current ratio, return on assets, gross profit margin, and inventory turnover are impacted. As a consequence, analysts must carefully consider inventory valuation method differences when evaluating a company’s performance over time or when comparing its performance with the performance of the industry or industry competitors. Additionally, the financial statement items and ratios may be impacted by adjustments of inventory carrying amounts to net realizable value or current replacement cost.
7.1. Presentation and Disclosure
Disclosures are useful when analyzing a company. IFRS require the following financial statement disclosures concerning inventory:
a. The accounting policies adopted in measuring inventories, including the cost formula (inventory valuation method) used.
b. The total carrying amount of inventories and the carrying amount in classifications (for example, merchandise, raw materials, production supplies, work in progress, and finished goods) appropriate to the entity.
c. The carrying amount of inventories carried at fair value less costs to sell.
d. The amount of inventories recognized as an expense during the period (cost of sales).
e. The amount of any write-down of inventories recognized as an expense in the period.
f. The amount of any reversal of any write-down that is recognized as a reduction in cost of sales in the period.
g. The circumstances or events that led to the reversal of a write-down of inventories.
h. The carrying amount of inventories pledged as security for liabilities.
Inventory-related disclosures under U.S. GAAP are very similar to the disclosures cited earlier, except that requirements (f) and (g) are not relevant because U.S. GAAP do not permit the reversal of prior-year inventory write-downs. U.S. GAAP also require disclosure of significant estimates applicable to inventories and of any material amount of income resulting from the liquidation of LIFO inventory.
7.2. Inventory Ratios
Three ratios often used to evaluate the efficiency and effectiveness of inventory management are inventory turnover, days of inventory on hand, and gross profit margin.17 These ratios are directly impacted by a company’s choice of inventory valuation method. Analysts should be aware, however, that many other ratios are also affected by the choice of inventory valuation method, although less directly. These include the current ratio, because inventory is a component of current assets; the return-on-assets ratio, because cost of sales is a key component in deriving net income and inventory is a component of total assets; and even the debt-to-equity ratio, because the cumulative measured net income from the inception of a business is an aggregate component of retained earnings.
The inventory turnover ratio measures the number of times during the year a company sells (i.e., turns over) its inventory. The higher the turnover ratio, the more times that inventory is sold during the year and the lower the relative investment of resources in inventory. Days of inventory on hand can be calculated as days in the period divided by inventory turnover. Thus, inventory turnover and days of inventory on hand are inversely related. It may be that inventory turnover, however, is calculated using average inventory in the year whereas days of inventory on hand is based on the ending inventory amount. In general, inventory turnover and the number of days of inventory on hand should be benchmarked against industry norms and compared across years.
A high inventory turnover ratio and a low number of days of inventory on hand might indicate highly effective inventory management. Alternatively, a high inventory ratio and a low number of days of inventory on hand could indicate that the company does not carry an adequate amount of inventory or that the company has written down inventory values. Inventory shortages could potentially result in lost sales or production problems in the case of the raw materials inventory of a manufacturer. To assess which explanation is more likely, analysts can compare the company’s inventory turnover and sales growth rate with those of the industry and review financial statement disclosures. Slower growth combined with higher inventory turnover could indicate inadequate inventory levels. Write-downs of inventory could reflect poor inventory management. Minimal write-downs and sales growth rates at or above the industry’s growth rates would support the interpretation that the higher turnover reflects greater efficiency in managing inventory.
A low inventory turnover ratio and a high number of days of inventory on hand relative to industry norms could be an indicator of slow-moving or obsolete inventory. Again, comparing the company’s sales growth across years and with the industry and reviewing financial statement disclosures can provide additional insight.
The gross profit margin, the ratio of gross profit to sales, indicates the percentage of sales being contributed to net income as opposed to covering the cost of sales. Firms in highly competitive industries generally have lower gross profit margins than firms in industries with fewer competitors. A company’s gross profit margin may be a function of its type of product. A company selling luxury products will generally have higher gross profit margins than a company selling staple products. The inventory turnover of the company selling luxury products, however, is likely to be much lower than the inventory turnover of the company selling staple products.
7.3. Financial Analysis Illustrations
IFRS and U.S. GAAP require companies to disclose, either on the balance sheet or in the notes to the financial statements, the carrying amounts of inventories in classifications suitable to the company. For manufacturing companies, these classifications might include production supplies, raw materials, work in progress, and finished goods. For a retailer, these classifications might include significant categories of merchandise or the grouping of inventories with similar attributes. These disclosures may provide signals about a company’s future sales and profits.
For example, a significant increase (attributable to increases in unit volume rather than increases in unit cost) in raw materials and/or work-in-progress inventories may signal that the company expects an increase in demand for its products. This suggests an anticipated increase in sales and profit. However, a substantial increase in finished goods inventories while raw materials and work-in-progress inventories are declining may signal a decrease in demand for the company’s products and hence lower future sales and profit. This may also signal a potential future write-down of finished goods inventory. Irrespective of the signal, an analyst should thoroughly investigate the underlying reasons for any significant changes in a company’s raw materials, work-in-progress, and finished goods inventories.
Analysts also should compare the growth rate of a company’s sales to the growth rate of its finished goods inventories, because this could also provide a signal about future sales and profits. For example, if the growth of inventories is greater than the growth of sales, this could indicate a decline in demand and a decrease in future earnings. The company may have to lower (mark down) the selling price of its products to reduce its inventory balances, or it may have to write down the value of its inventory because of obsolescence, both of which would negatively affect profits. Besides the potential for mark-downs or write-downs, having too much inventory on hand or the wrong type of inventory can have a negative financial effect on a company because it increases inventory-related expenses such as insurance, storage costs, and taxes. In addition, it means that the company has less cash and working capital available to use for other purposes.
Inventory write-downs may have a substantial impact on a company’s activity, profitability, liquidity, and solvency ratios. It is critical for the analyst to be aware of industry trends toward product obsolescence and to analyze the financial ratios for their sensitivity to potential inventory impairment. Companies can minimize the impact of inventory write-downs by better matching their inventory composition and growth with prospective customer demand. To obtain additional information about a company’s inventory and its future sales, a variety of sources of information are available. Analysts should consider the management’s discussion and analysis (MD&A) or similar sections of the company’s financial reports, industry-related news and publications, and industry economic data.
When conducting comparisons, differences in the choice of inventory valuation method can significantly affect the comparability of financial ratios between companies. A restatement from the LIFO method to the FIFO method is critical to make a valid comparison with companies using a method other than the LIFO method such as those companies reporting under IFRS. Analysts should seek out as much information as feasible when analyzing the performance of companies.
EXAMPLE 9-10 Comparative Illustration
1. Using CAT’s LIFO numbers as reported and FIFO adjusted numbers (Example 9-5) and Volvo’s numbers as reported (Example 9-9), compare the following for 2008: inventory turnover ratio, days of inventory on hand, gross profit margin, net profit margin, return on assets, current ratio, total liabilities-to-equity ratio, and return on equity. For the current ratio, include current provisions as part of current liabilities. For the total liabilities-to-equity ratio, include provisions in total liabilities.
2. How much do inventories represent as a component of total assets for CAT using LIFO numbers as reported and FIFO adjusted numbers, and for Volvo using reported numbers in 2007 and 2008? Discuss any changes that would concern an analyst.
3. Using the reported numbers, compare the 2007 and 2008 growth rates of CAT and Volvo for sales, finished goods inventory, and inventories other than finished goods.
Solution to 1: The comparisons between Caterpillar and Volvo for 2008 are as follows:
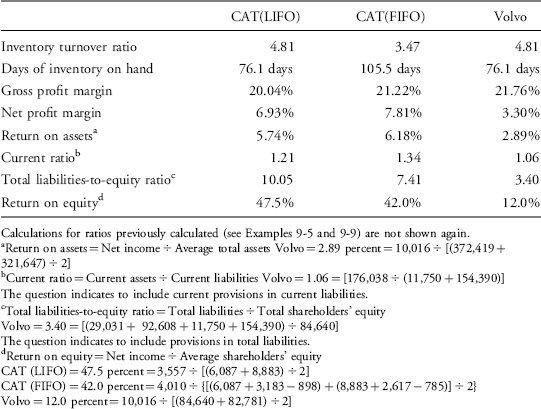
Comparing CAT (FIFO) and Volvo, it appears that Volvo manages its inventory more effectively. It has higher inventory turnover and less days of inventory on hand. CAT appears to have superior profitability based on net profit margins. CAT did report some losses as other comprehensive income in the balance sheet (see Exhibit 9-2) as indicated by the absolute increase in the negative accumulated other comprehensive income. The absolute increase in the negative accumulated other comprehensive income results in a reduction of shareholders’ equity which makes CAT’s return on equity higher. The higher leverage of CAT also increases the return on equity. The sources of CAT’s higher return on equity (reporting losses through other comprehensive income and higher leverage) should be of concern to an analyst. An analyst should investigate further, rather than reaching a conclusion based on ratios alone (in other words, try to identify the underlying causes of changes or differences in ratios).
Solution to 2: The 2008 and 2007 inventory to total assets ratios for CAT using LIFO and adjusted to FIFO and for Volvo as reported, are as follows:
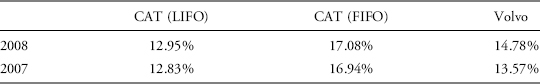
Inventory to total assets
CAT (LIFO) 2008 = 12.95 percent = 8,781÷67,782
CAT (LIFO) 2007 = 12.83 percent = 7,204÷56,132
CAT (FIFO) 2008 = 17.08 percent = 11,964÷(67,782+3,183 − 898)
CAT (FIFO) 2007 = 16.94 percent = 9,821÷(56,132+2,617 − 785)
Volvo 2008 = 14.78 percent = 55,045÷372,419
Volvo 2007 = 13.57 percent = 43,645÷321,647
Based on the numbers as reported, CAT appears to have a lower percentage of assets tied up in inventory than Volvo. However, when CAT’s inventory is adjusted to FIFO, it has a higher percentage of its assets tied up in inventory than Volvo.
The increase in Volvo’s inventory as a percentage of total assets is cause for some concern. Higher inventory typically results in higher maintenance costs (for example, storage and financing costs). In addition, Volvo may be building up slow-moving or obsolete inventories that may result in future inventory write-downs for 2009. In Volvo’s Note 18, the breakdown by inventory classification shows a small increase in the inventory of production materials. It appears that Volvo is planning on reducing production until it reduces its finished goods inventory. Looking at CAT’s Note 9, all classifications of inventory seem to be increasing and because these are valued using the LIFO method, there is some cause for concern. The company must be increasing inventory quantities and adding LIFO layers.
Solution to 3: CAT’s and Volvo’s 2008 and 2007 growth rates for sales (for CAT use Sales of machinery and engines and for Volvo use Net sales), finished goods, and inventories other than finished goods are as follows:
| CAT | Volvo | |
| 2008 | ||
| Sales | 14.5% | 6.4% |
| Finished goods | 31.2% | 39.4% |
| Inventories other than finished goods | 15.0% | 2.2% |
| 2007 | ||
| Sales | 8.0% | 10.3% |
| Finished goods | 10.1% | 37.7% |
| Inventories other than finished goods | 16.0% | 12.7% |
Growth rate = (Value for year − Value for previous year)/Value for previous year
2008 CAT
Sales = 14.5 percent = (48,044 − 41,962)÷41,962
Finished goods = 31.2 percent = (4,022 − 3,066)÷3,066
Inventories other than finished goods = 15.0 percent = [(3,356+1,107+296) − (2,990+863+285)]÷(2,990+863+285)
2008 Volvo
Sales = 6.4 percent = (303,667 − 285,405)÷285,405
Finished products = 39.4 percent = (39,137 − 28,077)÷28,077
Inventories other than finished products = 2.2 percent = (15,908 − 15,568)÷15,568
2007 CAT
Sales = 8.0 percent = (41,962 − 38,869)÷38,869
Finished goods = 10.1 percent = (3,066 − 2,785)÷2,785
Inventories other than finished goods = 16.0 percent = [(2,990+863+285) − (2,698+591+277)]÷(2,698+591+277)
2007 Volvo
Sales = 10.3 percent = (285,405 − 258,835)÷258,835
Finished products = 37.7 percent = (28,077 − 20,396)÷20,396
Inventories other than finished products = 12.7 percent = (15,568 − 13,815)÷13,815
For both companies, the growth rates in finished goods inventory exceeds the growth rate in sales; this could be indicative of accumulating excess inventory. Volvo’s growth rate in finished goods compared to its growth rate in sales is significantly higher but the lower growth rates in finished goods inventory for CAT is potentially a result of using the LIFO method versus the FIFO method. It appears Volvo is aware that an issue exists and is planning on cutting back production given the relatively small increase in inventories other than finished products. Regardless, an analyst should do further investigation before reaching any conclusion about a company’s future prospects for sales and profit.
EXAMPLE 9-11 Management Discussion and Analysis
The following excerpts commenting on inventory management are from the Volvo Group Annual Report, 2008:
From the CEO Comment: “In a declining economy, it is extremely important to act quickly to reduce the Group’s cost level and ensure we do not build inventories, since large inventories generally lead to pressure on prices.”. . .“During the second half of the year, we implemented sharp production cutbacks to lower inventories of new trucks and construction equipment as part of efforts to maintain our product prices, which represent one of the most important factors in securing favorable profitability in the future. We have been successful in these efforts. During the fourth quarter, inventories of new trucks declined 13% and of new construction equipment by 19%. During the beginning of 2009, we have continued to work diligently and focused to reduce inventories to the new, lower levels of demand that prevail in most of our markets, and for most of our products.”
From the Board of Directors’ Report 2008: “Inventory reduction contributed to positive operating cash flow of SEK 1.8 billion in Industrial Operations.”. . .“The value of inventories increased during 2008 by SEK 11.4 billion. Adjusted for currency changes, the increase amounted to SEK 5.8 billion. The increase is mainly related to the truck operations and to construction equipment and is an effect of the rapidly weakening demand during the second half of the year.”. . .“In order to reduce the capital tied-up in inventory, a number of shutdown days in production were carried out during the end of year. Measures aimed at selling primarily trucks and construction equipment in inventory were prioritized. These measures have continued during the beginning of 2009.” and “Overcapacity within the industry can occur if there is a lack of demand, potentially leading to increased price pressure.”
From Business Areas 2008 (Ambitions 2009): “Execute on cost reduction and adjust production to ensure inventory levels in line with demand.”
Assume inventory write-downs are reported as part of cost of sales. Based on the previous excerpts, discuss the anticipated direction of the following for 2009 compared to 2008:
1. Inventory carrying amounts
2. Inventory turnover ratio
3. Sales
4. Gross profit margin
5. Return on assets
6. Current ratio
Solution to 1: Inventory carrying amounts are expected to decrease as the company cuts back on inventory levels and pressures are exerted on costs and prices.
Solution to 2: Inventory turnover ratio is expected to increase. Any potential change in cost of sales will be more than offset by the decline in inventory carrying amounts. For example, if cost of sales and inventory carrying amounts were 238 billion and 55 billion Swedish krona, before inventory write-downs totaling 1 billion Swedish krona, the inventory turnover ratio will change from 4.33 (238 ÷ 55) to 4.39 (237 ÷ 54).
Solution to 3: Unit sales and sales revenues are expected to decline due to decrease in demand and pressure on prices.
Solution to 4: Gross profit margin is difficult to predict. Sales revenues are expected to decline but cost of sales as a percentage of sales revenue may decline if cost controls are effective, stay the same if cost controls are offset by increased inventory write-downs, or increase if inventory write-downs more than offset cost controls. In this case, an analyst might use 2008’s gross profit margin of 21.8 percent as a reasonable prediction. It is less than the 2006 and 2007 gross profit margin of 23.1 percent and may already reflect cost controls, price pressures, and inventory write-downs.
Solution to 5: Return on assets is expected to decline. The positive effects of cost controls and reduction in assets is likely to be offset by decreased net income due to the declining sales revenues.
Solution to 6: The direction of change in the current ratio is difficult to predict. Current assets are expected to be reduced but current liabilities are also expected to be reduced as costs are controlled and purchases are reduced resulting in lower accounts payable.
EXAMPLE 9-12 Single Company Illustration
Selected excerpts from the consolidated financial statements and notes to consolidated financial statements for Alcatel-Lucent (NYSE: ALU) are presented in Exhibits 9-8, 9-9, and 9-10. Exhibit 9-8 contains excerpts from the consolidated income statements, and Exhibit 9-9 contains excerpts from the consolidated balance sheets. Exhibit 9-10 contains excerpts from three of the notes to consolidated financial statements.
EXHIBIT 9-8 Alcatel-Lucent Consolidated Income Statements (€ millions)
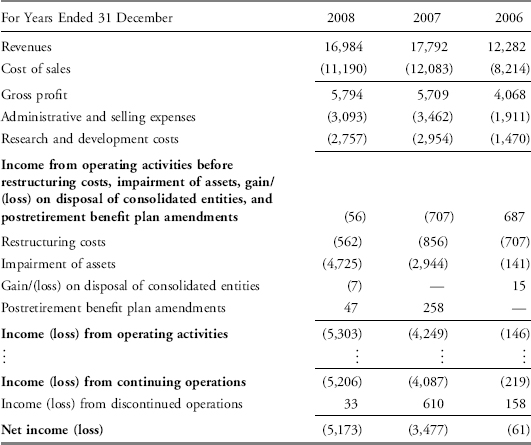
EXHIBIT 9-9 Alcatel-Lucent Consolidated Balance Sheets (€ millions)
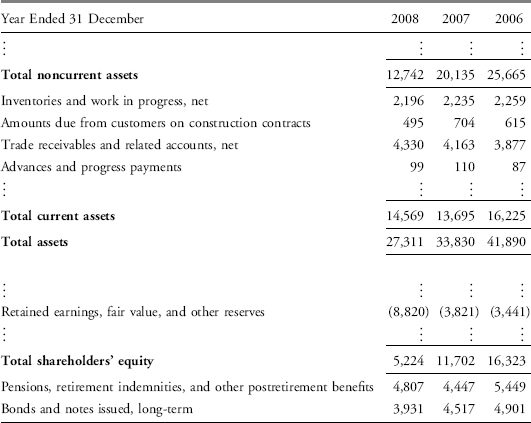
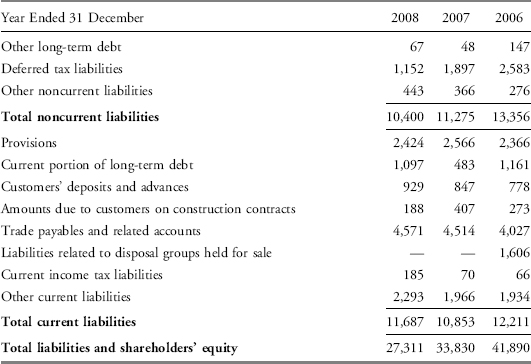
Note 1 (i) discloses that ALU’s finished goods inventories and work in progress are valued at the lower of cost or net realizable value. Note 2 (a) discloses that the impact of inventory and work in progress write-downs on ALU’s income before tax was a net reduction of €285 million in 2008, a net reduction of €186 million in 2007, and a net reduction of €77 million in 2006.18 The inventory impairment loss amounts steadily increased from 2006 to 2008 and are included as a component, (additions)/reversals, of ALU’s change in valuation allowance as disclosed in Note 19 (b) from Exhibit 9-10. Observe also that ALU discloses its valuation allowance at 31 December 2008, 2007, and 2006 in Note 19 (b) and details on the allocation of the allowance are included in Note 19 (a). The €654 million valuation allowance is the total of a €629 million allowance for inventories and a €25 million allowance for work in progress on construction contracts. Finally, observe that the €2,196 million net value for inventories (excluding construction contracts) at 31 December 2008 in Note 19 (a) reconciles with the balance sheet amount for inventories and work in progress, net, on 31 December 2008, as presented in Exhibit 9-9.
The inventory valuation allowance represents the total amount of inventory write-downs taken for the inventory reported on the balance sheet (which is measured at the lower of cost or net realizable value). Therefore, an analyst can determine the historical cost of the company’s inventory by adding the inventory valuation allowance to the reported inventory carrying amount on the balance sheet. The valuation allowance increased in magnitude and as a percentage of gross inventory values from 2006 to 2008.
EXHIBIT 9-10 Alcatel-Lucent Selected Notes to Consolidated Financial Statements
Note 1. Summary of Significant Accounting Policies
(i) Inventories and work in progress
Inventories and work in progress are valued at the lower of cost (including indirect production costs where applicable) or net realizable value.19 Net realizable value is the estimated sales revenue for a normal period of activity less expected completion and selling costs.
Note 2. Principal Uncertainties Regarding the Use of Estimates
(a) Valuation allowance for inventories and work in progress
Inventories and work in progress are measured at the lower of cost or net realizable value. Valuation allowances for inventories and work in progress are calculated based on an analysis of foreseeable changes in demand, technology, or the market, in order to determine obsolete or excess inventories and work in progress.
The valuation allowances are accounted for in cost of sales or in restructuring costs, depending on the nature of the amounts concerned.
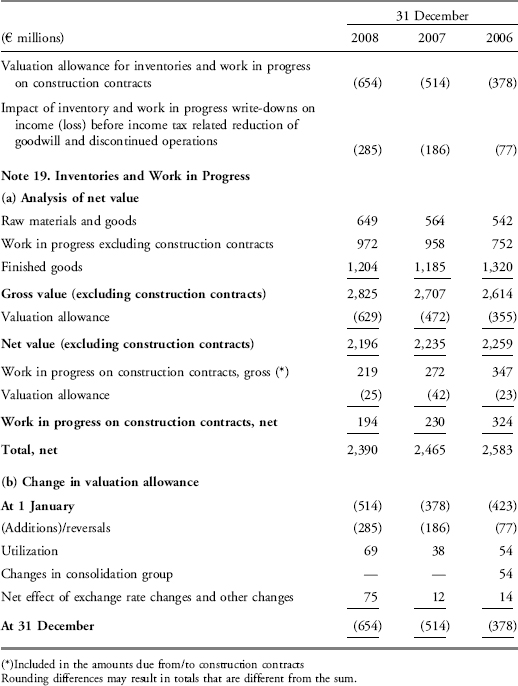
1. Calculate ALU’s inventory turnover, number of days of inventory on hand, gross profit margin, current ratio, debt-to-equity ratio, and return on total assets for 2008 and 2007 based on the numbers reported. Use an average for inventory and total asset amounts and year-end numbers for other ratio items. For debt, include only bonds and notes issued, long-term; other long-term debt; and current portion of long-term debt.
2. Based on the answer to Question 1, comment on the changes from 2007 to 2008.
3. If ALU had used the weighted average cost method instead of the FIFO method during 2008, 2007, and 2006, what would be the effect on ALU’s reported cost of sales and inventory carrying amounts? What would be the directional impact on the financial ratios that were calculated for ALU in Question 1?
Solution to 1: The financial ratios are as follows:
| 2008 | 2007 | |
| Inventory turnover ratio | 5.05 | 5.38 |
| Number of days of inventory | 72.3 days | 67.8 days |
| Gross profit margin | 34.1% | 32.1% |
| Current ratio | 1.25 | 1.26 |
| Debt-to-equity ratio | 0.98 | 0.43 |
| Return on total assets | −16.9% | −9.2% |
Inventory turnover ratio = Cost of sales ÷ Average inventory
2008 inventory turnover ratio = 5.05 = 11,190 ÷ [(2,196+2,235) ÷ 2]
2007 inventory turnover ratio = 5.38 = 12,083 ÷ [(2,235+2,259) ÷ 2]
Number of days of inventory = 365 days ÷ Inventory turnover ratio
2008 number of days of inventory = 72.3 days = 365 days ÷ 5.05
2007 number of days of inventory = 67.8 days = 365 days ÷ 5.38
Gross profit margin = Gross profit ÷ Total revenue
2008 gross profit margin = 34.1% = 5,794 ÷ 16,984
2007 gross profit margin = 32.1% = 5,709 ÷ 17,792
Current ratio = Current assets ÷ Current liabilities
2008 current ratio = 1.25 = 14,569 ÷ 11,687
2007 current ratio = 1.26 = 13,695 ÷ 10,853
Debt-to-equity ratio = Total debt ÷ Total shareholders’ equity
2008 debt-to-equity ratio = 0.98 = (3,931+67+1,097) ÷ 5,224
2007 debt-to-equity ratio = 0.43 = (4,517+48+483) ÷ 11,702
Return on assets = Net income ÷ Average total assets
2008 return on assets = −16.9% = −5,173 ÷ [(27,311+33,830) ÷ 2]
2007 return on assets = −9.2% = −3,477 ÷ [(33,830+41,890) ÷ 2]
Solution to 2: From 2007 to 2008, the inventory turnover ratio declined and the number of days of inventory increased by 4.5 days. ALU appears to be managing inventory less efficiently. The gross profit margin improved by 2.0 percent, from 32.1 percent in 2007 to 34.1 percent in 2008. The current ratio is relatively unchanged from 2007 to 2008. The debt-to-equity ratio has risen significantly in 2008 compared to 2007. Although ALU’s total debt has been relatively stable during this time period, the company’s equity has been declining rapidly because of the cumulative effect of its net losses on retained earnings.
The return on assets is negative and got worse in 2008 compared to 2007. A larger net loss and lower total assets in 2008 resulted in a higher negative return on assets. The analyst should investigate the underlying reasons for the sharp decline in ALU’s return on assets. From Exhibit 9-8, it is apparent that ALU’s gross profit margins were insufficient to cover the administrative and selling expenses and research and development costs in 2007 and 2008. Large restructuring costs and asset impairment losses contributed to the loss from operating activities in both 2007 and 2008.
Solution to 3: If inventory replacement costs were increasing during 2006, 2007, and 2008 (and inventory quantity levels were stable or increasing), ALU’s cost of sales would have been higher and its gross profit margin would have been lower under the weighted average cost inventory method than what was reported under the FIFO method (assuming no inventory write-downs that would otherwise neutralize the differences between the inventory valuation methods). FIFO allocates the oldest inventory costs to cost of sales; the reported cost of sales would be lower under FIFO given increasing inventory costs. Inventory carrying amounts would be higher under the FIFO method than under the weighted average cost method because the more recently purchased inventory items would be included in inventory at their higher costs (again assuming no inventory write-downs that would otherwise neutralize the differences between the inventory valuation methods). Consequently, ALU’s reported gross profit, net income, and retained earnings would also be higher for those years under the FIFO method.
The effects on ratios are as follows:
- The inventory turnover ratios would all be higher under the weighted average cost method because the numerator (cost of sales) would be higher and the denominator (inventory) would be lower than what was reported by ALU under the FIFO method.
- The number of days of inventory would be lower under the weighted average cost method because the inventory turnover ratios would be higher.
- The gross profit margin ratios would all be lower under the weighted average cost method because cost of sales would be higher under the weighted average cost method than under the FIFO method.
- The current ratios would all be lower under the weighted average cost method because inventory carrying values would be lower than under the FIFO method (current liabilities would be the same under both methods).
- The return-on-assets ratios would all be lower under the weighted average cost method because the incremental profit added to the numerator (net income) has a greater impact than the incremental increase to the denominator (total assets). By way of example, assume that a company has €3 million in net income and €100 million in total assets using the weighted average cost method. If the company reports another €1 million in net income by using FIFO instead of weighted average cost, it would then also report an additional €1 million in total assets (after tax). Based on this example, the return on assets is 3.00 percent (€3/€100) under the weighted average cost method and 3.96 percent (€4/€101) under the FIFO method.
- The debt-to-equity ratios would all be higher under the weighted average cost method because retained earnings would be lower than under the FIFO method (again assuming no inventory write-downs that would otherwise neutralize the differences between the inventory valuation methods).
Conversely, if inventory replacement costs were decreasing during 2006, 2007, and 2008 (and inventory quantity levels were stable or increasing), ALU’s cost of sales would have been lower and its gross profit and inventory would have been higher under the weighted average cost method than were reported under the FIFO method (assuming no inventory write-downs that would otherwise neutralize the differences between the inventory valuation methods). As a result, the ratio assessment that was performed above would result in directly opposite conclusions.
The choice of inventory valuation method (cost formula or cost flow assumption) can have a potentially significant impact on inventory carrying amounts and cost of sales. These in turn impact other financial statement items, such as current assets, total assets, gross profit, and net income. The financial statements and accompanying notes provide important information about a company’s inventory accounting policies that the analyst needs to correctly assess financial performance and compare it with that of other companies. Key concepts in this reading are as follows:
- Inventories are a major factor in the analysis of merchandising and manufacturing companies. Such companies generate their sales and profits through inventory transactions on a regular basis. An important consideration in determining profits for these companies is measuring the cost of sales when inventories are sold.
- The total cost of inventories comprises all costs of purchase, costs of conversion, and other costs incurred in bringing the inventories to their present location and condition. Storage costs of finished inventory and abnormal costs due to waste are typically treated as expenses in the period in which they occurred.
- The allowable inventory valuation methods implicitly involve different assumptions about cost flows. The choice of inventory valuation method determines how the cost of goods available for sale during the period is allocated between inventory and cost of sales.
- IFRS allow three inventory valuation methods (cost formulas): first-in, first-out (FIFO); weighted average cost; and specific identification. The specific identification method is used for inventories of items that are not ordinarily interchangeable and for goods or services produced and segregated for specific projects. U.S. GAAP allow these three methods plus the last-in, first-out (LIFO) method. The LIFO method is widely used in the United States for both tax and financial reporting purposes because of potential income tax savings.
- The choice of inventory method affects the financial statements and any financial ratios that are based on them. As a consequence, the analyst must carefully consider inventory valuation method differences when evaluating a company’s performance over time or in comparison to industry data or industry competitors.
- A company must use the same cost formula for all inventories having a similar nature and use to the entity.
- The inventory accounting system (perpetual or periodic) may result in different values for cost of sales and ending inventory when the weighted average cost or LIFO inventory valuation method is used.
- Under U.S. GAAP, companies that use the LIFO method must disclose in their financial notes the amount of the LIFO reserve or the amount that would have been reported in inventory if the FIFO method had been used. This information can be used to adjust reported LIFO inventory and cost of goods sold balances to the FIFO method for comparison purposes.
- LIFO liquidation occurs when the number of units in ending inventory declines from the number of units that were present at the beginning of the year. If inventory unit costs have generally risen from year to year, this will produce an inventory-related increase in gross profits.
- Consistency of inventory costing is required under both IFRS and U.S. GAAP. If a company changes an accounting policy, the change must be justifiable and applied retrospectively to the financial statements. An exception to the retrospective restatement is when a company reporting under U.S. GAAP changes to the LIFO method.
- Under IFRS, inventories are measured at the lower of cost and net realizable value. Net realizable value is the estimated selling price in the ordinary course of business less the estimated costs necessary to make the sale. Under U.S. GAAP, inventories are measured at the lower of cost or market value. Market value is defined as current replacement cost subject to an upper limit of net realizable value and a lower limit of net realizable value less a normal profit margin. Reversals of previous write-downs are permissible under IFRS but not under U.S. GAAP.
- Reversals of inventory write-downs may occur under IFRS but are not allowed under U.S. GAAP.
- Changes in the carrying amounts within inventory classifications (such as raw materials, work-in-process, and finished goods) may provide signals about a company’s future sales and profits. Relevant information with respect to inventory management and future sales may be found in the Management Discussion and Analysis or similar items within the annual or quarterly reports, industry news and publications, and industry economic data.
- The inventory turnover ratio, number of days of inventory ratio, and gross profit margin ratio are useful in evaluating the management of a company’s inventory.
- Inventory management may have a substantial impact on a company’s activity, profitability, liquidity, and solvency ratios. It is critical for the analyst to be aware of industry trends and management’s intentions.
- Financial statement disclosures provide information regarding the accounting policies adopted in measuring inventories, the principal uncertainties regarding the use of estimates related to inventories, and details of the inventory carrying amounts and costs. This information can greatly assist analysts in their evaluation of a company’s inventory management.
1. Inventory cost is least likely to include:
A. production-related storage costs.
B. costs incurred as a result of normal waste of materials.
C. transportation costs of shipping inventory to customers.
2. Mustard Seed PLC adheres to IFRS. It recently purchased inventory for €100 million and spent €5 million for storage prior to selling the goods. The amount it charged to inventory expense (€ millions) was closest to:
A. €95.
B. €100.
C. €105.
3. Carrying inventory at a value above its historical cost would most likely be permitted if:
A. the inventory was held by a producer of agricultural products.
B. financial statements were prepared using U.S. GAAP.
C. the change resulted from a reversal of a previous write-down.
4. Eric’s Used Bookstore prepares its financial statements in accordance with IFRS. Inventory was purchased for £1 million and later marked down to £550,000. One of the books, however, was later discovered to be a rare collectible item, and the inventory is now worth an estimated £3 million. The inventory is most likely reported on the balance sheet at:
A. £550,000.
B. £1,000,000.
C. £3,000,000.
5. Fernando’s Pasta purchased inventory and later wrote it down. The current net realizable value is higher than the value when written down. Fernando’s inventory balance will most likely be:
A. higher if it complies with IFRS.
B. higher if it complies with U.S. GAAP.
C. the same under U.S. GAAP and IFRS.
For questions 6 through 17, assume the companies use a periodic inventory system.
6. Cinnamon Corp. started business in 2007 and uses the weighted average cost method. During 2007, it purchased 45,000 units of inventory at €10 each and sold 40,000 units for €20 each. In 2008, it purchased another 50,000 units at €11 each and sold 45,000 units for €22 each. Its 2008 cost of sales (€ thousands) was closest to:
A. €490.
B. €491.
C. €495.
7. Zimt AG started business in 2007 and uses the FIFO method. During 2007, it purchased 45,000 units of inventory at €10 each and sold 40,000 units for €20 each. In 2008, it purchased another 50,000 units at €11 each and sold 45,000 units for €22 each. Its 2008 ending inventory balance (€ thousands) was closest to:
A. €105.
B. €109.
C. €110.
8. Zimt AG uses the FIFO method, and Nutmeg Inc. uses the LIFO method. Compared to the cost of replacing the inventory, during periods of rising prices, the cost of sales reported by:
A. Zimt is too low.
B. Nutmeg is too low.
C. Nutmeg is too high.
9. Zimt AG uses the FIFO method, and Nutmeg Inc. uses the LIFO method. Compared to the cost of replacing the inventory, during periods of rising prices the ending inventory balance reported by:
A. Zimt is too high.
B. Nutmeg is too low.
C. Nutmeg is too high.
10. Like many technology companies, TechnoTools operates in an environment of declining prices. Its reported profits will tend to be highest if it accounts for inventory using the:
A. FIFO method.
B. LIFO method.
C. weighted average cost method.
11. Compared to using the weighted average cost method to account for inventory, during a period in which prices are generally rising, the current ratio of a company using the FIFO method would most likely be:
A. lower.
B. higher.
C. dependent upon the interaction with accounts payable.
12. Zimt AG wrote down the value of its inventory in 2007 and reversed the write-down in 2008. Compared to the ratios that would have been calculated if the write-down had never occurred, Zimt’s reported 2007:
A. current ratio was too high.
B. gross margin was too high.
C. inventory turnover was too high.
13. Zimt AG wrote down the value of its inventory in 2007 and reversed the write-down in 2008. Compared to the results the company would have reported if the write-down had never occurred, Zimt’s reported 2008:
A. profit was overstated.
B. cash flow from operations was overstated.
C. year-end inventory balance was overstated.
14. Compared to a company that uses the FIFO method, during periods of rising prices a company that uses the LIFO method will most likely appear more:
A. liquid.
B. efficient.
C. profitable.
15. Nutmeg Inc. uses the LIFO method to account for inventory. During years in which inventory unit costs are generally rising and in which the company purchases more inventory than it sells to customers, its reported gross profit margin will most likely be:
A. lower than it would be if the company used the FIFO method.
B. higher than it would be if the company used the FIFO method.
C. about the same as it would be if the company used the FIFO method.
16. Compared to using the FIFO method to account for inventory, during periods of rising prices, a company using the LIFO method is most likely to report higher:
A. net income.
B. cost of sales.
C. income taxes.
17. Carey Company adheres to U.S. GAAP, whereas Jonathan Company adheres to IFRS. It is least likely that:
A. Carey has reversed an inventory write-down.
B. Jonathan has reversed an inventory write-down.
C. Jonathan and Carey both use the FIFO inventory accounting method.
The following information relates to Questions 18 through 25.20
Hans Annan, CFA, a food and beverage analyst, is reviewing Century Chocolate’s inventory policies as part of his evaluation of the company. Century Chocolate, based in Switzerland, manufactures chocolate products and purchases and resells other confectionery products to complement its chocolate line. Annan visited Century Chocolate’s manufacturing facility last year. He learned that cacao beans, imported from Brazil, represent the most significant raw material and that the work-in-progress inventory consists primarily of three items: roasted cacao beans, a thick paste produced from the beans (called chocolate liquor), and a sweetened mixture that needs to be “conched” to produce chocolate. On the tour, Annan learned that the conching process ranges from a few hours for lower-quality products to six days for the highest-quality chocolates. While there, Annan saw the facility’s climate-controlled area where manufactured finished products (cocoa and chocolate) and purchased finished goods are stored prior to shipment to customers. After touring the facility, Annan had a discussion with Century Chocolate’s CFO regarding the types of costs that were included in each inventory category.
Annan has asked his assistant, Joanna Kern, to gather some preliminary information regarding Century Chocolate’s financial statements and inventories. He also asked Kern to calculate the inventory turnover ratios for Century Chocolate and another chocolate manufacturer for the most recent five years. Annan does not know Century Chocolate’s most direct competitor, so he asks Kern to do some research and select the most appropriate company for the ratio comparison.
Kern reports back that Century Chocolate prepares its financial statements in accordance with IFRS. She tells Annan that the policy footnote states that raw materials and purchased finished goods are valued at purchase cost whereas work in progress and manufactured finished goods are valued at production cost. Raw material inventories and purchased finished goods are accounted for using the FIFO (first-in, first-out) method, and the weighted average cost method is used for other inventories. An allowance is established when the net realizable value of any inventory item is lower than the value calculated.
Kern provides Annan with the selected financial statements and inventory data for Century Chocolate shown in Exhibits A through E. The ratio exhibit Kern prepared compares Century Chocolate’s inventory turnover ratios to those of Gordon’s Goodies, a U.S.-based company. Annan returns the exhibit and tells Kern to select a different competitor that reports using IFRS rather than U.S. GAAP. During this initial review, Annan asks Kern why she has not indicated whether Century Chocolate uses a perpetual or a periodic inventory system. Kern replies that she learned that Century Chocolate uses a perpetual system but did not include this information in her report because inventory values would be the same under either a perpetual or periodic inventory system. Annan tells Kern she is wrong and directs her to research the matter.
EXHIBIT A Century Chocolate Income Statements (CHF millions)
| For Years Ended 31 December | 2009 | 2008 |
| Sales | 95,290 | 93,248 |
| Cost of sales | −41,043 | −39,047 |
| Marketing, administration, and other expenses | −35,318 | −42,481 |
| Profit before taxes | 18,929 | 11,720 |
| Taxes | −3,283 | −2,962 |
| Profit for the period | 15,646 | 8,758 |
EXHIBIT B Century Chocolate Balance Sheets (CHF millions)
| For Years Ended 31 December | 2009 | 2008 |
| Cash, cash equivalents, and short-term investments | 6,190 | 8,252 |
| Trade receivables and related accounts, net | 11,654 | 12,910 |
| Inventories, net | 8,100 | 7,039 |
| Other current assets | 2,709 | 2,812 |
| Total current assets | 28,653 | 31,013 |
| Property, plant, and equipment, net | 18,291 | 19,130 |
| Other noncurrent assets | 45,144 | 49,875 |
| Total assets | 92,088 | 100,018 |
| Trade and other payables | 10,931 | 12,299 |
| Other current liabilities | 17,873 | 25,265 |
| Total current liabilities | 28,804 | 37,564 |
| Noncurrent liabilities | 15,672 | 14,963 |
| Total liabilities | 44,476 | 52,527 |
| Equity | ||
| Share capital | 332 | 341 |
| Retained earnings and other reserves | 47,280 | 47,150 |
| Total equity | 47,612 | 47,491 |
| Total liabilities and shareholders’ equity | 92,088 | 100,018 |
EXHIBIT C Century Chocolate Supplementary Footnote Disclosures: Inventories (CHF millions)
| For Years Ended 31 December | 2009 | 2008 |
| Raw Materials | 2,154 | 1,585 |
| Work in Progress | 1,061 | 1,027 |
| Finished Goods | 5,116 | 4,665 |
| Total inventories before allowance | 8,331 | 7,277 |
| Allowance for write-downs to net realizable value | −231 | −238 |
| Total inventories net of allowance | 8,100 | 7,039 |
EXHIBIT D Century Chocolate Inventory Record for Purchased Lemon Drops
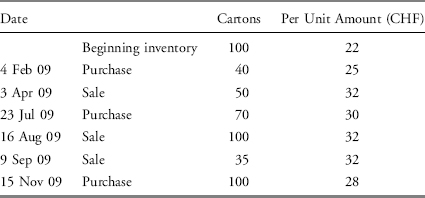
EXHIBIT E Century Chocolate Net Realizable Value Information for Black Licorice Jelly Beans
| 2009 | 2008 | |
| FIFO cost of inventory at 31 December (CHF) | 314,890 | 374,870 |
| Ending inventory at 31 December (kilograms) | 77,750 | 92,560 |
| Cost per kilogram (CHF) | 4.05 | 4.05 |
| Net realizable value (CHF per kilogram) | 4.20 | 3.95 |
While Kern is revising her analysis, Annan reviews the most recent month’s Cocoa Market Review from the International Cocoa Organization. He is drawn to the statement that “the ICCO daily price, averaging prices in both futures markets, reached a 29-year high in US$ terms and a 23-year high in SDRs terms (the SDR unit comprises a basket of major currencies used in international trade: US$, Euro, Pound Sterling and Yen).” Annan makes a note that he will need to factor the potential continuation of this trend into his analysis.
18. The costs least likely to be included by the CFO as inventory are:
A. storage costs for the chocolate liquor.
B. excise taxes paid to the government of Brazil for the cacao beans.
C. storage costs for chocolate and purchased finished goods awaiting shipment to customers.
19. What is the most likely justification for Century Chocolate’s choice of inventory valuation method for its finished goods?
A. It is the preferred method under IFRS.
B. It allocates the same per unit cost to both cost of sales and inventory.
C. Ending inventory reflects the cost of goods purchased most recently.
20. In Kern’s comparative ratio analysis, the 2009 inventory turnover ratio for Century Chocolate is closest to:
A. 5.07.
B. 5.42.
C. 5.55.
21. The most accurate statement regarding Annan’s reasoning for requiring Kern to select a competitor that reports under IFRS for comparative purposes is that under U.S. GAAP:
A. fair values are used to value inventory.
B. the LIFO method is permitted to value inventory.
C. the specific identification method is permitted to value inventory.
22. Annan’s statement regarding the perpetual and periodic inventory systems is most significant when which of the following costing systems is used?
A. LIFO.
B. FIFO.
C. Specific identification.
23. Using the inventory record for purchased lemon drops shown in Exhibit D, the cost of sales for 2009 will be closest to:
A. CHF 3,550.
B. CHF 4,550.
C. CHF 4,850.
24. Ignoring any tax effect, the 2009 net realizable value reassessment for the black licorice jelly beans will most likely result in:
A. an increase in gross profit of CHF 9,256.
B. an increase in gross profit of CHF 11,670.
C. no impact on cost of sales because under IFRS, write-downs cannot be reversed.
25. If the trend noted in the ICCO report continues and Century Chocolate plans to maintain constant or increasing inventory quantities, the most likely impact on Century Chocolate’s financial statements related to its raw materials inventory will be:
A. a cost of sales that more closely reflects current replacement values.
B. a higher allocation of the total cost of goods available for sale to cost of sales.
C. a higher allocation of the total cost of goods available for sale to ending inventory.
The following information relates to Questions 26 through 31.21
John Martinson, CFA, is an equity analyst with a large pension fund. His supervisor, Linda Packard, asks him to write a report on Karp Inc. Karp prepares its financial statements in accordance with U.S. GAAP. Packard is particularly interested in the effects of the company’s use of the LIFO method to account for its inventory. For this purpose, Martinson collects the financial data presented in Exhibits F and G.
EXHIBIT F Balance Sheet Information (US$ millions)
| As of 31 December | 2009 | 2008 |
| Cash and cash equivalents | 172 | 157 |
| Accounts receivable | 626 | 458 |
| Inventories | 620 | 539 |
| Other current assets | 125 | 65 |
| Total current assets | 1,543 | 1,219 |
| Property and equipment, net | 3,035 | 2,972 |
| Total assets | 4,578 | 4,191 |
| Total current liabilities | 1,495 | 1,395 |
| Long-term debt | 644 | 604 |
| Total liabilities | 2,139 | 1,999 |
| Common stock and paid in capital | 1,652 | 1,652 |
| Retained earnings | 787 | 540 |
| Total shareholders’ equity | 2,439 | 2,192 |
| Total liabilities and shareholders’ equity | 4,578 | 4,191 |
EXHIBIT G Income Statement Information (US$ millions)
| For Years Ended 31 December | 2009 | 2008 |
| Sales | 4,346 | 4,161 |
| Cost of goods sold | 2,211 | 2,147 |
| Depreciation and amortization expense | 139 | 119 |
| Selling, general, and administrative expense | 1,656 | 1,637 |
| Interest expense | 31 | 18 |
| Income tax expense | 62 | 48 |
| Net income | 247 | 192 |
Martinson finds the following information in the notes to the financial statements:
- The LIFO reserves as of 31 December 2009 and 2008 are $155 million and $117 million respectively; and
- The effective income tax rate applicable to Karp for 2009 and earlier periods is 20%.
26. If Karp had used FIFO instead of LIFO, the amount of inventory reported as of 31 December 2009 would have been closest to:
A. $465 million.
B. $658 million.
C. $775 million.
27. If Karp had used FIFO instead of LIFO, the amount of cost of goods sold reported by Karp for the year ended 31 December 2009 would have been closest to:
A. $2,056 million.
B. $2,173 million.
C. $2,249 million.
28. If Karp had used FIFO instead of LIFO, its reported net income for the year ended 31 December 2009 would have been higher by an amount closest to:
A. $30 million.
B. $38 million.
C. $155 million.
29. If Karp had used FIFO instead of LIFO, Karp’s retained earnings as of 31 December 2009 would have been higher by an amount closest to:
A. $117 million.
B. $124 million.
C. $155 million.
30. If Karp had used FIFO instead of LIFO, which of the following ratios computed as of 31 December 2009 would most likely have been lower?
A. cash ratio
B. current ratio
C. gross profit margin
31. If Karp had used FIFO instead of LIFO, its debt to equity ratio computed as of 31 December 2009 would have:
A. increased.
B. decreased.
C. remained unchanged.
The following information relates to Questions 32 through 37.22
Robert Groff, an equity analyst, is preparing a report on Crux Corp. As part of his report, Groff makes a comparative financial analysis between Crux and its two main competitors, Rolby Corp. and Mikko Inc. Crux and Mikko report under U.S. GAAP and Rolby reports under IFRS.
Groff gathers information on Crux, Rolby, and Mikko. The relevant financial information he compiles is in Exhibit H. Some information on the industry is in Exhibit I.
EXHIBIT H Selected Financial Information (US$ millions)
EXHIBIT I Industry Information
To compare the financial performance of the three companies, Groff decides to convert LIFO figures into FIFO figures, and adjust figures to assume no valuation allowance is recognized by any company.
After reading Groff’s draft report, his supervisor, Rachel Borghi, asks him the following questions:
Question 1: Which company’s gross profit margin would best reflect current costs of the industry?
Question 2: Would Rolby’s valuation method show a higher gross profit margin than Crux’s under an inflationary, a deflationary, or a stable price scenario?
Question 3: Which group of ratios usually appears more favorable with an inventory write-down?
32. Crux’s inventory turnover ratio computed as of 31 December 2009, after the adjustments suggested by Groff, is closest to:
A. 5.67.
B. 5.83.
C. 6.13.
33. Rolby’s net profit margin for the year ended 31 December 2009, after the adjustments suggested by Groff, is closest to:
A. 6.01%.
B. 6.20%.
C. 6.28%.
34. Compared with its unadjusted debt-to-equity ratio, Mikko’s debt-to-equity ratio as of 31 December 2009, after the adjustments suggested by Groff, is:
A. lower.
B. higher.
C. the same.
35. The best answer to Borghi’s Question 1 is:
A. Crux’s.
B. Rolby’s.
C. Mikko’s.
36. The best answer to Borghi’s Question 2 is:
A. stable.
B. inflationary.
C. deflationary.
37. The best answer to Borghi’s Question 3 is:
A. Activity ratios.
B. Solvency ratios.
C. Profitability ratios.
The following information relates to Questions 38 through 45.23
ZP Corporation is a (hypothetical) multinational corporation headquartered in Japan that trades on numerous stock exchanges. ZP prepares its consolidated financial statements in accordance with U.S. GAAP. Excerpts from ZP’s 2009 annual report are shown in Exhibits J–L.
EXHIBIT J Consolidated Balance Sheets (¥ millions)
| Year Ended 31 December | 2008 | 2009 |
| Current assets | ||
| Cash and cash equivalents | ¥542,849 | ¥814,760 |
| ⋮ | ⋮ | ⋮ |
| Inventories | 608,572 | 486,465 |
| ⋮ | ⋮ | ⋮ |
| Total current assets | 4,028,742 | 3,766,309 |
| ⋮ | ⋮ | ⋮ |
| Total assets | ¥10,819,440 | ¥9,687,346 |
| ⋮ | ⋮ | ⋮ |
| Total current liabilities | ¥3,980,247 | ¥3,529,765 |
| ⋮ | ⋮ | ⋮ |
| Total long-term liabilities | 2,663,795 | 2,624,002 |
| Minority interest in consolidated subsidiaries | 218,889 | 179,843 |
| Total shareholders’ equity | 3,956,509 | 3,353,736 |
| Total liabilities and shareholders’ equity | ¥10,819,440 | ¥9,687,346 |
EXHIBIT K Consolidated Statements of Income (¥ millions)
EXHIBIT L Selected Disclosures in the 2009 Annual Report
Management’s Discussion and Analysis of Financial Condition and Results of Operations
“Cost reduction efforts were offset by increased prices of raw materials, other production materials and parts.”. . .“Inventories decreased during fiscal 2009 by ¥122.1 billion, or 20.1%, to ¥486.5 billion. This reflects the impacts of decreased sales volumes and fluctuations in foreign currency translation rates.”
Management and Corporate Information Risk Factors
Industry and Business Risks
The worldwide market for our products is highly competitive. ZP faces intense competition from other manufacturers in the respective markets in which it operates. Competition has intensified due to the worldwide deterioration in economic conditions. In addition, competition is likely to further intensify because of continuing globalization, possibly resulting in industry reorganization. Factors affecting competition include product quality and features, the amount of time required for innovation and development, pricing, reliability, safety, economy in use, customer service, and financing terms. Increased competition may lead to lower unit sales and excess production capacity and excess inventory. This may result in a further downward price pressure.
ZP’s ability to adequately respond to the recent rapid changes in the industry and to maintain its competitiveness will be fundamental to its future success in maintaining and expanding its market share in existing and new markets.
Notes to Consolidated Financial Statements
2. Summary of significant accounting policies: Inventories.
Inventories are valued at cost, not in excess of market. Cost is determined on the “average-cost” basis, except for the cost of finished products carried by certain subsidiary companies which is determined “last-in, first-out” (“LIFO”) basis. Inventories valued on the LIFO basis totaled ¥94,578 million and ¥50,037 million at 31 December 2008 and 2009, respectively. Had the “first-in, first-out” basis been used for those companies using the LIFO basis, inventories would have been ¥10,120 million and ¥19,660 million higher than reported at 31 December 2008 and 2009, respectively.
9. Inventories:
Inventories consist of the following:
| Year Ended 31 December (Yen in millions) | 2008 | 2009 |
| Finished goods | ¥403,856 | ¥291,977 |
| Raw materials | 99,869 | 85,966 |
| Work in process | 79,979 | 83,890 |
| Supplies and other | 24,868 | 24,632 |
| ¥608,572 | ¥486,465 |
38. The MD&A indicated that the prices of raw material, other production materials, and parts increased. Based on the inventory valuation methods described in Note 2, which inventory classification would least accurately reflect current prices?
A. Raw materials
B. Finished goods
C. Work in process
39. The 2008 inventory value as reported on the 2009 consolidated balance sheet if the company had used the FIFO inventory valuation method instead of the LIFO inventory valuation method for a portion of its inventory would be closest to:
A. ¥104,698 million.
B. ¥506,125 million.
C. ¥618,692 million.
40. What is the least likely reason why ZP may need to change its accounting policies regarding inventory at some point after 2009?
A. The U.S. SEC is likely to require companies to use the same inventory valuation method for all inventories.
B. The U.S. SEC is likely to prohibit the use of one of the methods ZP currently uses for inventory valuation.
C. One of the inventory valuation methods used for U.S. tax purposes may be repealed as an acceptable method.
41. If ZP had prepared its financial statement in accordance with IFRS, the inventory turnover ratio (using average inventory) for 2009 would be:
A. lower.
B. higher.
C. the same.
42. Inventory levels decreased from 2008 to 2009 for all of the following reasons except:
A. LIFO liquidation.
B. sales volume decreased.
C. fluctuations in foreign currency translation rates.
43. Which observation is most likely a result of looking only at the information reported in Note 9?
A. Increased competition has led to lower unit sales.
B. There have been significant price increases in supplies.
C. Management expects a further downturn in sales during 2010.
44. Note 2 indicates that, “Inventories valued on the LIFO basis totaled ¥94,578 million and ¥50,037 million at 31 December 2008 and 2009, respectively.” Based on this, the LIFO reserve should most likely:
A. increase.
B. decrease.
C. remain the same.
45. The Industry and Business Risk excerpt states that, “Increased competition may lead to lower unit sales and excess production capacity and excess inventory. This may result in a further downward price pressure.” The downward price pressure could lead to inventory that is valued above current market prices or net realizable value. Any write-downs of inventory are least likely to have a significant effect on the inventory valued using:
A. weighted average cost.
B. first-in, first-out (FIFO).
C. last-in, first-out (LIFO).
1Other classifications are possible. Inventory classifications should be appropriate to the entity.
2This category is commonly referred to as work in process under U.S. GAAP.
3Typically, cost of sales is IFRS terminology and cost of goods sold is U.S. GAAP terminology.
4International Accounting Standard (IAS) 2 [Inventories].
5Financial Accounting Standards Board Accounting Standards Codification (FASB ASC) Topic 330 [Inventory].
6International Accounting Standard (IAS) 2 [Inventories].
7Fixed production overhead costs (depreciation, factory maintenance, and factory management and administration) represent indirect costs of production that remain relatively constant regardless of the volume of production. Variable production overhead costs are indirect production costs (indirect labor and materials) that vary with the volume of production.
8FASB Accounting Standards Codification™ (ASC) Topic 330 [Inventory].
9For example, if a clothing manufacturer produces both a retail line and one-of-a-kind designer garments, the retail line might be valued using FIFO and the designer garments using specific identification.
10This typically results from a reduction in inventory units and is referred to as LIFO liquidation. LIFO liquidation is discussed in Section 4.2.
11IAS 8 [Accounting Policies, Changes in Accounting Estimates and Errors].
12FASB ASC Topic 250 [Accounting Changes and Error Corrections].
13IAS 2 paragraphs 28–33 [Inventories − Net realizable value].
14Frequently, rather than writing inventory down directly, an inventory valuation allowance account is used. The allowance account is netted with the inventory accounts to arrive at the carrying amount that appears on the balance sheet.
15FASB ASC Section 330-10-35 [Inventory − Overall − Subsequent Measurement].
16As of this writing, the Volvo line of automobiles is not under the control and management of the Volvo Group.
17 Days of inventory on hand is also referred to as days in inventory and average inventory days outstanding.
18This reduction is often referred to as a charge. An accounting charge is the recognition of a loss or expense. In this case, the charge is attributable to the impairment of assets.
19 Cost approximates cost on a first-in, first-out basis.
20Item set developed by Karen Rubsam, CFA (Fountain Hills, Arizona, USA).
21Item set developed by Rodrigo Ribeiro, CFA (Montevideo, Uruguay).
22Item set developed by Rodrigo Ribeiro, CFA (Montevideo, Uruguay).
23Item set developed by Karen O’Connor Rubsam, CFA (Fountain Hills, Arizona, U.S.A.).