
CHAPTER 4
UNDERSTANDING INCOME STATEMENTS
After completing this chapter, you will be able to do the following:
- Describe the components of the income statement and alternative presentation formats of that statement.
- Describe the general principles of revenue recognition and accrual accounting, specific revenue recognition applications (including accounting for long-term contracts, installment sales, barter transactions, gross and net reporting of revenue), and the implications of revenue recognition principles for financial analysis.
- Calculate revenue given information that might influence the choice of revenue recognition method.
- Describe the general principles of expense recognition, specific expense recognition applications, and the implications of expense recognition choices for financial analysis.
- Describe the financial reporting treatment and analysis of nonrecurring items (including discontinued operations, extraordinary items, unusual or infrequent items) and changes in accounting standards.
- Distinguish between the operating and nonoperating components of the income statement.
- Describe how earnings per share is calculated and calculate and interpret a company’s earnings per share (both basic and diluted earnings per share) for both simple and complex capital structures.
- Distinguish between dilutive and antidilutive securities, and describe the implications of each for the earnings per share calculation.
- Convert income statements to common-size income statements.
- Evaluate a company’s financial performance using common-size income statements and financial ratios based on the income statement.
- Describe, calculate, and interpret comprehensive income.
- Describe other comprehensive income, and identify the major types of items included in it.
The income statement presents information on the financial results of a company’s business activities over a period of time. The income statement communicates how much revenue the company generated during a period and what costs it incurred in connection with generating that revenue. The basic equation underlying the income statement, ignoring gains and losses, is Revenue minus Expenses equals Net income. The income statement is also sometimes referred to as the “statement of operations,”“statement of earnings,” or “profit and loss (P&L) statement.” Under International Financial Reporting Standards (IFRS), the income statement may be presented as a separate statement followed by a statement of comprehensive income that begins with the profit or loss from the income statement or as a section of a single statement of comprehensive income.1 Under U.S. generally accepted accounting principles (U.S. GAAP), the income statement may be presented as a separate statement or as a section of a single statement of income and comprehensive income.2 This chapter focuses on the income statement, but also discusses comprehensive income (profit or loss from the income statement plus other comprehensive income).
Investment analysts intensely scrutinize companies’ income statements.3 Equity analysts are interested in them because equity markets often reward relatively high- or low-earnings growth companies with above-average or below-average valuations, respectively, and because inputs into valuation models often include estimates of earnings. Fixed-income analysts examine the components of income statements, past and projected, for information on companies’ abilities to make promised payments on their debt over the course of the business cycle. Corporate financial announcements frequently emphasize information reported in income statements, particularly earnings, more than information reported in the other financial statements.
This chapter is organized as follows: Section 2 describes the components of the income statement and its format. Section 3 describes basic principles and selected applications related to the recognition of revenue, and Section 4 describes basic principles and selected applications related to the recognition of expenses. Section 5 covers nonrecurring items and nonoperating items. Section 6 explains the calculation of earnings per share. Section 7 introduces income statement analysis, and Section 8 explains comprehensive income and its reporting. A summary of the key points and practice problems in the CFA Institute multiple-choice format complete the chapter.
2. COMPONENTS AND FORMAT OF THE INCOME STATEMENT
On the top line of the income statement, companies typically report revenue. Revenue generally refers to amounts charged (and expected to be received) for the delivery of goods or services in the ordinary activities of a business. The term net revenue means that the revenue number is reported after adjustments (e.g., for cash or volume discounts, or for estimated returns). Revenue may be called sales or turnover.4 Exhibits 4-1 and 4-2 show the income statements for Groupe Danone (Euronext Paris: BN), a French food manufacturer, and Kraft Foods (NYSE:KFT), a U.S. food manufacturer.5 For the year ended 31 December 2009, Danone reports €14.98 billion of net revenue, whereas Kraft reports $40.39 billion of net revenue.
EXHIBIT 4-1 Groupe Danone Consolidated Income Statement (in millions of euros)
| Year Ended 31 December | ||
| 2008 | 2009 | |
| Net revenue | 15,220 | 14,982 |
| Cost of goods sold | (7,172) | (6,749) |
| Selling expenses | (4,197) | (4,212) |
| General and administrative expenses | (1,297) | (1,356) |
| Research and development expenses | (198) | (206) |
| Other revenue (expense) | (86) | (165) |
| Trading operating income | 2,270 | 2,294 |
| Other operating income (expense) | (83) | 217 |
| Operating income | 2,187 | 2,511 |
| Interest revenue | 58 | 76 |
| Interest expense | (497) | (340) |
| Cost of net debt | (439) | (264) |
| Other financial revenue (expense) | (145) | (225) |
| Income before tax | 1,603 | 2,022 |
| Income tax | (443) | (424) |
| Income from fully consolidated companies | 1,160 | 1,598 |
| Share of profits of associates | 62 | (77) |
| Net income from continuing operations | 1,222 | 1,521 |
| Net income from discontinued operations | 269 | — |
| NET INCOME | 1,491 | 1,521 |
| Attributable to the Group | 1,313 | 1,361 |
| Attributable to minority interests | 178 | 160 |
EXHIBIT 4-2 Kraft Foods and Subsidiaries Consolidated Statements of Earnings (in millions of dollars, except per-share data)
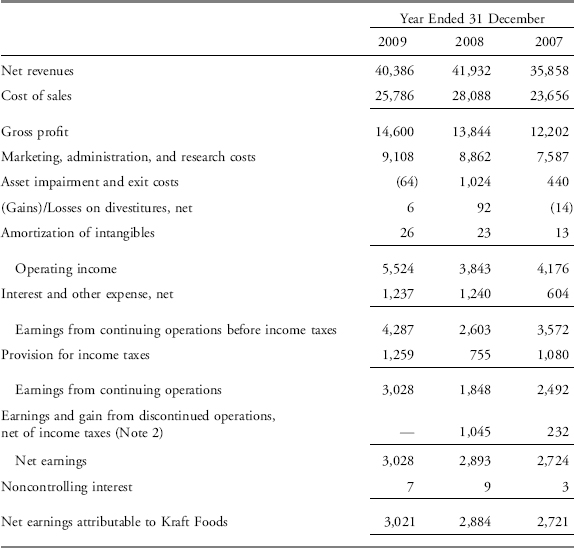
Note that Danone lists the years in increasing order from left to right with the most recent year in the right-most column, whereas Kraft lists the years in decreasing order with the most recent year listed in the left-most column. Different orderings of chronological information are common. Differences in presentations of items, such as expenses, are also common. Expenses reflect outflows, depletions of assets, and incurrences of liabilities in the course of the activities of a business. Expenses may be grouped and reported in different formats, subject to some specific requirements. For example, Danone reports research and development expenses as a separate line item whereas Kraft combines research costs with marketing and administration costs and reports the total in a single line item.
Another difference is how the companies indicate that an amount on the income statement results in a reduction in net income. Danone shows expenses, such as cost of goods sold and selling expenses, in parentheses to explicitly indicate that these are subtracted from revenue and reduce net income. Kraft, on the other hand, does not place cost of sales in parentheses. Rather, Kraft assumes that the user implicitly understands that this is an expense and is subtracted in arriving at gross profit, subtotals such as operating earnings, and, ultimately, innet income. In general, companies may or may not enclose an amount in parentheses (or use a negative sign) to indicate that it is a reduction in net income. Furthermore, within a list of items that normally reduce net income, an item that increases net income may be shown as a negative. In this case, the item is actually added rather than subtracted in calculating net income. In summary, because there is flexibility in how companies may present the income statement, the analyst should always verify the order of years, how expenses are grouped and reported, and how to treat items presented as negatives.
At the bottom of the income statement, companies report net income (companies may use other terms such as “net earnings” or “profit or loss”). For 2009, Danone reports €1,521 million of net income and Kraft reports $3,028 million of net earnings. Net income is often referred to as the “bottom line.” The basis for this expression is that net income is the final—or bottom—line item in an income statement. Because net income is often viewed as the single most relevant number to describe a company’s performance over a period of time, the term “bottom line” sometimes is used in business to refer to any final or most relevant result.
Despite this customary terminology, note that the companies both present another item below net income: information about how much of that net income is attributable to the company itself and how much of that income is attributable to minority interests, or noncontrolling interests. Danone and Kraft both consolidate subsidiaries over which they have control. Consolidation means that they include all of the revenues and expenses of the subsidiaries even if they own less than 100 percent. Minority interest represents the portion of income that “belongs” to minority shareholders of the consolidated subsidiaries, as opposed to the parent company itself. For Danone, €1,361 million of the net income amount is attributable to shareholders of Groupe Danone and €160 million is attributable to minority interests. For Kraft, $3,021 million of the net earnings amount is attributable to the shareholders of Kraft Foods and $7 million is attributable to the noncontrolling interest.
Net income also includes gains and losses, which are increases and decreases in economic benefits, respectively, which may or may not arise in the ordinary activities of the business. For example, when a manufacturing company sells its products, these transactions are reported as revenue, and the costs incurred to generate these revenues are expenses and are presented separately. However, if a manufacturing company sells surplus land that is not needed, the transaction is reported as a gain or a loss. The amount of the gain or loss is the difference between the carrying value of the land and the price at which the land is sold. For example, in Exhibit 4-2, Kraft reports a loss (proceeds, net of carrying value) of $6 million on divestitures in fiscal 2009. Kraft discloses in the notes to consolidated financial statements that the assets sold included a nutritional energy bar operation in the United States, a juice operation in Brazil, and a plant in Spain.
The definition of income encompasses both revenue and gains and the definition of expenses encompasses both expenses that arise in the ordinary activities of the business and losses.6 Thus, net income (profit or loss) can be defined as: (a) income minus expenses, or equivalently (b) revenue plus other income plus gains minus expenses, or equivalently (c) revenue plus other income plus gains minus expenses in the ordinary activities of the business minus other expenses, and minus losses. The last definition can be rearranged as follows: net income equals (i) revenue minus expenses in the ordinary activities of the business, plus (ii) other income minus other expenses, plus (iii) gains minus losses.
In addition to presenting the net income, income statements also present items, including subtotals, that are significant to users of financial statements. Some of the items are specified by IFRS but other items are not specified.7 Certain items, such as revenue, finance costs, and tax expense, are required to be presented separately on the face of the income statement. IFRS additionally require that line items, headings, and subtotals relevant to understanding the entity’s financial performance should be presented even if not specified. Expenses may be grouped together either by their nature or function. Grouping together expenses such as depreciation on manufacturing equipment and depreciation on administrative facilities into a single line item called “depreciation” is an example of a grouping by nature of the expense. An example of grouping by function would be grouping together expenses into a category such as cost of goods sold, which may include labor and material costs, depreciation, some salaries (e.g., salespeople’s), and other direct sales-related expenses.8 Both Danone and Kraft present their expenses by function, which is sometimes referred to “cost of sales” method.
One subtotal often shown in an income statement is gross profit or gross margin (that is revenue less cost of sales). When an income statement shows a gross profit subtotal, it is said to use a multistep format rather than a single-step format. The Kraft Foods income statement is an example of the multistep format, whereas the Groupe Danone income statement is in a single-step format. For manufacturing and merchandising companies, gross profit is a relevant item and is calculated as revenue minus the cost of the goods that were sold. For service companies, gross profit is calculated as revenue minus the cost of services that were provided. In summary, gross profit is the amount of revenue available after subtracting the costs of delivering goods or services. Other expenses related to running the business are subtracted after gross profit.
Another important subtotal which may be shown on the income statement is operating profit (or, synonymously, operating income). Operating profit results from deducting operating expenses such as selling, general, administrative, and research and development expenses from gross profit. Operating profit reflects a company’s profits on its usual business activities before deducting taxes, and for nonfinancial companies, before deducting interest expense. For financial companies, interest expense would be included in operating expenses and subtracted in arriving at operating profit because it relates to the operating activities for such companies. For some companies composed of a number of separate business segments, operating profit can be useful in evaluating the performance of the individual business segments, because interest and tax expenses may be more relevant at the level of the overall company rather than an individual segment level. The specific calculations of gross profit and operating profit may vary by company, and a reader of financial statements can consult the notes to the statements to identify significant variations across companies.
Operating profit is sometimes referred to as EBIT (earnings before interest and taxes). However, operating profit and EBIT are not necessarily the same. Note that in both Exhibits 4-1 and 4-2, interest and taxes do not represent the only differences between earnings (net income, net earnings) and operating income. For example, both companies separately report some income from discontinued operations.
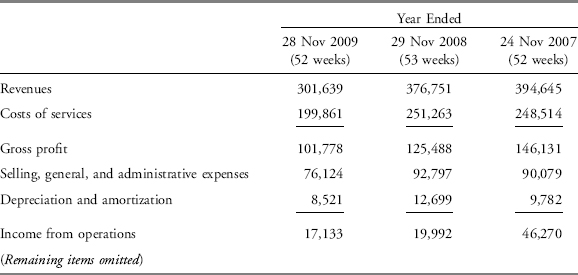
Exhibit 4-3 shows an excerpt from the income statement of CRA International (NASDAQ GS: CRAI), a company providing management consulting services. Accordingly, CRA deducts cost of services (rather than cost of goods) from revenues to derive gross profit. CRA’s fiscal year ends on the last Saturday in November, and periodically (for example in 2008) its fiscal year will contain 53 weeks rather than 52 weeks. Although the extra week is likely immaterial in computing year-to-year growth rates, it may have a material impact on a quarter containing the extra week. In general, an analyst should be alert to the effect of an extra week when making historical comparisons and forecasting future performance.
EXHIBIT 4-3 CRA International Inc. Consolidated Statements of Income (Excerpt) (in thousands of dollars, except per-share data)
Exhibits 4-1, 4-2, and 4-3 illustrate basic points about the income statement, including variations across the statements—some of which depend on the industry and/or country, and some of which reflect differences in accounting policies and practices of a particular company. In addition, some differences within an industry are primarily differences in terminology, whereas others are more fundamental accounting differences. Notes to the financial statements are helpful in identifying such differences.
Having introduced the components and format of an income statement, the next objective is to understand the actual reported numbers in it. To accurately interpret reported numbers, the analyst needs to be familiar with the principles of revenue and expense recognition—that is, how revenue and expenses are measured and attributed to a given accounting reporting period.
Revenue is the top line in an income statement, so we begin the discussion of line items in the income statement with revenue recognition. A first task is to explain some relevant accounting terminology.
The terms revenue, sales, gains, losses, and net income (profit, net earnings) have been briefly defined. The IASB Framework for the Preparation and Presentation of Financial Statements (referred to hereafter as “the Framework”) further defines and discusses these income statement items. The Framework explains that profit is a frequently used measure of performance and is composed of income and expenses.9 It defines income as follows:
Income is increases in economic benefits during the accounting period in the form of inflows or enhancements of assets or decreases of liabilities that result in increases in equity, other than those relating to contributions from equity participants.10
In IFRS, the term “income” includes revenue and gains. Gains are similar to revenue, but they typically arise from secondary or peripheral activities rather than from a company’s primary business activities. For example, for a restaurant, the sale of surplus restaurant equipment for more than its carrying value is referred to as a gain rather than as revenue. Similarly, a loss typically arises from secondary activities. Gains and losses may be considered part of operating activities (e.g., a loss due to a decline in the value of inventory) or may be considered part of nonoperating activities (e.g., the sale of nontrading investments).
In the following simple hypothetical scenario, revenue recognition is straightforward: a company sells goods to a buyer for cash and does not allow returns, so the company recognizes revenue when the exchange of goods for cash takes place and measures revenue at the amount of cash received. In practice, however, determining when revenue should be recognized and at what amount is considerably more complex for reasons discussed in the following sections.
3.1. General Principles
An important aspect concerning revenue recognition is that it can occur independently of cash movements. For example, assume a company sells goods to a buyer on credit, so does not actually receive cash until some later time. A fundamental principle of accrual accounting is that revenue is recognized (reported on the income statement) when it is earned, so the company’s financial records reflect revenue from the sale when the risk and reward of ownership is transferred; this is often when the company delivers the goods or services. If the delivery was on credit, a related asset, such as trade or accounts receivable, is created. Later, when cash changes hands, the company’s financial records simply reflect that cash has been received to settle an account receivable. Similarly, there are situations when a company receives cash in advance and actually delivers the product or service later, perhaps over a period of time. In this case, the company would record a liability for unearned revenue when the cash is initially received, and revenue would be recognized as being earned over time as products and services are delivered. An example would be a subscription payment received for a publication that is to be delivered periodically over time.
When to recognize revenue (when to report revenue on the income statement) is a critical issue in accounting.11 IFRS specify that revenue from the sale of goods is to be recognized (reported on the income statement) when the following conditions are satisfied:12
- The entity has transferred to the buyer the significant risks and rewards of ownership of the goods.
- The entity retains neither continuing managerial involvement to the degree usually associated with ownership nor effective control over the goods sold.
- The amount of revenue can be measured reliably.
- It is probable that the economic benefits associated with the transaction will flow to the entity.
- The costs incurred or to be incurred in respect of the transaction can be measured reliably.
In simple words, this basically says revenue is recognized when the seller no longer bears risks with respect to the goods (for example, if the goods were destroyed by fire, it would be a loss to the purchaser), the seller cannot tell the purchaser what to do with the goods, the seller knows what it expects to collect and is reasonably certain of collection, and the seller knows how much the goods cost.
IFRS note that the transfer of the risks and rewards of ownership normally occurs when goods are delivered to the buyer or when legal title to goods transfers. However, as noted by the earlier remaining conditions, physical transfer of goods will not always result in the recognition of revenue. For example, if goods are delivered to a retail store to be sold on consignment and title is not transferred, the revenue would not yet be recognized.13
IFRS specify similar criteria for recognizing revenue for the rendering of services.14 When the outcome of a transaction involving the rendering of services can be estimated reliably, revenue associated with the transaction shall be recognized by reference to the stage of completion of the transaction at the balance sheet date. The outcome of a transaction can be estimated reliably when all the following conditions are satisfied:
- The amount of revenue can be measured reliably.
- It is probable that the economic benefits associated with the transaction will flow to the entity.
- The stage of completion of the transaction at the balance sheet date can be measured reliably.
- The costs incurred for the transaction and the costs to complete the transaction can be measured reliably.
IFRS criteria for recognizing interest, royalties, and dividends are that it is probable that the economic benefits associated with the transaction will flow to the entity and the amount of the revenue can be reliably measured.
U.S. GAAP15 specify that revenue should be recognized when it is “realized or realizable and earned.” The U.S. Securities and Exchange Commission (SEC),16 motivated in part because of the frequency with which overstating revenue occurs in connection with fraud and/or misstatements, provides guidance on how to apply the accounting principles. This guidance lists four criteria to determine when revenue is realized or realizable and earned:
1. There is evidence of an arrangement between buyer and seller. For instance, this would disallow the practice of recognizing revenue in a period by delivering the product just before the end of an accounting period and then completing a sales contract after the period end.
2. The product has been delivered, or the service has been rendered. For instance, this would preclude revenue recognition when the product has been shipped but the risks and rewards of ownership have not actually passed to the buyer.
3. The price is determined, or determinable. For instance, this would preclude a company from recognizing revenue that is based on some contingency.
4. The seller is reasonably sure of collecting money. For instance, this would preclude a company from recognizing revenue when the customer is unlikely to pay.
Companies must disclose their revenue recognition policies in the notes to their financial statements (sometimes referred to as footnotes). Analysts should review these policies carefully to understand how and when a company recognizes revenue, which may differ depending on the types of product sold and services rendered. Exhibit 4-4 presents a portion of the summary of significant accounting policies note that discusses revenue recognition for DaimlerChrysler (DB-F: DAI) from its 2009 annual report, prepared under IFRS.
EXHIBIT 4-4 Excerpt from DaimlerChrysler Notes
Revenue from sales of vehicles, service parts and other related products is recognized when the risks and rewards of ownership of the goods are transferred to the customer, the amount of revenue can be estimated reliably and collectability is reasonably assured. Revenue is recognized net of discounts, cash sales incentives, customer bonuses and rebates granted.
Daimler uses price discounts in response to a number of market and product factors, including pricing actions and incentives offered by competitors, the amount of excess industry production capacity, the intensity of market competition and consumer demand for the product. The Group may offer a variety of sales incentive programs at any point in time, including cash offers to dealers and consumers, lease subsidies which reduce the consumers’ monthly lease payment, or reduced financing rate programs offered to consumers.
An analyst comparing Daimler with another company would likely want to ensure that revenue recognition policies are similar. For example, Daimler notes that it recognizes its revenue net of certain items. Does the comparison company deduct the same items from revenue? Exhibit 4-5 presents excerpts from the 2009 annual report’s notes to the financial statements of Ford Motor Company (NYSE:F) prepared under U.S. GAAP. In Ford’s Note 2, Summary of Accounting Policies, the section titled revenue recognition mentions the criteria and timing of revenue recognition, but not the recognition of revenue net of certain items. In a subsequent section of Note 2, Ford states that its marketing incentives are recognized as revenue reductions. A comparison of the disclosed revenue recognition policies suggests that the companies do have similar revenue recognition policies despite minor differences in presentation.
EXHIBIT 4-5 Excerpt from Ford Motor Company Notes
Revenue Recognition—Automotive Sector
Automotive sales consist primarily of revenue generated from the sale of vehicles. Sales are recorded when the risks and rewards of ownership are transferred to our customers (generally dealers and distributors). For the majority of our sales, this occurs when products are shipped from our manufacturing facilities or delivered to our customers. When vehicles are shipped to customers or vehicle modifiers on consignment, revenue is recognized when the vehicle is sold to the ultimate customer.
[portions omitted]
Marketing Incentives and Interest Supplements
Marketing incentives generally are recognized by the Automotive sector as revenue reductions in Automotive sales. These include customer and dealer cash payments and costs for special financing and leasing programs paid to the Financial Services sector. The revenue reductions are accrued at the later of the date the related vehicle sales to the dealers are recorded or the date the incentive program is both approved and communicated. We generally estimate these accruals using marketing programs that are approved as of the balance sheet date and are expected to be effective at the beginning of the subsequent period. The Financial Services sector identifies payments for special financing and leasing programs as interest supplements or other support costs and recognizes them consistent with the earnings process of the underlying receivable or operating lease.
The topic of revenue recognition remains important and new challenges have evolved, particularly in areas of e-commerce and services such as software development. Standard setters continue to evaluate current revenue recognition standards and issue new guidance periodically to deal with new types of transactions. Additionally, there are occasional special cases for revenue recognition, as discussed in the next section.
3.2. Revenue Recognition in Special Cases
The general principles discussed previously are helpful for dealing with most revenue recognition issues. There are some instances where revenue recognition is more difficult to determine. For example, in limited circumstances, revenue may be recognized before or after goods are delivered or services are rendered, as summarized in Exhibit 4-6.
EXHIBIT 4-6 Revenue Recognition in Special Cases
| Before Goods Are Fully Delivered or Services Completely Rendered | At the Time Goods Are Delivered or Services Rendered | After Goods Are Delivered or Services Rendered |
| For example, with long-term contracts where the outcome can be reliably measured, the percentage-of-completion method is used. | Recognize revenues using normal revenue recognition criteria. | For example, with real estate sales where there is doubt about the buyer’s ability to complete payments, the installment method and cost recovery method are appropriate. |
The following sections discuss revenue recognition in the case of long-term contracts, installment sales, and barter.
3.2.1. Long-Term Contracts
A long-term contract is one that spans a number of accounting periods. Such contracts raise issues in determining when the earnings process has been completed and revenue recognition should occur. How should a company apportion the revenue earned under a long-term contract to each accounting period? If, for example, the contract is a service contract or a licensing arrangement, the company may recognize the revenue on a prorated basis over the period of time of the contract rather than at the end of the contract term. Under IFRS, this may be done using the percentage-of-completion method.17 Under the percentage-of-completion method, revenue is recognized based on the stage of completion of a transaction or contract and is, thus, recognized when the services are rendered. Construction contracts are examples of contracts that may span a number of accounting periods and that may use the percentage-of-completion method.18 IFRS provide that when the outcome of a construction contract can be measured reliably, revenue and expenses should be recognized in reference to the stage of completion. U.S. GAAP have similar requirements for long-term contracts including construction contracts.
Under the percentage-of-completion method, in each accounting period, the company estimates what percentage of the contract is complete and then reports that percentage of the total contract revenue in its income statement. Contract costs for the period are expensed against the revenue. Therefore, net income or profit is reported each year as work is performed.
Under IFRS, if the outcome of the contract cannot be measured reliably, then revenue may be recognized to the extent of contract costs incurred (but only if it is probable the costs will be recovered). Costs are expensed in the period incurred. Under this method, no profit is recognized until all the costs had been recovered. Under U.S. GAAP, but not under IFRS, a revenue recognition method used when the outcome cannot be measured reliably is the completed contract method. Under the completed contract method, the company does not report any income until the contract is substantially finished (the remaining costs and potential risks are insignificant in amount), although provision should be made for expected losses. Billings and costs are accumulated on the balance sheet rather than flowing through the income statement. Under U.S. GAAP, the completed contract method is also acceptable when the entity has primarily short-term contracts. Note that if a contract is started and completed in the same period, there is no difference between the percentage-of-completion and completed contract methods.
Examples 4-1, 4-2, and 4-3 provide illustrations of these revenue recognition methods. As shown, the percentage-of-completion method results in revenue recognition sooner than the completed contract method and thus may be considered a less conservative approach. In addition, the percentage-of-completion method relies on management estimates and is thus not as objective as the completed contract method. However, an advantage of the percentage-of-completion method is that it results in better matching of revenue recognition with the accounting period in which it was earned. Because of better matching with the periods in which work is performed, the percentage-of-completion method is the preferred method of revenue recognition for long-term contracts and is required when the outcome can be measured reliably under both IFRS and U.S. GAAP. Under both IFRS and U.S. GAAP, if a loss is expected on the contract, the loss is reported immediately, not upon completion of the contract, regardless of the method used (e.g., percentage-of-completion or completed contract).
EXAMPLE 4-1 Revenue Recognition for Long-Term Contracts: Recognizing Revenue on a Prorated Basis
New Era Network Associates has a five-year license to provide networking support services to a customer. The total amount of the license fee to be received by New Era is $1 million. New Era recognizes license revenue on a prorated basis regardless of the time at which cash is received. How much revenue will New Era recognize for this license in each year?
Solution: For this license, New Era Network Associates will recognize $200,000 each year for five years (calculated as $1 million divided by 5).
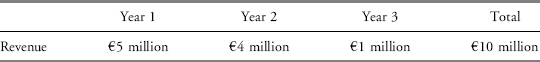
EXAMPLE 4-2 Revenue Recognition for Long-Term Contracts: Percentage-of-Completion Method
Stelle Technology has a contract to build a network for a customer for a total sales price of €10 million. The network will take an estimated three years to build, and total building costs are estimated to be €6 million. Stelle recognizes long-term contract revenue using the percentage-of-completion method and estimates percentage complete based on expenditure incurred as a percentage of total estimated expenditures.
1. At the end of Year 1, the company had spent €3 million. Total costs to complete are estimated to be another €3 million. How much revenue will Stelle recognize in Year 1?
2. At the end of Year 2, the company had spent an additional €2.4 million for an accumulated total of €5.4 million. Total costs to complete are estimated to be another €0.6 million. How much revenue will Stelle recognize in Year 2?
3. At the end of Year 3, the contract is complete. The company spent an accumulated total of €6 million. How much revenue will Stelle recognize in Year 3?
Solution to 1: Stelle has spent 50 percent of the total project costs (€3 million divided by €6 million), so in Year 1, the company will recognize 50 percent of the total contract revenue (i.e., €5 million).
Solution to 2: Because Stelle has spent 90 percent of the total project costs (€5.4 million divided by €6 million), by the end of Year 2, it will need to have recognized 90 percent of the total contract revenue (i.e., €9 million). Stelle has already recognized €5 million of revenue in Year 1, so in Year 2, the company will recognize €4 million revenue (€9 million minus €5 million).
Solution to 3: Because Stelle has spent 100 percent of the total project costs, by the end of Year 3, it will need to have recognized 100 percent of the total contract revenue (i.e., €10 million). Stelle had already recognized €9 million of revenue by the end of Year 2, so in Year 3, the company will recognize €1 million revenue (€10 million minus €9 million).
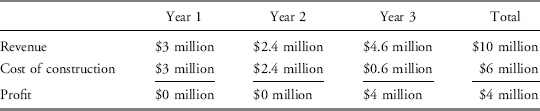
EXAMPLE 4-3 Revenue Recognition for Long-Term Contracts: Outcome Cannot Be Reliably Measured
Kolenda Technology Group has a contract to build a network for a customer for a total sales price of $10 million. This network will take an estimated three years to build, but considerable uncertainty surrounds total building costs because new technologies are involved. In other words, the outcome cannot be reliably measured, but it is probable that the costs up to the agreed upon price will be recovered.
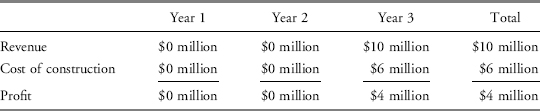
Assuming the following expenditures, how much revenue, expense (cost of construction), and income would the company recognize each year under IFRS and using the completed contract method under U.S. GAAP? The amounts periodically billed to the customer and received from the customer are not necessarily equivalent to the amount of revenue being recognized in the period. For simplicity, assume Kolenda pays cash for all expenditures.
1. At the end of Year 1, Kolenda has spent $3 million.
2. At the end of Year 2, Kolenda has spent a total of $5.4 million.
3. At the end of Year 3, the contract is complete. Kolenda spent a total of $6 million.
Solution: Under IFRS, revenue may be recognized to the extent of contract costs incurred if the outcome of the contract cannot be measured reliably and it is probable that costs will be recovered. In this example, the outcome is uncertain but it is probable that Kolenda will recover the costs up to $10 million. Under U.S. GAAP, the company would use the completed contract method. No revenue will be recognized until the contract is complete.
Year 1: Under IFRS, Kolenda would recognize $3 million cost of construction, $3 million revenue, and thus $0 income. Under U.S. GAAP, Kolenda would recognize $0 cost of construction, $0 revenue, and thus $0 income. The $3 million expenditure would be reported as an increase in the inventory account “construction in progress” and a decrease in cash.
Year 2: Under IFRS, Kolenda would recognize $2.4 million cost of construction, $2.4 million revenue, and thus $0 income. Under U.S. GAAP, Kolenda would recognize $0 cost of construction, $0 revenue, and thus $0 income. The $2.4 million expenditures would be reported as an increase in the inventory account “construction in progress” and a decrease in cash.
Year 3: Under IFRS, Kolenda would recognize the $0.6 million cost of construction incurred in the period. Because the contract has been completed and the outcome is now measurable, the company would recognize the remaining $4.6 million revenue on the contract, and thus $4 million income. Under U.S. GAAP, because the contract has been completed, Kolenda would recognize the total contract revenue (i.e., $10 million). Kolenda would recognize $6 million cost of construction and thus $4 million income. The inventory account “construction in progress” would be eliminated.
Summary
Revenue Recognition to the Extent of Contract Costs Incurred: IFRS
Completed Contract Method: U.S. GAAP
3.2.2. Installment Sales
As noted earlier, revenue is normally reported when goods are delivered or services are rendered, independent of the period in which cash payments for those goods or services are received. This principle applies even to installment sales—sales in which proceeds are to be paid in installments over an extended period. For installment sales, IFRS separate the installments into the sale price, which is the discounted present value of the installment payments, and an interest component. Revenue attributable to the sale price is recognized at the date of sale, and revenue attributable to the interest component is recognized over time.19 International standards note, however, that the guidance for revenue recognition must be considered in light of local laws regarding the sale of goods in a particular country. Under limited circumstances, recognition of revenue or profit may be required to be deferred for some installment sales. An example of such deferral arises for certain sales of real estate on an installment basis. Revenue recognition for sales of real estate varies depending on specific aspects of the sale transaction.20
Under U.S. GAAP, when the seller has completed the significant activities in the earnings process and is either assured of collecting the selling price or able to estimate amounts that will not be collected, a sale of real estate is reported at the time of sale using the normal revenue recognition conditions.21 When those two conditions are not fully met, under U.S. GAAP some of the profit is deferred. Two of the methods may be appropriate in these limited circumstances and relate to the amount of profit to be recognized each year from the transaction: the installment method and the cost recovery method. Under the installment method, the portion of the total profit of the sale that is recognized in each period is determined by the percentage of the total sales price for which the seller has received cash. Under the cost recovery method, the seller does not report any profit until the cash amounts paid by the buyer—including principal and interest on any financing from the seller—are greater than all the seller’s costs of the property. Note that the cost recovery method is similar to the revenue recognition method under international standards, described earlier, when the outcome of a contract cannot be measured reliably (although the term cost recovery method is not used in the international standard).
Example 4-4 illustrates the differences between the installment method and the cost recovery method. Installment sales and cost recovery treatment of revenue recognition are rare for financial reporting purposes, especially for assets other than real estate.
EXAMPLE 4-4 The Installment and Cost Recovery Methods of Revenue Recognition
Assume the total sales price and cost of a property are $2,000,000 and $1,100,000, respectively, so that the total profit to be recognized is $900,000. The amount of cash received by the seller as a down payment is $300,000, with the remainder of the sales price to be received over a 10-year period. It has been determined that there is significant doubt about the ability and commitment of the buyer to complete all payments. How much profit will be recognized attributable to the down payment if:
1. the installment method is used?
2. the cost recovery method is used?
Solution to 1: The installment method apportions the cash receipt between cost recovered and profit using the ratio of profit to sales value; here, this ratio equals $900,000/$2,000,000=0.45 or 45 percent. Therefore, the seller will recognize the following profit attributable to the down payment: 45 percent of $300,000=$135,000.
Solution to 2: Under the cost recovery method of revenue recognition, the company would not recognize any profit attributable to the down payment because the cash amounts paid by the buyer still do not exceed the cost of $1,100,000.
3.2.3. Barter
Revenue recognition issues related to barter transactions became particularly important as e-commerce developed. As an example, if Company A exchanges advertising space for computer equipment from Company B but no cash changes hands, can Company A and B both report revenue? Such an exchange is referred to as a “barter transaction.”
An even more challenging revenue recognition issue evolved from a specific type of barter transaction, a round-trip transaction. As an example, if Company A sells advertising services (or energy contracts, or commodities) to Company B and almost simultaneously buys an almost identical product from Company B, can Company A report revenue at the fair value of the product sold? Because the company’s revenue would be approximately equal to its expense, the net effect of the transaction would have no impact on net income or cash flow. However, the amount of revenue reported would be higher, and the amount of revenue can be important to a company’s valuation. In the earlier stages of e-commerce, for example, some equity valuations were based on sales (because many early Internet companies reported no net income).
Under IFRS, revenue from barter transactions must be measured based on the fair value of revenue from similar nonbarter transactions with unrelated parties (parties other than the barter partner).22 U.S. GAAP state that revenue can be recognized at fair value only if a company has historically received cash payments for such services and can thus use this historical experience as a basis for determining fair value; otherwise, the revenue from the barter transaction is recorded at the carrying amount of the asset surrendered.23
3.2.4. Gross versus Net Reporting
Another revenue recognition issue that became particularly important with the emergence of e-commerce is the issue of gross versus net reporting. Merchandising companies typically sell products that they purchased from a supplier. In accounting for their sales, the company records the amount of the sale proceeds as sales revenue and their cost of the products as the cost of goods sold. As Internet-based merchandising companies developed, many sold products that they had never held in inventory; they simply arranged for the supplier to ship the products directly to the end customer. In effect, many such companies were agents of the supplier company, and the net difference between their sales proceeds and their costs was equivalent to a sales commission. What amount should these companies record as their revenues—the gross amount of sales proceeds received from their customers, or the net difference between sales proceeds and their cost?
U.S. GAAP indicate that the approach should be based on the specific situation and provides guidance for determining when revenue should be reported gross versus net.24 To report gross revenues, the following criteria are relevant: the company is the primary obligor under the contract, bears inventory risk and credit risk, can choose its supplier, and has reasonable latitude to establish price. If these criteria are not met, the company should report revenues net. Example 4-5 provides an illustration.
EXAMPLE 4-5 Gross versus Net Reporting of Revenues
Flyalot has agreements with several major airlines to obtain airline tickets at reduced rates. The company pays only for tickets it sells to customers. In the most recent period, Flyalot sold airline tickets to customers over the Internet for a total of $1.1 million. The cost of these tickets to Flyalot was $1 million. The company’s direct selling costs were $2,000. Once the customers receive their ticket, the airline is responsible for providing all services associated with the customers’ flight.
1. Demonstrate the reporting of revenues under:
A. gross reporting.
B. net reporting.
2. Determine and justify the appropriate method for reporting revenues.
Solution to 1: The following table shows how reporting would appear on a gross and a net basis:
| A. Gross Reporting | B. Net Reporting | |
| Revenues | $1,100,000 | $100,000 |
| Cost of sales | 1,002,000 | 2,000 |
| Gross margin | $98,000 | $98,000 |
Solution to 2: Flyalot should report revenue on a net basis. Flyalot pays only for tickets it sells to customers and thus does not bear inventory risk. In addition, the airline—not Flyalot—is the primary obligor under the contract. Revenues should be reported as $100,000.
3.3. Implications for Financial Analysis
As we have seen, companies use a variety of revenue recognition methods. Furthermore, a single company may use different revenue recognition policies for different businesses. Companies disclose their revenue recognition policies in the notes to their financial statement, often in the first note.
The following aspects of a company’s revenue recognition policy are particularly relevant to financial analysis: whether a policy results in recognition of revenue sooner rather than later (sooner is less conservative), and to what extent a policy requires the company to make estimates. In order to analyze a company’s financial statements, and particularly to compare one company’s financial statements with those of another company, it is helpful to understand any differences in their revenue recognition policies. Although it may not be possible to calculate the monetary effect of differences between particular companies’ revenue recognition policies and estimates, it is generally possible to characterize the relative conservatism of a company’s policies and to qualitatively assess how differences in policies might affect financial ratios.
EXAMPLE 4-6 Revenue Recognition Policy for Apple
As disclosed in the excerpt from notes to the consolidated financial statements shown below (emphasis added), Apple Inc. (NasdaqGS: AAPL) uses different revenue recognition policies depending on the type of revenue producing activity, including product sales, service and support contracts, and products obtained from other companies. Note that these are only the first three paragraphs of Apple’s disclosure on revenue recognition; the entire revenue recognition portion has nine paragraphs.
Revenue Recognition
Net sales consist primarily of revenue from the sale of hardware, software, digital content and applications, peripherals, and service and support contracts. The Company recognizes revenue when persuasive evidence of an arrangement exists, delivery has occurred, the sales price is fixed or determinable, and collection is probable. Product is considered delivered to the customer once it has been shipped and title and risk of loss have been transferred. For most of the Company’s product sales, these criteria are met at the time the product is shipped. For online sales to individuals, for some sales to education customers in the U.S., and for certain other sales, the Company defers revenue until the customer receives the product because the Company legally retains a portion of the risk of loss on these sales during transit [portions omitted].
Revenue from service and support contracts is deferred and recognized ratably over the service coverage periods. These contracts typically include extended phone support, repair services, web-based support resources, diagnostic tools, and extend the service coverage offered under the Company’s standard limited warranty.
The Company sells software and peripheral products obtained from other companies. The Company generally establishes its own pricing and retains related inventory risk, is the primary obligor in sales transactions with its customers, and assumes the credit risk for amounts billed to its customers. Accordingly, the Company generally recognizes revenue for the sale of products obtained from other companies based on the gross amount billed.
Source: Apple Inc. 10-K/A for the year ended 26 September 2009, as filed with the SEC on 25 January 2010. Emphasis added.
1. What criteria does Apple apply to determine when to recognize revenue from product sales?
2. What principle underpins the company’s deferral of revenue from service and support contracts?
Solution to 1: Apple recognizes revenue when persuasive evidence of an arrangement exists, delivery has occurred, the sales price is fixed or determinable, and collection is probable. Note that these are just the four U.S. GAAP revenue recognition criteria described in Section 3.1. Note also that Apple recognizes revenue on some product sales at the time of shipment and others at the time of delivery, depending on when its risk of loss ends.
Solution to 2: The basic principle underpinning the company’s deferral of revenue for service and sales contracts is that revenue should be recognized in the period it is earned. Because service under these contracts will be performed in future periods, the company defers the revenue and then recognizes it over the time it is earned.
With familiarity of the basic principles of revenue recognition in hand, the next section begins a discussion of expense recognition.
Expenses are deducted against revenue to arrive at a company’s net profit or loss. Under the IASB Framework, expenses are “decreases in economic benefits during the accounting period in the form of outflows or depletions of assets or incurrences of liabilities that result in decreases in equity, other than those relating to distributions to equity participants.”25
The IASB Framework also states:
The definition of expenses encompasses losses as well as those expenses that arise in the course of the ordinary activities of the enterprise. Expenses that arise in the course of the ordinary activities of the enterprise include, for example, cost of sales, wages and depreciation. They usually take the form of an outflow or depletion of assets such as cash and cash equivalents, inventory, property, plant and equipment.
Losses represent other items that meet the definition of expenses and may, or may not, arise in the course of the ordinary activities of the enterprise. Losses represent decreases in economic benefits and as such they are no different in nature from other expenses. Hence, they are not regarded as a separate element in this Framework.
Losses include, for example, those resulting from disasters such as fire and flood, as well as those arising on the disposal of noncurrent assets.26
Similar to the issues with revenue recognition, in a simple hypothetical scenario, expense recognition would not be an issue. For instance, assume a company purchased inventory for cash and sold the entire inventory in the same period. When the company paid for the inventory, absent indications to the contrary, it is clear that the inventory cost has been incurred and when that inventory is sold, it should be recognized as an expense (cost of goods sold) in the financial records. Assume also that the company paid all operating and administrative expenses in cash within each accounting period. In such a simple hypothetical scenario, no issues of expense recognition would arise. In practice, however, as with revenue recognition, determining when expenses should be recognized can be somewhat more complex.
4.1. General Principles
In general, a company recognizes expenses in the period that it consumes (i.e., uses up) the economic benefits associated with the expenditure, or loses some previously recognized economic benefit.27
A general principle of expense recognition is the matching principle. Strictly speaking, IFRS do not refer to a “matching principle” but rather to a “matching concept” or to a process resulting in “matching of costs with revenues.”28 The distinction is relevant in certain standard-setting deliberations. Under matching, a company recognizes some expenses (e.g., cost of goods sold) when associated revenues are recognized and thus, expenses and revenues are matched. Associated revenues and expenses are those that result directly and jointly from the same transactions or events. Unlike the simple scenario in which a company purchases inventory and sells all of the inventory within the same accounting period, in practice, it is more likely that some of the current period’s sales are made from inventory purchased in a previous period or previous periods. It is also likely that some of the inventory purchased in the current period will remain unsold at the end of the current period and so will be sold in a following period. Matching requires that a company recognizes cost of goods sold in the same period as revenues from the sale of the goods.
Period costs, expenditures that less directly match revenues, are reflected in the period when a company makes the expenditure or incurs the liability to pay. Administrative expenses are an example of period costs. Other expenditures that also less directly match revenues relate more directly to future expected benefits; in this case, the expenditures are allocated systematically with the passage of time. An example is depreciation expense.
Examples 4-7 and 4-8 demonstrate matching applied to inventory and cost of goods sold.
EXAMPLE 4-7 The Matching of Inventory Costs with Revenues
Kahn Distribution Limited (KDL) purchases inventory items for resale. At the beginning of 2009, Kahn had no inventory on hand. During 2009, Kahn had the following transactions:
Inventory Purchases
| First quarter | 2,000 units at $40 per unit |
| Second quarter | 1,500 units at $41 per unit |
| Third quarter | 2,200 units at $43 per unit |
| Fourth quarter | 1,900 units at $45 per unit |
| Total | 7,600 units at a total cost of $321,600 |
KDL sold 5,600 units of inventory during the year at $50 per unit, and received cash. KDL determines that there were 2,000 remaining units of inventory and specifically identifies that 1,900 were those purchased in the fourth quarter and 100 were purchased in the third quarter. What are the revenue and expense associated with these transactions during 2009 based on specific identification of inventory items as sold or remaining in inventory?
Solution: The revenue for 2009 would be $280,000 (5,600 units × $50 per unit). Initially, the total cost of the goods purchased would be recorded as inventory (an asset) in the amount of $321,600. During 2009, the cost of the 5,600 units sold would be expensed (matched against the revenue) while the cost of the 2,000 remaining unsold units would remain in inventory as follows:
Cost of Goods Sold
| From the first quarter | 2,000 units at $40 per unit = $80,000 |
| From the second quarter | 1,500 units at $41 per unit = $61,500 |
| From the third quarter | 2,100 units at $43 per unit = $90,300 |
| Total cost of goods sold | $231,800 |
Cost of Goods Remaining in Inventory
| From the third quarter | 100 units at $43 per unit = $4,300 |
| From the fourth quarter | 1,900 units at $45 per unit = $85,500 |
| Total remaining (or ending) inventory cost | $89,800 |
To confirm that total costs are accounted for: $231,800+$89,800=$321,600. The cost of the goods sold would be expensed against the revenue of $280,000 as follows:
| Revenue | $280,000 |
| Cost of goods sold | 231,800 |
| Gross profit | $48,200 |
An alternative way to think about this is that the company created an asset (inventory) of $321,600 as it made its purchases. At the end of the period, the value of the company’s inventory on hand is $89,800. Therefore, the amount of the Cost of goods sold expense recognized for the period should be the difference: $231,800.
The remaining inventory amount of $89,800 will be matched against revenue in a future year when the inventory items are sold.
EXAMPLE 4-8 Alternative Inventory Costing Methods
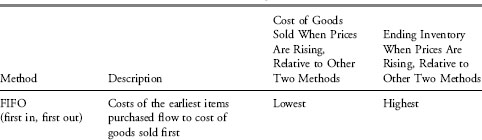
In Example 4-7, KDL was able to specifically identify which inventory items were sold and which remained in inventory to be carried over to later periods. This is called the specific identification method and inventory and cost of goods sold are based on their physical flow. It is generally not feasible to specifically identify which items were sold and which remain on hand, so accounting standards permit the assignment of inventory costs to costs of goods sold and to ending inventory using cost formulas (IFRS terminology) or cost flow assumptions (U.S. GAAP). The cost formula or cost flow assumption determines which goods are assumed to be sold and which goods are assumed to remain in inventory. Both IFRS and U.S. GAAP permit the use of the first in, first out (FIFO) method, and the weighted average cost method to assign costs.
Under the FIFO method, the oldest goods purchased (or manufactured) are assumed to be sold first and the newest goods purchased (or manufactured) are assumed to remain in inventory. Cost of goods in beginning inventory and costs of the first items purchased (or manufactured) flow into cost of goods sold first, as if the earliest items purchased sold first. Ending inventory would, therefore, include the most recent purchases. It turns out that those items specifically identified as sold in Example 7 were also the first items purchased, so in this example, under FIFO, the cost of goods sold would also be $231,800, calculated as previously.
The weighted average cost method assigns the average cost of goods available for sale to the units sold and remaining in inventory. The assignment is based on the average cost per unit (total cost of goods available for sale/total units available for sale) and the number of units sold and the number remaining in inventory.
For KDL, the weighted average cost per unit would be
$321,600/7,600 units=$42.3158 per unit
Cost of goods sold using the weighted average cost method would be
5,600 units at $42.3158=$236,968
Ending inventory using the weighted average cost method would be
2,000 units at $42.3158=$84,632
Another method is permitted under U.S. GAAP but is not permitted under IFRS. This is the last in, first out (LIFO) method. Under the LIFO method, the newest goods purchased (or manufactured) are assumed to be sold first and the oldest goods purchased (or manufactured) are assumed to remain in inventory. Costs of the latest items purchased flow into cost of goods sold first, as if the most recent items purchased were sold first. Although this may seem contrary to common sense, it is logical in certain circumstances. For example, lumber in a lumberyard may be stacked up with the oldest lumber on the bottom. As lumber is sold, it is sold from the top of the stack, so the last lumber purchased and put in inventory is the first lumber out. Theoretically, a company should choose a method linked to the physical inventory flows.29 Under the LIFO method, in the KDL example, it would be assumed that the 2,000 units remaining in ending inventory would have come from the first quarter’s purchases:30
Ending inventory 2,000 units at $40 per unit=$80,000
The remaining costs would be allocated to cost of goods sold under LIFO:
Total costs of $321,600 less $80,000 remaining in ending inventory=$241,600
Alternatively, the cost of the last 5,600 units purchased is allocated to cost of goods sold under LIFO:
1,900 units at $45 per unit+2,200 units at $43 per unit+1,500 units at $41 per unit=$241,600
An alternative way to think about expense recognition is that the company created an asset (inventory) of $321,600 as it made its purchases. At the end of the period, the value of the company’s inventory is $80,000. Therefore, the amount of the Cost of goods sold expense recognized the period should be the difference: $241,600.
Exhibit 4-7 summarizes and compares inventory costing methods.
EXHIBIT 4-7 Summary Table on Inventory Costing Methods
4.2. Issues in Expense Recognition
The following sections cover applications of the principles of expense recognition to certain common situations.
4.2.1. Doubtful Accounts
When a company sells its products or services on credit, it is likely that some customers will ultimately default on their obligations (i.e., fail to pay). At the time of the sale, it is not known which customer will default. (If it were known that a particular customer would ultimately default, presumably a company would not sell on credit to that customer.) One possible approach to recognizing credit losses on customer receivables would be for the company to wait until such time as a customer defaulted and only then recognize the loss (direct write-off method). Such an approach would usually not be consistent with generally accepted accounting principles.
Under the matching principle, at the time revenue is recognized on a sale, a company is required to record an estimate of how much of the revenue will ultimately be uncollectible. Companies make such estimates based on previous experience with uncollectible accounts. Such estimates may be expressed as a proportion of the overall amount of sales, the overall amount of receivables, or the amount of receivables overdue by a specific amount of time. The company records its estimate of uncollectible amounts as an expense on the income statement, not as a direct reduction of revenues.
4.2.2. Warranties
At times, companies offer warranties on the products they sell. If the product proves deficient in some respect that is covered under the terms of the warranty, the company will incur an expense to repair or replace the product. At the time of sale, the company does not know the amount of future expenses it will incur in connection with its warranties. One possible approach would be for a company to wait until actual expenses are incurred under the warranty and to reflect the expense at that time. However, this would not result in a matching of the expense with the associated revenue.
Under the matching principle, a company is required to estimate the amount of future expenses resulting from its warranties, to recognize an estimated warranty expense in the period of the sale, and to update the expense as indicated by experience over the life of the warranty.
4.2.3. Depreciation and Amortization
Companies commonly incur costs to obtain long-lived assets. Long-lived assets are assets expected to provide economic benefits over a future period of time greater than one year. Examples are land (property), plant, equipment, and intangible assets (assets lacking physical substance) such as trademarks. The costs of most long-lived assets are allocated over the period of time during which they provide economic benefits. The two main types of long-lived assets whose costs are not allocated over time are land and those intangible assets with indefinite useful lives.
Depreciation is the process of systematically allocating costs of long-lived assets over the period during which the assets are expected to provide economic benefits. “Depreciation” is the term commonly applied to this process for physical long-lived assets such as plant and equipment (land is not depreciated), and amortization is the term commonly applied to this process for intangible long-lived assets with a finite useful life.31 Examples of intangible long-lived assets with a finite useful life include an acquired mailing list, an acquired patent with a set expiration date, and an acquired copyright with a set legal life. The term “amortization” is also commonly applied to the systematic allocation of a premium or discount relative to the face value of a fixed-income security over the life of the security.
IFRS allow two alternative models for valuing property, plant, and equipment: the cost model and the revaluation model.32 Under the cost model, the depreciable amount of that asset (cost less residual value) is allocated on a systematic basis over the remaining useful life of the asset. Under the cost model, the asset is reported at its cost less any accumulated depreciation. Under the revaluation model, the asset is reported at its fair value. The revaluation model is not permitted under U.S. GAAP. Here, we will focus only on the cost model. There are two other differences between IFRS and U.S. GAAP to note: IFRS require each component of an asset to be depreciated separately and U.S. GAAP do not require component depreciation; and IFRS require an annual review of residual value and useful life, and U.S. GAAP do not explicitly require such a review.
The method used to compute depreciation should reflect the pattern over which the economic benefits of the asset are expected to be consumed. IFRS do not prescribe a particular method for computing depreciation but note that several methods are commonly used, such as the straight-line method, diminishing balance method (accelerated depreciation), and the units of production method (depreciation varies depending upon production or usage).
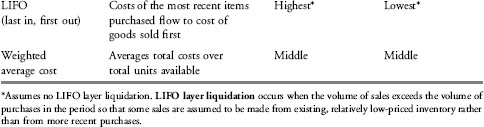
The straight-line method allocates evenly the cost of long-lived assets less estimated residual value over the estimated useful life of an asset. (The term “straight line” derives from the fact that the annual depreciation expense, if represented as a line graph over time, would be a straight line. In addition, a plot of the cost of the asset minus the cumulative amount of annual depreciation expense, if represented as a line graph over time, would be a straight line with a negative downward slope.) Calculating depreciation and amortization requires two significant estimates: the estimated useful life of an asset and the estimated residual value (also known as “salvage value”) of an asset. Under IFRS, the residual value is the amount that the company expects to receive upon sale of the asset at the end of its useful life. Example 4-9 assumes that an item of equipment is depreciated using the straight-line method and illustrates how the annual depreciation expense varies under different estimates of the useful life and estimated residual value of an asset. As shown, annual depreciation expense is sensitive to both the estimated useful life and to the estimated residual value.
EXAMPLE 4-9 Sensitivity of Annual Depreciation Expense to Varying Estimates of Useful Life and Residual Value
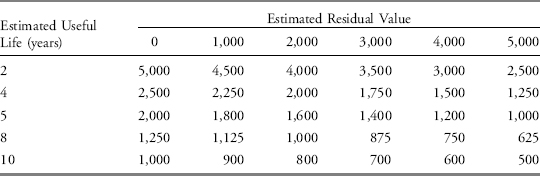
Using the straight-line method of depreciation, annual depreciation expense is calculated as:
![]()
Assume the cost of an asset is $10,000. If, for example, the residual value of the asset is estimated to be $0 and its useful life is estimated to be 5 years, the annual depreciation expense under the straight-line method would be ($10,000−$0)/5 years=$2,000. In contrast, holding the estimated useful life of the asset constant at 5 years but increasing the estimated residual value of the asset to $4,000 would result in annual depreciation expense of only $1,200 [calculated as ($10,000−$4,000)/5 years]. Alternatively, holding the estimated residual value at $0 but increasing the estimated useful life of the asset to 10 years would result in annual depreciation expense of only $1,000 [calculated as ($10,000−$0)/10 years]. Exhibit 4-8 shows annual depreciation expense for various combinations of estimated useful life and residual value.
EXHIBIT 4-8 Annual Depreciation Expense (in dollars)
Generally, alternatives to the straight-line method of depreciation are called accelerated methods of depreciation because they accelerate (i.e., speed up) the timing of depreciation. Accelerated depreciation methods allocate a greater proportion of the cost to the early years of an asset’s useful life. These methods are appropriate if the plant or equipment is expected to be used up faster in the early years (e.g., an automobile). A commonly used accelerated method is the diminishing balance method, (also known as the declining balance method). The diminishing balance method is demonstrated in Example 4-10.
EXAMPLE 4-10 An Illustration of Diminishing Balance Depreciation
Assume the cost of computer equipment was $11,000, the estimated residual value is $1,000, and the estimated useful life is five years. Under the diminishing or declining balance method, the first step is to determine the straight-line rate, the rate at which the asset would be depreciated under the straight-line method. This rate is measured as 100 percent divided by the useful life or 20 percent for a five-year useful life. Under the straight-line method, 1/5 or 20 percent of the depreciable cost of the asset (here, $11,000−$1,000=$10,000) would be expensed each year for five years: The depreciation expense would be $2,000 per year.
The next step is to determine an acceleration factor that approximates the pattern of the asset’s wear. Common acceleration factors are 150 percent and 200 percent. The latter is known as double declining balance depreciation because it depreciates the asset at double the straight-line rate. Using the 200 percent acceleration factor, the diminishing balance rate would be 40 percent (20 percent × 2.0). This rate is then applied to the remaining undepreciated balance of the asset each period (known as the net book value).
At the beginning of the first year, the net book value is $11,000. Depreciation expense for the first full year of use of the asset would be 40 percent of $11,000, or $4,400. Under this method, the residual value, if any, is generally not used in the computation of the depreciation each period (the 40 percent is applied to $11,000 rather than to $11,000 minus residual value). However, the company will stop taking depreciation when the salvage value is reached.
At the beginning of Year 2, the net book value is measured as
| Asset cost | $11,000 |
| Less: Accumulated depreciation | (4,400) |
| Net book value | $6,600 |
For the second full year, depreciation expense would be $6,600 × 40 percent, or $2,640. At the end of the second year (i.e., beginning of the third year), a total of $7,040 ($4,400+$2,640) of depreciation would have been recorded. So, the remaining net book value at the beginning of the third year would be
| Asset cost | $11,000 |
| Less: Accumulated depreciation | (7,040) |
| Net book value | $3,960 |
For the third full year, depreciation would be $3,960 × 40 percent, or $1,584. At the end of the third year, a total of $8,624 ($4,400+$2,640+$1,584) of depreciation would have been recorded. So, the remaining net book value at the beginning of the fourth year would be
| Asset cost | $11,000 |
| Less: Accumulated depreciation | (8,624) |
| Net book value | $2,376 |
For the fourth full year, depreciation would be $2,376 × 40 percent, or $950. At the end of the fourth year, a total of $9,574 ($4,400+$2,640+$1,584+$950) of depreciation would have been recorded. So, the remaining net book value at the beginning of the fifth year would be
| Asset cost | $11,000 |
| Less: Accumulated depreciation | (9,574) |
| Net book value | $1,426 |
For the fifth year, if deprecation were determined as in previous years, it would amount to $570 ($1,426 × 40 percent). However, this would result in a remaining net book value of the asset below its estimated residual value of $1,000. So, instead, only $426 would be depreciated, leaving a $1,000 net book value at the end of the fifth year.
| Asset cost | $11,000 |
| Less: Accumulated depreciation | (10,000) |
| Net book value | $1,000 |
Companies often use a zero or small residual value, which creates problems for diminishing balance depreciation because the asset never fully depreciates. In order to fully depreciate the asset over the initially estimated useful life when a zero or small residual value is assumed, companies often adopt a depreciation policy that combines the diminishing balance and straight-line methods. An example would be a deprecation policy of using double-declining balance depreciation and switching to the straight-line method halfway through the useful life.
Under accelerated depreciation methods, there is a higher depreciation expense in early years relative to the straight-line method. This results in higher expenses and lower net income in the early depreciation years. In later years, there is a reversal with accelerated depreciation expense lower than straight-line depreciation. Accelerated depreciation is sometimes referred to as a conservative accounting choice because it results in lower net income in the early years of asset use.
For those intangible assets that must be amortized (those with an identifiable useful life), the process is the same as for depreciation; only the name of the expense is different. IFRS state that if a pattern cannot be determined over the useful life, then the straight-line method should be used.33 In most cases under IFRS and U.S. GAAP, amortizable intangible assets are amortized using the straight-line method with no residual value. Goodwill34 and intangible assets with indefinite life are not amortized. Instead, they are tested at least annually for impairment (i.e., if the current value of an intangible asset or goodwill is materially lower than its value in the company’s books, the value of the asset is considered to be impaired and its value in the company’s books must be decreased).
In summary, to calculate depreciation and amortization, a company must choose a method, estimate the asset’s useful life, and estimate residual value. Clearly, different choices have a differing effect on depreciation or amortization expense and, therefore, on reported net income.
4.3. Implications for Financial Analysis
A company’s estimates for doubtful accounts and/or for warranty expenses can affect its reported net income. Similarly, a company’s choice of depreciation or amortization method, estimates of assets’ useful lives, and estimates of assets’ residual values can affect reported net income. These are only a few of the choices and estimates that affect a company’s reported net income.
As with revenue recognition policies, a company’s choice of expense recognition can be characterized by its relative conservatism. A policy that results in recognition of expenses later rather than sooner is considered less conservative. In addition, many items of expense require the company to make estimates that can significantly affect net income. Analysis of a company’s financial statements, and particularly comparison of one company’s financial statements with those of another, requires an understanding of differences in these estimates and their potential impact.
If, for example, a company shows a significant year-to-year change in its estimates of uncollectible accounts as a percentage of sales, warranty expenses as percentage of sales, or estimated useful lives of assets, the analyst should seek to understand the underlying reasons. Do the changes reflect a change in business operations (e.g., lower estimated warranty expenses reflecting recent experience of fewer warranty claims because of improved product quality)? Or are the changes seemingly unrelated to changes in business operations and thus possibly a signal that a company is manipulating estimates in order to achieve a particular effect on its reported net income?
As another example, if two companies in the same industry have dramatically different estimates for uncollectible accounts as a percentage of their sales, warranty expenses as a percentage of sales, or estimated useful lives as a percentage of assets, it is important to understand the underlying reasons. Are the differences consistent with differences in the two companies’ business operations (e.g., lower uncollectible accounts for one company reflecting a different, more creditworthy customer base or possibly stricter credit policies)? Another difference consistent with differences in business operations would be a difference in estimated useful lives of assets if one of the companies employs newer equipment. Or, alternatively, are the differences seemingly inconsistent with differences in the two companies’ business operations, possibly signaling that a company is manipulating estimates?
Information about a company’s accounting policies and significant estimates are described in the notes to the financial statements and in the management discussion and analysis section of a company’s annual report.
When possible, the monetary effect of differences in expense recognition policies and estimates can facilitate more meaningful comparisons with a single company’s historical performance or across a number of companies. An analyst can use the monetary effect to adjust the reported expenses so that they are on a comparable basis.
Even when the monetary effects of differences in policies and estimates cannot be calculated, it is generally possible to characterize the relative conservatism of the policies and estimates and, therefore, to qualitatively assess how such differences might affect reported expenses and thus financial ratios.
5. NONRECURRING ITEMS AND NONOPERATING ITEMS
From a company’s income statements, we can see its earnings from last year and in the previous year. Looking forward, the question is: What will the company earn next year and in the years after?
To assess a company’s future earnings, it is helpful to separate those prior years’ items of income and expense that are likely to continue in the future from those items that are less likely to continue.35 Some items from prior years are clearly not expected to continue in the future periods and are separately disclosed on a company’s income statement. This is consistent with “An entity shall present additional line items, headings, and subtotals. . .when such presentation is relevant to an understanding of the entity’s financial performance.”36 IFRS describe considerations that enter into the decision to present information other than that explicitly specified by a standard. U.S. GAAP specify some of the items that should be reported separately. Two such items are (1) discontinued operations, and (2) extraordinary items (the latter category is not permitted under IFRS). These two items, if applicable, must be reported separately from continuing operations under U.S. GAAP.37 For other items on a company’s income statement, such as unusual items, accounting changes, and nonoperating income, the likelihood of their continuing in the future is somewhat less clear and requires the analyst to make some judgments.
5.1. Discontinued Operations
When a company disposes of or establishes a plan to dispose of one of its component operations and will have no further involvement in the operation, the income statement reports separately the effect of this disposal as a “discontinued” operation under both IFRS and U.S. GAAP. Financial standards provide various criteria for reporting the effect separately, which are generally that the discontinued component must be separable both physically and operationally.38
Because the discontinued operation will no longer provide earnings (or cash flow) to the company, an analyst can eliminate discontinued operations in formulating expectations about a company’s future financial performance.
In Exhibit 4-2, Kraft reported earnings and gains from discontinued operations of $1,045 million in 2008 and $232 million in 2007. In Note 2 of its financial statements, Kraft explains that it split off its Post Cereals business. The earnings and gains from discontinued operations of $1,045 million in 2008 and $232 million in 2007 refer to the amount of earnings of the cereal business in each of those years, up to the date it was split off.
5.2. Extraordinary Items
IFRS prohibit classification of any income or expense items as being “extraordinary.”39 Under U.S. GAAP, an extraordinary item is one that is both unusual in nature and infrequent in occurrence. Extraordinary items are presented separately on the income statement and allow a reader of the statements to see that these items are not part of a company’s operating activities and are not expected to occur on an ongoing basis. Extraordinary items are shown net of tax and appear on the income statement below discontinued operations. An example of an extraordinary item is provided in Exhibit 4-9.
Exhibit 4-9 Extraordinary Gain on Debt Forgiveness
In its annual report, ForgeHouse, Inc. (OTCBB: FOHE) made the following disclosure describing an extraordinary gain on debt forgiveness:
On September 30, 2009, the Company entered into a Debt Forgiveness Agreement with Insurance Medical Group Limited (f/k/a After All Limited), Bryan Irving, and Ian Morl, pursuant to which $785,000 (plus accrued and unpaid interest and any penalties of $80,141) of the Company’s outstanding obligations in favor of Arngrove Group Holdings were forgiven and all $200,000 (plus accrued and unpaid interest and any penalties of $23,418) of the Company’s outstanding obligations in favor of After All Group, Limited, was forgiven. Gain on these two debt restructurings was a gross of $1,088,559 for the year ended December 31, 2009.
In December 2009, the Company entered into agreements with two of its vendors to reduce the amounts owed to the vendors in exchange for up-front payments. Gain on the restructure of amounts owed to the two vendors was $244,041.
These amounts are presented in the statement of operations net of income taxes of $453,084 for a net extraordinary gain on debt restructuring of $879,516.
Source: ForgeHouse, Inc. 10-K for fiscal year ended 31 December 2009, filed 14 May 2010: Note 6.
Companies apply judgment to determine whether an item is extraordinary based on guidance from accounting standards.40 Judgment on whether an item is unusual in nature requires consideration of the company’s environment, including its industry and geography. Determining whether an item is infrequent in occurrence is based on expectations of whether it will occur again in the near future. Standard setters offer specific guidance in some cases. For example, following Hurricanes Katrina and Rita in 2005, the American Institute of Certified Public Accountants issued Technical Practice Aid 5400.05, which states (the material in square brackets has been added): “A natural disaster [such as a hurricane, tornado, fire, or earthquake] of a type that is reasonably expected to re-occur would not meet both conditions [for classification as an extraordinary item].”
Given the requirements for classification of an item as extraordinary—unusual and infrequent—an analyst can generally eliminate extraordinary items from expectations about a company’s future financial performance unless there is some indication that such an extraordinary item may reoccur.
5.3. Unusual or Infrequent Items
IFRS require that items of income or expense that are material and/or relevant to the understanding of the entity’s financial performance should be disclosed separately. Unusual or infrequent items are likely to meet these criteria. Under U.S. GAAP, which allow items to be shown as extraordinary, items that are unusual or infrequent—but not both—cannot be shown as extraordinary. Items that are unusual or infrequent are shown as part of a company’s continuing operations. For example, restructuring charges, such as costs to close plants and employee termination costs, are considered part of a company’s ordinary activities. As another example, gains and losses arising when a company sells an asset or part of a business, for more or less than its carrying value, are also disclosed separately on the income statement. These are not considered extraordinary under U.S. GAAP because such sales are considered ordinary business activities.
Highlighting the unusual or infrequent nature of these items assists an analyst in judging the likelihood that such items will reoccur. This meets the IFRS criteria of disclosing items that are relevant to the understanding of an entity’s financial performance. Exhibit 4-10 shows such disclosure.
EXHIBIT 4-10 Highlighting Infrequent Nature of Items—Excerpt from Roche Group Consolidated Income Statement (in millions of CHF, Year ended 31 December 2009)
| (portions omitted) | |
| Operating profit before exceptional items | 15,012 |
| Major legal cases | (320) |
| Changes in Group organization | (2,415) |
| Operating profit | 12,277 |
| (portions omitted) |
In Exhibit 4-10, Roche Group (SWX: ROG), a Swiss health care company, shows operating profit before and after exceptional items. The exceptional items relate to major legal cases and changes in the organization. The company’s notes explain both items further. The costs for changes in the organization relate to Roche’s acquisition of Genentech and major changes to certain manufacturing and commercial centers. Generally, in forecasting future operations, an analyst would assess whether the items reported are likely to reoccur and also possible implications for future earnings. It is generally not advisable simply to ignore all unusual items.
5.4. Changes in Accounting Policies
At times, standard setters issue new standards that require companies to change accounting policies. Companies may be permitted to adopt the standards prospectively (in the future) or retrospectively (restate financial statements as though the standard existed in the past). In other cases, changes in accounting policies (e.g., from one acceptable inventory costing method to another) are made for other reasons, such as providing a better reflection of the company’s performance. Changes in accounting policies are reported through retrospective application41 unless it is impractical to do so.
Retrospective application means that the financial statements for all fiscal years shown in a company’s financial report are presented as if the newly adopted accounting principle had been used throughout the entire period. Notes to the financial statements describe the change and explain the justification for the change. Because changes in accounting principles are retrospectively applied, the financial statements that appear within a financial report are comparable. So, if a company’s annual report for 2009 includes its financial statements for fiscal years 2007, 2008, and 2009, all of these statements will be comparable.
Example 4-11 presents an excerpt from the 25 January 2010 10-K/A of Apple Inc. (NasdaqGS: AAPL). Apple amended its previously filed 10-K to reflect the company’s retrospective adoption of a new FASB accounting standard related to revenue recognition for multideliverables. An example of a multideliverable is the sale of an iPhone with the right to receive future upgrades. The change described in Example 4-11 brings U.S. GAAP closer to IFRS although differences remain. For example, IFRS do not provide detailed guidance and instead require that revenue should be allocated to separately identifiable components if doing so reflects the substance of the transaction. In contrast, U.S. GAAP provide details about how the separation of revenue should be done and how the revenue should be allocated to each component.
EXAMPLE 4-11 Revenue Recognition: A Change in Accounting Principle
Apple’s amended 10-K for the year ended 26 September 2009 explains how a change in accounting standards (the company refers to these as accounting principles) affects its financial statements. The following excerpt (emphasis added) is from the explanatory note included in the amendment.
Under the historical accounting principles, the Company was required to account for sales of both iPhone and Apple TV using subscription accounting because the Company indicated it might from time-to-time provide future unspecified software upgrades and features for those products free of charge. Under subscription accounting, revenue and associated product cost of sales for iPhone and Apple TV were deferred at the time of sale and recognized on a straight-line basis over each product’s estimated economic life. This resulted in the deferral of significant amounts of revenue and cost of sales related to iPhone and Apple TV. Costs incurred by the Company for engineering, sales, marketing and warranty were expensed as incurred. As of September 26, 2009, based on the historical accounting principles, total accumulated deferred revenue and deferred costs associated with past iPhone and Apple TV sales were $12.1 billion and $5.2 billion, respectively.
The new accounting principles generally require the Company to account for the sale of both iPhone and Apple TV as two deliverables. The first deliverable is the hardware and software delivered at the time of sale, and the second deliverable is the right included with the purchase of iPhone and Apple TV to receive on a when-and-if-available basis future unspecified software upgrades and features relating to the product’s software. The new accounting principles result in the recognition of substantially all of the revenue and product costs from sales of iPhone and Apple TV at the time of sale. Additionally, the Company is required to estimate a standalone selling price for the unspecified software upgrade right included with the sale of iPhone and Apple TV and recognizes that amount ratably over the 24 month estimated life of the related hardware device. For all periods presented, the Company’s estimated selling price for the software upgrade right included with each iPhone and Apple TV sold is $25 and $10, respectively. The adoption of the new accounting principles increased the Company’s net sales by $6.4 billion, $5.0 billion and $572 million for 2009, 2008 and 2007, respectively. As of September 26, 2009, the revised total accumulated deferred revenue associated with iPhone and Apple TV sales to date was $483 million; revised accumulated deferred costs for such sales were zero.
Source: Apple Inc. 10-K/A for the year ended 26 September 2009, as filed with the SEC on 25 January 2010. Emphasis added.
1. Under the historical accounting principle, how would the revenue from a sale of an iPhone be reflected in Apple’s financial statements?
2. How and why did adoption of the new accounting principles affect Apple’s revenues in 2009?
Solution to 1: Under the historical accounting principle (standard), a sale of an iPhone was treated as a subscription sale and revenue was not recognized at the time of sale. Rather, the sale would result in a liability entitled “deferred revenue.” In subsequent periods, the company would recognize as revenue a portion of the revenue from that sale and reduce the amount of deferred revenue by the same amount. Disclosures about deferred revenue can be helpful to an analyst in developing expectations about future revenues.
Solution to 2: Adoption of the new accounting principles (standards) increased the company’s 2009 net sales (revenue) by $6.4 billion. The reason for the increase is that the new standard allowed the company to separate the revenue from the iPhone into two separate components and to report revenue from them separately.
In years prior to 2005, under both IFRS and U.S. GAAP, the cumulative effect of changes in accounting policies was typically shown at the bottom of the income statement in the year of change instead of using retrospective application. It is possible that future accounting standards may occasionally require a company to report the change differently than retrospective application. Note disclosures are required to explain how the transition from the old standard to the new one is handled. During the period when companies make the transition from the old standard to the new, an analyst can examine disclosures to ensure comparability across companies.
In contrast to changes in accounting policies (such as whether to expense the cost of employee stock options), companies sometimes make changes in accounting estimates (such as the useful life of a depreciable asset). Changes in accounting estimates are handled prospectively, with the change affecting the financial statements for the period of change and future periods. No adjustments are made to prior statements, and the adjustment is not shown on the face of the income statement. Significant changes should be disclosed in the notes.
Another possible adjustment is a correction of an error for a prior period (e.g., in financial statements issued for an earlier year). This cannot be handled by simply adjusting the current period income statement. Correction of an error for a prior period is handled by restating the financial statements (including the balance sheet, statement of owners’ equity, and cash flow statement) for the prior periods presented in the current financial statements.42 Note disclosures are required regarding the error. These disclosures should be examined carefully because they may reveal weaknesses in the company’s accounting systems and financial controls.
5.5 Nonoperating Items
Nonoperating items are typically reported separately from operating income because they are material and/or relevant to the understanding of the entity’s financial performance. Under IFRS, there is no definition of operating activities, and companies that choose to report operating income or the results of operating activities should ensure that these represent activities that are normally regarded as operating. Under U.S. GAAP, operating activities generally involve producing and delivering goods and providing services and include all transactions and other events that are not defined as investing or financing activities.43 For example, if a nonfinancial service company invests in equity or debt securities issued by another company, any interest, dividends, or profits from sales of these securities will be shown as nonoperating income. In general, for nonfinancial services companies,44 nonoperating income that is disclosed separately on the income statement (or in the notes) includes amounts earned through investing activities.
Among nonoperating items on the income statement (or accompanying notes), nonfinancial service companies also disclose the interest expense on their debt securities, including amortization of any discount or premium. The amount of interest expense is related to the amount of a company’s borrowings and is generally described in the notes to the financial statements. For financial service companies, interest income and expense are likely components of operating activities. (Note that the characterization of interest and dividends as nonoperating items on the income statement is not necessarily consistent with the classification on the statement of cash flows. Specifically, under IFRS, interest and dividends received can be shown either as operating or as investing on the statement of cash flows, while under U.S. GAAP interest and dividends received are shown as operating cash flows. Under IFRS, interest and dividends paid can be shown either as operating or as financing on the statement of cash flows, while under U.S. GAAP, interest paid is shown as operating and dividends paid are shown as financing.)
In practice, investing and financing activities may be disclosed on a net basis, with the components disclosed separately in the notes. In its income statement for 2009 (Exhibit 4-1), Groupe Danone, for example, disclosed net interest expense (cost of net debt) of €264 million. The net amount is the €340 million of interest expense minus €76 million interest revenue. The financial statement notes (not shown) provide further disclosure about the expense.
For purposes of assessing a company’s future performance, the amount of financing expense will depend on the company’s financing policy (target capital structure) and borrowing costs. The amount of investing income will depend on the purpose and success of investing activities. For a nonfinancial company, a significant amount of financial income would typically warrant further exploration. What are the reasons underlying the company’s investments in the securities of other companies? Is the company simply investing excess cash in short-term securities to generate income higher than cash deposits, or is the company purchasing securities issued by other companies for strategic reasons, such as access to raw material supply or research?
One metric of particular importance to an equity investor is earnings per share (EPS). EPS is an input into ratios such as the price/earnings ratio. Additionally, each shareholder in a company owns a different number of shares. IFRS require the presentation of EPS on the face of the income statement for net profit or loss (net income) and profit or loss (income) from continuing operations.45 Similar presentation is required under U.S. GAAP.46 This section outlines the calculations for EPS and explains how the calculation differs for a simple versus complex capital structure.
6.1. Simple versus Complex Capital Structure
A company’s capital is composed of its equity and debt. Some types of equity have preference over others, and some debt (and other instruments) may be converted into equity. Under IFRS, the type of equity for which EPS is presented is referred to as ordinary. Ordinary shares are those equity shares that are subordinate to all other types of equity. The ordinary shareholders are basically the owners of the company—the equity holders who are paid last in a liquidation of the company and who benefit the most when the company does well. Under U.S. GAAP, this ordinary equity is referred to as common stock or common shares, reflecting U.S. language usage. The terms “ordinary shares,” “common stock,” and “common shares” are used interchangeably in the following discussion.
When a company has issued any financial instruments that are potentially convertible into common stock, it is said to have a complex capital structure. Examples of financial instruments that are potentially convertible into common stock include convertible bonds, convertible preferred stock, employee stock options, and warrants.47 If a company’s capital structure does not include such potentially convertible financial instruments, it is said to have a simple capital structure.
The distinction between simple versus complex capital structure is relevant to the calculation of EPS because financial instruments that are potentially convertible into common stock could, as a result of conversion or exercise, potentially dilute (i.e., decrease) EPS. Information about such a potential dilution is valuable to a company’s current and potential shareholders; therefore, accounting standards require companies to disclose what their EPS would be if all dilutive financial instruments were converted into common stock. The EPS that would result if all dilutive financial instruments were converted is called diluted EPS. In contrast, basic EPS is calculated using the reported earnings available to common shareholders of the parent company and the weighted average number of shares outstanding.
Companies are required to report both basic and diluted EPS. For example, Danone reported basic EPS (“before dilution”) and diluted EPS (“after dilution”) of €2.57 for 2009, somewhat lower than 2008. Kraft reported basic EPS of $2.04 and diluted EPS of $2.03 for 2009, much higher than basic and diluted EPS (from continuing operations) of $1.22 and $1.21 for 2008. (The EPS information appears at the bottom of Danone’s and Kraft’s income statements.) An analyst would try to determine the causes underlying the changes in EPS, a topic we will address following an explanation of the calculations of both basic and diluted EPS.
6.2. Basic EPS
Basic EPS is the amount of income available to common shareholders divided by the weighted average number of common shares outstanding over a period. The amount of income available to common shareholders is the amount of net income remaining after preferred dividends (if any) have been paid. Thus, the formula to calculate basic EPS is:
The weighted average number of shares outstanding is a time weighting of common shares outstanding. For example, assume a company began the year with 2,000,000 common shares outstanding and repurchased 100,000 common shares on 1 July. The weighted average number of common shares outstanding would be the sum of 2,000,000 shares×1/2 year+1,900,000 shares×1/2 year, or 1,950,000 shares. So the company would use 1,950,000 shares as the weighted average number of shares in calculating its basic EPS.
If the number of shares of common stock increases as a result of a stock dividend or a stock split, the EPS calculation reflects the change retroactively to the beginning of the period.
Examples 4-12, 4-13, and 4-14 illustrate the computation of basic EPS.
EXAMPLE 4-12 A Basic EPS Calculation (1)
For the year ended 31 December 2009, Shopalot Company had net income of $1,950,000. The company had 1,500,000 shares of common stock outstanding, no preferred stock, and no convertible financial instruments. What is Shopalot’s basic EPS?
Solution: Shopalot’s basic EPS is $1.30 ($1,950,000 divided by 1,500,000 shares).
EXAMPLE 4-13 A Basic EPS Calculation (2)
For the year ended 31 December 2009, Angler Products had net income of $2,500,000. The company declared and paid $200,000 of dividends on preferred stock. The company also had the following common stock share information:
| Shares outstanding on 1 January 2009 | 1,000,000 |
| Shares issued on 1 April 2009 | 200,000 |
| Shares repurchased (treasury shares) on 1 October 2009 | (100,000) |
| Shares outstanding on 31 December 2009 | 1,100,000 |
1. What is the company’s weighted average number of shares outstanding?
2. What is the company’s basic EPS?
Solution to 1: The weighted average number of shares outstanding is determined by the length of time each quantity of shares was outstanding:
| 1,000,000 × (3 months/12 months) = | 250,000 |
| 1,200,000 × (6 months/12 months) = | 600,000 |
| 1,100,000 × (3 months/12 months) = | 275,000 |
| Weighted average number of shares outstanding | 1,125,000 |
Solution to 2: Basic EPS=(Net income−Preferred dividends)/Weighted average number of shares=($2,500,000−$200,000)/1,125,000=$2.04
EXAMPLE 4-14 A Basic EPS Calculation (3)
Assume the same facts as in Example 4-13 except that on 1 December 2009, a previously declared 2 for 1 stock split took effect. Each shareholder of record receives two shares in exchange for each current share that he or she owns. What is the company’s basic EPS?
Solution: For EPS calculation purposes, a stock split is treated as if it occurred at the beginning of the period. The weighted average number of shares would, therefore, be 2,250,000, and the basic EPS would be $1.02 [= ($2,500,000 − $200,000)/2,250,000].
6.3. Diluted EPS
If a company has a simple capital structure (in other words, one that includes no potentially dilutive financial instruments), then its basic EPS is equal to its diluted EPS. However, if a company has potentially dilutive financial instruments, its diluted EPS may differ from its basic EPS. Diluted EPS, by definition, is always equal to or less than basic EPS. The following sections describe the effects of three types of potentially dilutive financial instruments on diluted EPS: convertible preferred, convertible debt, and employee stock options. The final section explains why not all potentially dilutive financial instruments actually result in a difference between basic and diluted EPS.
6.3.1. Diluted EPS When a Company Has Convertible Preferred Stock Outstanding
When a company has convertible preferred stock outstanding, diluted EPS is calculated using the if-converted method. The if-converted method is based on what EPS would have been if the convertible preferred securities had been converted at the beginning of the period. In other words, the method calculates what the effect would have been if the convertible preferred shares converted at the beginning of the period. If the convertible shares had been converted, there would be two effects. First, the convertible preferred securities would no longer be outstanding; instead, additional common stock would be outstanding. Thus, under the if-converted method, the weighted average number of shares outstanding would be higher than in the basic EPS calculation. Second, if such a conversion had taken place, the company would not have paid preferred dividends. Thus, under the if-converted method, the net income available to common shareholders would be higher than in the basic EPS calculation.
Diluted EPS using the if-converted method for convertible preferred stock is equal to net income divided by the weighted average number of shares outstanding from the basic EPS calculation plus the additional shares of common stock that would be issued upon conversion of the preferred. Thus, the formula to calculate diluted EPS using the if-converted method for preferred stock is:
A diluted EPS calculation using the if-converted method for preferred stock is provided in Example 4-15.
EXAMPLE 4-15 A Diluted EPS Calculation Using the If-Converted Method for Preferred Stock
For the year ended 31 December 2009, Bright-Warm Utility Company had net income of $1,750,000. The company had an average of 500,000 shares of common stock outstanding, 20,000 shares of convertible preferred, and no other potentially dilutive securities. Each share of preferred pays a dividend of $10 per share, and each is convertible into five shares of the company’s common stock. Calculate the company’s basic and diluted EPS.
Solution: If the 20,000 shares of convertible preferred had each converted into 5 shares of the company’s common stock, the company would have had an additional 100,000 shares of common stock (5 shares of common for each of the 20,000 shares of preferred). If the conversion had taken place, the company would not have paid preferred dividends of $200,000 ($10 per share for each of the 20,000 shares of preferred). As shown in Exhibit 4-11, the company’s basic EPS was $3.10 and its diluted EPS was $2.92.
EXHIBIT 4-11 Calculation of Diluted EPS for Bright-Warm Utility Company Using the If-Converted Method: Case of Preferred Stock
| Basic EPS | Diluted EPS Using If-Converted Method | |
| Net income | $1,750,000 | $1,750,000 |
| Preferred dividend | −200,000 | 0 |
| Numerator | $1,550,000 | $1,750,000 |
| Weighted average number of shares outstanding | 500,000 | 500,000 |
| Additional shares issued if preferred converted | 0 | 100,000 |
| Denominator | 500,000 | 600,000 |
| EPS | $3.10 | $2.92 |
6.3.2. Diluted EPS When a Company Has Convertible Debt Outstanding
When a company has convertible debt outstanding, the diluted EPS calculation also uses the if-converted method. Diluted EPS is calculated as if the convertible debt had been converted at the beginning of the period. If the convertible debt had been converted, the debt securities would no longer be outstanding; instead, additional shares of common stock would be outstanding. Also, if such a conversion had taken place, the company would not have paid interest on the convertible debt, so the net income available to common shareholders would increase by the after-tax amount of interest expense on the debt converted.
Thus, the formula to calculate diluted EPS using the if-converted method for convertible debt is:

A diluted EPS calculation using the if-converted method for convertible debt is provided in Example 4-16.
EXAMPLE 4-16 A Diluted EPS Calculation Using the If-Converted Method for Convertible Debt
Oppnox Company reported net income of $750,000 for the year ended 31 December 2009. The company had a weighted average of 690,000 shares of common stock outstanding. In addition, the company has only one potentially dilutive security: $50,000 of 6 percent convertible bonds, convertible into a total of 10,000 shares. Assuming a tax rate of 30 percent, calculate Oppnox’s basic and diluted EPS.
Solution: If the debt securities had been converted, the debt securities would no longer be outstanding and instead, an additional 10,000 shares of common stock would be outstanding. Also, if the debt securities had been converted, the company would not have paid interest of $3,000 on the convertible debt, so net income available to common shareholders would have increased by $2,100 [= $3,000(1−0.30)] on an after-tax basis. Exhibit 4-12 illustrates the calculation of diluted EPS using the if-converted method for convertible debt.
EXHIBIT 4-12 Calculation of Diluted EPS for Oppnox Company Using the If-Converted Method: Case of a Convertible Bond
| Basic EPS | Diluted EPS Using If-Converted Method | |
| Net income | $750,000 | $750,000 |
| After-tax cost of interest | 2,100 | |
| Numerator | $750,000 | $752,100 |
| Weighted average number of shares outstanding | 690,000 | 690,000 |
| If converted | 0 | 10,000 |
| Denominator | 690,000 | 700,000 |
| EPS | $1.09 | $1.07 |
6.3.3. Diluted EPS When a Company Has Stock Options, Warrants, or Their Equivalents Outstanding
When a company has stock options, warrants, or their equivalents48 outstanding, diluted EPS is calculated as if the financial instruments had been exercised and the company had used the proceeds from exercise to repurchase as many shares of common stock as possible at the average market price of common stock during the period. The weighted average number of shares outstanding for diluted EPS is thus increased by the number of shares that would be issued upon exercise minus the number of shares that would have been purchased with the proceeds. This method is called the treasury stock method under U.S. GAAP because companies typically hold repurchased shares as treasury stock. The same method is used under IFRS but is not named.
For the calculation of diluted EPS using this method, the assumed exercise of these financial instruments would have the following effects:
- The company is assumed to receive cash upon exercise and, in exchange, to issue shares.
- The company is assumed to use the cash proceeds to repurchase shares at the weighted average market price during the period.
As a result of these two effects, the number of shares outstanding would increase by the incremental number of shares issued (the difference between the number of shares issued to the holders and the number of shares assumed to be repurchased by the company). For calculating diluted EPS, the incremental number of shares is weighted based upon the length of time the financial instrument was outstanding in the year. If the financial instrument was issued prior to the beginning of the year, the weighted average number of shares outstanding increases by the incremental number of shares. If the financial instruments were issued during the year, then the incremental shares are weighted by the amount of time the financial instruments were outstanding during the year.
The assumed exercise of these financial instruments would not affect net income. For calculating EPS, therefore, no change is made to the numerator. The formula to calculate diluted EPS using the treasury stock method (same method as used under IFRS but not named) for options is:
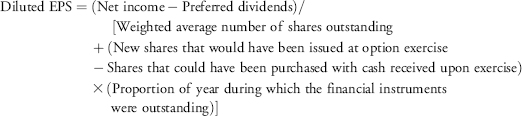
A diluted EPS calculation using the treasury stock method for options is provided in Example 4-17.
EXAMPLE 4-17 A Diluted EPS Calculation Using the Treasury Stock Method for Options
Hihotech Company reported net income of $2.3 million for the year ended 30 June 2009 and had a weighted average of 800,000 common shares outstanding. At the beginning of the fiscal year, the company has outstanding 30,000 options with an exercise price of $35. No other potentially dilutive financial instruments are outstanding. Over the fiscal year, the company’s market price has averaged $55 per share. Calculate the company’s basic and diluted EPS.
Solution: Using the treasury stock method, we first calculate that the company would have received $1,050,000 ($35 for each of the 30,000 options exercised) if all the options had been exercised. The options would no longer be outstanding; instead, 30,000 shares of common stock would be outstanding. Under the treasury stock method, we assume that shares would be repurchased with the cash received upon exercise of the options. At an average market price of $55 per share, the $1,050,000 proceeds from option exercise, the company could have repurchased 19,091 shares. Therefore, the incremental number of shares issued is 10,909 (calculated as 30,000 minus 19,091). For the diluted EPS calculation, no change is made to the numerator. As shown in Exhibit 4-13, the company’s basic EPS was $2.88 and the diluted EPS was $2.84.
EXHIBIT 4-13 Calculation of Diluted EPS for Hihotech Company Using the Treasury Stock Method: Case of Stock Options
| Basic EPS | Diluted EPS Using Treasury Stock Method | |
| Net income | $2,300,000 | $2,300,000 |
| Numerator | $2,300,000 | $2,300,000 |
| Weighted average number of shares outstanding | 800,000 | 800,000 |
| If converted | 0 | 10,909 |
| Denominator | 800,000 | 810,909 |
| EPS | $2.88 | $2.84 |
As noted, IFRS require a similar computation but does not refer to it as the “treasury stock method.” The company is required to consider that any assumed proceeds are received from the issuance of new shares at the average market price for the period. These new “inferred” shares would be disregarded in the computation of diluted EPS, but the excess of the new shares that would be issued under options contracts minus the new inferred shares would be added to the weighted average number of shares outstanding. The results are the same as the treasury stock method, as shown in Example 4-18.
EXAMPLE 4-18 Diluted EPS for Options under IFRS
Assuming the same facts as in Example 4-17, calculate the weighted average number of shares outstanding for diluted EPS under IFRS.
Solution: If the options had been exercised, the company would have received $1,050,000. If this amount had been received from the issuance of new shares at the average market price of $55 per share, the company would have issued 19,091 shares. IFRS refer to the 19,091 shares the company would have issued at market prices as the inferred shares. The number of shares issued under options (30,000) minus the number of inferred shares (19,091) equals 10,909. This amount is added to the weighted average number of shares outstanding of 800,000 to get diluted shares of 810,909. Note that this is the same result as that obtained under U.S. GAAP; it is just derived in a different manner.
6.3.4. Other Issues with Diluted EPS
It is possible that some potentially convertible securities could be antidilutive (i.e., their inclusion in the computation would result in an EPS higher than the company’s basic EPS). Under IFRS and U.S. GAAP, antidilutive securities are not included in the calculation of diluted EPS. Diluted EPS should reflect the maximum potential dilution from conversion or exercise of potentially dilutive financial instruments. Diluted EPS will always be less than or equal to basic EPS. Example 4-19 provides an illustration of an antidilutive security.
EXAMPLE 4-19 An Antidilutive Security
For the year ended 31 December 2009, Dim-Cool Utility Company had net income of $1,750,000. The company had an average of 500,000 shares of common stock outstanding, 20,000 shares of convertible preferred, and no other potentially dilutive securities. Each share of preferred pays a dividend of $10 per share, and each is convertible into three shares of the company’s common stock. What was the company’s basic and diluted EPS?
Solution: If the 20,000 shares of convertible preferred had each converted into 3 shares of the company’s common stock, the company would have had an additional 60,000 shares of common stock (3 shares of common for each of the 20,000 shares of preferred). If the conversion had taken place, the company would not have paid preferred dividends of $200,000 ($10 per share for each of the 20,000 shares of preferred). The effect of using the if-converted method would be EPS of $3.13, as shown in Exhibit 4-14. Because this is greater than the company’s basic EPS of $3.10, the securities are said to be antidilutive and the effect of their conversion would not be included in diluted EPS. Diluted EPS would be the same as basic EPS (i.e., $3.10).
EXHIBIT 4-14 Calculation for an Antidilutive Security
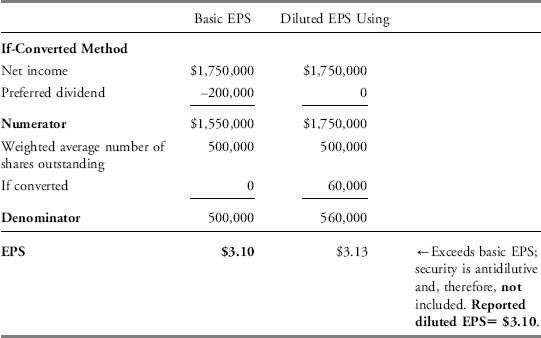
6.4. Changes in EPS
Having explained the calculations of both basic and diluted EPS, we return to an examination of changes in EPS. As noted earlier, Kraft’s fully diluted EPS from continuing operations increased from $1.21 in 2008 to $2.03 in 2009. One cause of the increase in EPS is found in the notes to the financial statements (not shown). The note describing the calculation of EPS indicates that the number of weighted-average shares decreased, and another note indicates that one reason for the decrease was the company’s repurchase of some of its own shares during the year. A more important cause of the increase in EPS—shown on the income statement itself—was the significant increase in earnings from continuing operations, from $1,848 million to $3,028 million. Changes in the numerator and denominator explain the changes in EPS arithmetically. To understand the business drivers of those changes requires further research. The next section presents analytical tools that an analyst can use to highlight areas for further examination.
7. ANALYSIS OF THE INCOME STATEMENT
In this section, we apply two analytical tools to analyze the income statement: common-size analysis and income statement ratios. The objective of this analysis is to assess a company’s performance over a period of time—compared with its own past performance or the performance of another company.
7.1. Common-Size Analysis of the Income Statement
Common-size analysis of the income statement can be performed by stating each line item on the income statement as a percentage of revenue.49 Common-size statements facilitate comparison across time periods (time series analysis) and across companies (cross-sectional analysis) because the standardization of each line item removes the effect of size.
To illustrate, Panel A of Exhibit 4-15 presents an income statement for three hypothetical companies in the same industry. Company A and Company B, each with $10 million in sales, are larger (as measured by sales) than Company C, which has only $2 million in sales. In addition, Companies A and B both have higher operating profit: $2 million and $1.5 million, respectively, compared with Company C’s operating profit of only $400,000.
How can an analyst meaningfully compare the performance of these companies? By preparing a common-size income statement, as illustrated in Panel B, an analyst can readily see that the percentages of Company C’s expenses and profit relative to its sales are exactly the same as for Company A. Furthermore, although Company C’s operating profit is lower than Company B’s in absolute dollars, it is higher in percentage terms (20 percent for Company C compared with only 15 percent for Company B). For each $100 of sales, Company C generates $5 more operating profit than Company B. In other words, Company C is relatively more profitable than Company B based on this measure.
The common-size income statement also highlights differences in companies’ strategies. Comparing the two larger companies, Company A reports significantly higher gross profit as a percentage of sales than does Company B (70 percent compared with 25 percent). Given that both companies operate in the same industry, why can Company A generate so much higher gross profit? One possible explanation is found by comparing the operating expenses of the two companies. Company A spends significantly more on research and development and on advertising than Company B. Expenditures on research and development likely result in products with superior technology. Expenditures on advertising likely result in greater brand awareness. So, based on these differences, it is likely that Company A is selling technologically superior products with a better brand image. Company B may be selling its products more cheaply (with a lower gross profit as a percentage of sales) but saving money by not investing in research and development or advertising. In practice, differences across companies are more subtle, but the concept is similar. An analyst, noting significant differences, would do more research and seek to understand the underlying reasons for the differences and their implications for the future performance of the companies.
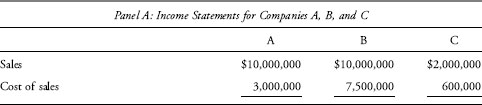
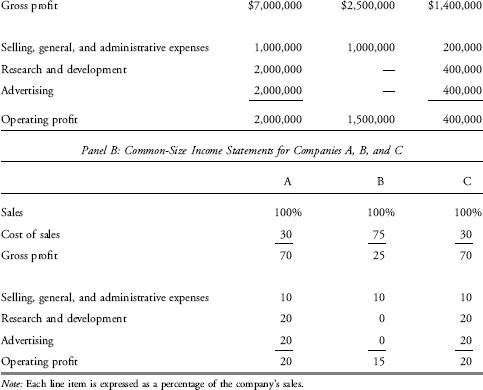
For most expenses, comparison to the amount of sales is appropriate. However, in the case of taxes, it is more meaningful to compare the amount of taxes with the amount of pretax income. Using note disclosure, an analyst can then examine the causes for differences in effective tax rates. To project the companies’ future net income, an analyst would project the companies’ pretax income and apply an estimated effective tax rate determined in part by the historical tax rates.
Vertical common-size analysis of the income statement is particularly useful in cross-sectional analysis—comparing companies with each other for a particular time period or comparing a company with industry or sector data. The analyst could select individual peer companies for comparison, use industry data from published sources, or compile data from databases based on a selection of peer companies or broader industry data. For example, Exhibit 4-16 presents median common-size income statement data compiled for the components of the S&P 500 classified into the 10 S&P/MSCI Global Industrial Classification System (GICS) sectors using 2008 data. Note that when compiling aggregate data such as this, some level of aggregation is necessary and less detail may be available than from peer company financial statements. The performance of an individual company can be compared with industry or peer company data to evaluate its relative performance.
EXHIBIT 4-16 Median Common-Size Income Statement Statistics for the S&P 500 Classified by S&P/MSCI GICS Sector—Data for 2008
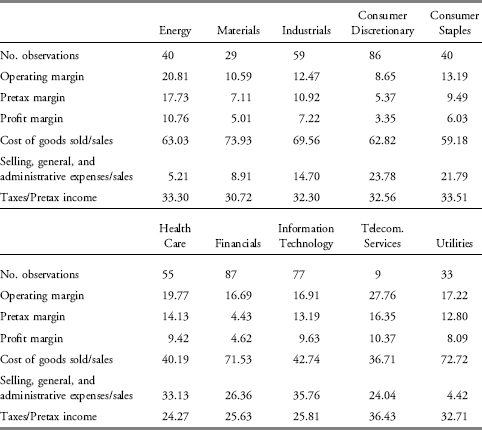
7.2. Income Statement Ratios
One aspect of financial performance is profitability. One indicator of profitability is net profit margin, also known as profit margin and return on sales, which is calculated as net income divided by revenue (or sales).50
![]()
Net profit margin measures the amount of income that a company was able to generate for each dollar of revenue. A higher level of net profit margin indicates higher profitability and is thus more desirable. Net profit margin can also be found directly on the common-size income statements.
For Kraft Foods, net profit margin for 2009 was 7.5 percent (calculated as earnings from continuing operations, net of noncontrolling interests, of $3,021 million, divided by net revenues of $40,386 million). To judge this ratio, some comparison is needed. Kraft’s profitability can be compared with that of another company or with its own previous performance. Compared with previous years, Kraft’s profitability is higher than in 2008 and roughly equivalent to 2007. In 2008, net profit margin was 6.9 percent, and in 2007, it was 7.6 percent.
Another measure of profitability is the gross profit margin. Gross profit (gross margin) is calculated as revenue minus cost of goods sold, and the gross profit margin is calculated as the gross profit divided by revenue.
![]()
The gross profit margin measures the amount of gross profit that a company generated for each dollar of revenue. A higher level of gross profit margin indicates higher profitability and thus is generally more desirable, although differences in gross profit margins across companies reflect differences in companies’ strategies. For example, consider a company pursuing a strategy of selling a differentiated product (e.g., a product differentiated based on brand name, quality, superior technology, or patent protection). The company would likely be able to sell the differentiated product at a higher price than a similar, but undifferentiated, product and, therefore, would likely show a higher gross profit margin than a company selling an undifferentiated product. Although a company selling a differentiated product would likely show a higher gross profit margin, this may take time. In the initial stage of the strategy, the company would likely incur costs to create a differentiated product, such as advertising or research and development, which would not be reflected in the gross margin calculation.
Kraft’s gross profit (shown in Exhibit 4-2) was $14,600 million in 2009, $13,844 million in 2008, and $12,202 million in 2007. Expressing gross profit as a percentage of net revenues, we see that the gross profit margin was 36.2 percent in 2009, 33.0 percent in 2008, and 34.0 percent in 2007. In absolute terms, Kraft’s gross profit was higher in 2008 than in 2007. However Kraft’s gross profit margin was lower in 2008.
Exhibit 4-17 presents a common-size income statement for Kraft, and highlights certain profitability ratios. The net profit margin and gross profit margin described earlier are just two of the many subtotals that can be generated from common-size income statements. Other “margins” used by analysts include the operating profit margin (operating income divided by revenue) and the pretax margin (earnings before taxes divided by revenue).
EXHIBIT 4-17 Kraft’s Margins—Abbreviated Common-Size Income Statement
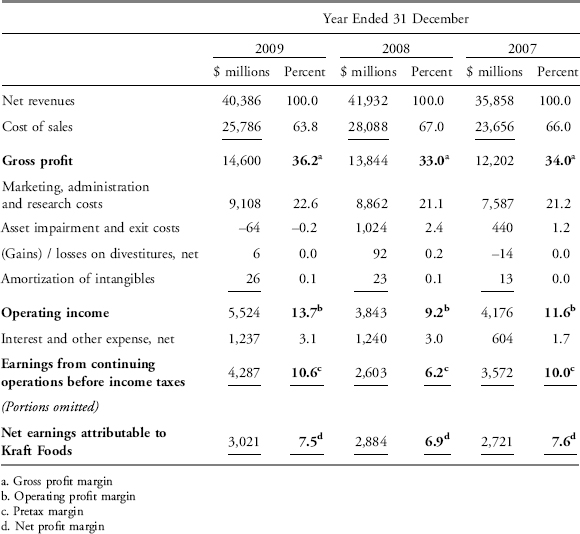
The profitability ratios and the common-size income statement yield quick insights about changes in a company’s performance. For example, Kraft’s increase in profitability in 2009 was not driven by an increase in revenues. (In fact, net revenues were lower than in 2008.) Instead the company’s improved profitability in 2009 was driven primarily by its higher gross profit margins. Given the economic climate in 2008, the company likely had to lower prices and/or incur higher promotional costs in order to stimulate demand for its products (downward pressure on net revenues). Another driver of the company’s improved profitability in 2009 was a lower amount of asset impairment and exit costs. The profitability ratios and the common-size income statement thus serve to highlight areas about which an analyst might wish to gain further understanding.
The general expression for net income is revenue minus expenses. There are, however, certain items of revenue and expense that, by accounting convention, are excluded from the net income calculation. To understand how reported shareholders’ equity of one period links with reported shareholders’ equity of the next period, we must understand these excluded items, known as other comprehensive income.
Under IFRS, total comprehensive income is “the change in equity during a period resulting from transaction and other events, other than those changes resulting from transactions with owners in their capacity as owners.”51 Under U.S. GAAP, comprehensive income is defined as “the change in equity [net assets] of a business enterprise during a period from transactions and other events and circumstances from nonowner sources. It includes all changes in equity during a period except those resulting from investments by owners and distributions to owners.”52 While the wording differs, comprehensive income includes the same items under IFRS and U.S. GAAP. So, comprehensive income includes both net income and other revenue and expense items that are excluded from the net income calculation (other comprehensive income). Assume, for example, a company’s beginning shareholders’ equity is €110 million, its net income for the year is €10 million, its cash dividends for the year are €2 million, and there was no issuance or repurchase of common stock. If the company’s actual ending shareholders’ equity is €123 million, then €5 million [€123−(€110+€10−€2)] has bypassed the net income calculation by being classified as other comprehensive income. If the company had no other comprehensive income, its ending shareholders’ equity would have been €118 million [€110+€10−€2].
Four types of items are treated as other comprehensive income under both IFRS and U.S. GAAP.53 (The specific treatment of some of these items differs between the two sets of standards, but these types of items are common to both.)
1. Foreign currency translation adjustments. In consolidating the financial statements of foreign subsidiaries, the effects of translating the subsidiaries’ balance sheet assets and liabilities at current exchange rates are included as other comprehensive income.
2. Unrealized gains or losses on derivatives contracts accounted for as hedges. Changes in the fair value of derivatives are recorded each period, but these changes in value for certain derivatives (those considered hedges) are treated as other comprehensive income and thus bypass the income statement.
3. Unrealized holding gains and losses on a certain category of investment securities, namely, available-for-sale securities.
4. Certain costs of a company’s defined benefit post-retirement plans that are not recognized in the current period.
In addition, under IFRS, other comprehensive income includes certain changes in the value of long-lived assets that are measured using the revaluation model rather than the cost model.
The third type of item is perhaps the simplest to illustrate. Holding gains on securities arise when a company owns securities over an accounting period, during which time the securities’ value increases. Similarly, holding losses on securities arise when a company owns securities over a period during which time the securities’ value decreases. If the company has not sold the securities (i.e., realized the gain or loss), its holding gain or loss is said to be unrealized. The question is: Should the company reflect these unrealized holding gains and losses in its income statement?
According to accounting standards, the answer depends on how the company has categorized the securities. Categorization depends on what the company intends to do with the securities. If the company intends to actively trade the securities, the answer is yes; the company should categorize the securities as trading securities and reflect unrealized holding gains and losses in its income statement. However, if the company does not intend to actively trade the securities, the securities may be categorized as available-for-sale securities. For available-for-sale securities, the company does not reflect unrealized holding gains and losses in its income statement. Instead, unrealized holding gains and losses on available-for-sale securities bypass the income statement and go directly to shareholders’ equity.
Even though unrealized holding gains and losses on available-for-sale securities are excluded from a company’s net income, they are included in a company’s comprehensive income.
Both IFRS and U.S. GAAP currently provide companies with some flexibility in reporting comprehensive income. IFRS currently allow companies two alternative presentations: either two statements—a separate income statement and a second statement additionally including other comprehensive income—or a single statement of other comprehensive income.54 U.S. GAAP give companies both of those alternatives plus another. Under U.S. GAAP, a company can report comprehensive income at the bottom of the income statement, on a separate statement of comprehensive income, or as a column in the statement of shareholders’ equity.55 Particularly in comparing financial statements of two companies, it is relevant to examine significant differences in comprehensive income.
EXAMPLE 4-20 Other Comprehensive Income
Assume a company’s beginning shareholders’ equity is €200 million, its net income for the year is €20 million, its cash dividends for the year are €3 million, and there was no issuance or repurchase of common stock. The company’s actual ending shareholders’ equity is €227 million.
1. What amount has bypassed the net income calculation by being classified as other comprehensive income?
A. €0
B. €7 million
C. €10 million
2. Which of the following statements best describes other comprehensive income?
A. Income earned from diverse geographic and segment activities.
B. Income that increases stockholders’ equity but is not reflected as part of net income.
C. Income earned from activities that are not part of the company’s ordinary business activities.
Solution to 1: C is correct. If the company’s actual ending shareholders’ equity is €227 million, then €10 million [€227 − (€200+€20−€3)] has bypassed the net income calculation by being classified as other comprehensive income.
Solution to 2: B is correct. Answers A and C are not correct because they do not specify whether such income is reported as part of net income and shown in the income statement.
EXAMPLE 4-21 Other Comprehensive Income in Analysis
An analyst is looking at two comparable companies. Company A has a lower price/earnings (P/E) ratio than Company B, and the conclusion that has been suggested is that Company A is undervalued. As part of examining this conclusion, the analyst decides to explore the question: What would the company’s P/E look like if total comprehensive income per share—rather than net income per share—were used as the relevant metric?
| Company A | Company B | |
| Price | $35 | $30 |
| EPS | $1.60 | $0.90 |
| P/E ratio | 21.9x | 33.3x |
| Other comprehensive income (loss) $ million | ($16.272) | ($1.757) |
| Shares (millions) | 22.6 | 25.1 |
Solution: As shown in the following table, part of the explanation for Company A’s lower P/E ratio may be that its significant losses—accounted for as other comprehensive income (OCI)—are not included in the P/E ratio.
| Company A | Company B | |
| Price | $35 | $30 |
| EPS | $1.60 | $0.90 |
| OCI (loss) $ million | ($16.272) | ($1.757) |
| Shares (millions) | 22.6 | 25.1 |
| OCI (loss) per share | ($0.72) | ($0.07) |
| Comprehensive EPS=EPS+OCI per share | $0.88 | $0.83 |
| Price/Comprehensive EPS ratio | 39.8x | 36.1x |
This chapter has presented the elements of income statement analysis. The income statement presents information on the financial results of a company’s business activities over a period of time; it communicates how much revenue the company generated during a period and what costs it incurred in connection with generating that revenue. A company’s net income and its components (e.g., gross margin, operating earnings, and pretax earnings) are critical inputs into both the equity and credit analysis processes. Equity analysts are interested in earnings because equity markets often reward relatively high- or low-earnings growth companies with above-average or below-average valuations, respectively. Fixed-income analysts examine the components of income statements, past and projected, for information on companies’ abilities to make promised payments on their debt over the course of the business cycle. Corporate financial announcements frequently emphasize income statements more than the other financial statements.
Key points to this chapter include the following:
- The income statement presents revenue, expenses, and net income.
- The components of the income statement include: revenue; cost of sales; sales, general, and administrative expenses; other operating expenses; nonoperating income and expenses; gains and losses; nonrecurring items; net income; and EPS.
- An income statement that presents a subtotal for gross profit (revenue minus cost of goods sold) is said to be presented in a multistep format. One that does not present this subtotal is said to be presented in a single-step format.
- Revenue is recognized in the period it is earned, which may or may not be in the same period as the related cash collection. Recognition of revenue when earned is a fundamental principal of accrual accounting.
- In limited circumstances, specific revenue recognition methods may be applicable, including percentage of completion, completed contract, installment sales, and cost recovery.
- An analyst should identify differences in companies’ revenue recognition methods and adjust reported revenue where possible to facilitate comparability. Where the available information does not permit adjustment, an analyst can characterize the revenue recognition as more or less conservative and thus qualitatively assess how differences in policies might affect financial ratios and judgments about profitability.
- The general principles of expense recognition include a process to match expenses either to revenue (such as cost of goods sold) or to the time period in which the expenditure occurs (period costs such as, administrative salaries) or to the time period of expected benefits of the expenditures (such as depreciation).
- In expense recognition, choice of method (i.e., depreciation method and inventory cost method), as well as estimates (i.e., uncollectible accounts, warranty expenses, assets’ useful life, and salvage value) affect a company’s reported income. An analyst should identify differences in companies’ expense recognition methods and adjust reported financial statements where possible to facilitate comparability. Where the available information does not permit adjustment, an analyst can characterize the policies and estimates as more or less conservative and thus qualitatively assess how differences in policies might affect financial ratios and judgments about companies’ performance.
- To assess a company’s future earnings, it is helpful to separate those prior years’ items of income and expense that are likely to continue in the future from those items that are less likely to continue.
- Under IFRS, a company should present additional line items, headings, and subtotals beyond those specified when such presentation is relevant to an understanding of the entity’s financial performance Some items from prior years clearly are not expected to continue in future periods and are separately disclosed on a company’s income statement. Under U.S. GAAP, two such items are specified (1) discontinued operations and (2) extraordinary items (IFRS prohibit reporting any item of income or expense as extraordinary). Both of these items are required to be reported separately from continuing operations, under U.S. GAAP.
- For other items on a company’s income statement, such as unusual items and accounting changes, the likelihood of their continuing in the future is somewhat less clear and requires the analyst to make some judgments.
- Nonoperating items are reported separately from operating items on the income statement.
- Basic EPS is the amount of income available to common shareholders divided by the weighted average number of common shares outstanding over a period. The amount of income available to common shareholders is the amount of net income remaining after preferred dividends (if any) have been paid.
- If a company has a simple capital structure (i.e., one with no potentially dilutive securities), then its basic EPS is equal to its diluted EPS. If, however, a company has dilutive securities, its diluted EPS is lower than its basic EPS.
- Diluted EPS is calculated using the if-converted method for convertible securities and the treasury stock method for options.
- Common-size analysis of the income statement involves stating each line item on the income statement as a percentage of sales. Common-size statements facilitate comparison across time periods and across companies of different sizes.
- Two income-statement-based indicators of profitability are net profit margin and gross profit margin.
- Comprehensive income includes both net income and other revenue and expense items that are excluded from the net income calculation.
1. Expenses on the income statement may be grouped by:
A. nature, but not by function.
B. function, but not by nature.
C. either function or nature.
2. An example of an expense classification by function is:
A. tax expense.
B. interest expense.
C. cost of goods sold.
3. Denali Limited, a manufacturing company, had the following income statement information:
| Revenue | $4,000,000 |
| Cost of goods sold | $3,000,000 |
| Other operating expenses | $500,000 |
| Interest expense | $100,000 |
| Tax expense | $120,000 |
Denali’s gross profit is equal to
A. $280,000.
B. $500,000.
C. $1,000,000.
4. Under IFRS, income includes increases in economic benefits from:
A. increases in liabilities not related to owners’ contributions.
B. enhancements of assets not related to owners’ contributions.
C. increases in owners’ equity related to owners’ contributions.
5. Fairplay had the following information related to the sale of its products during 2009, which was its first year of business:
| Revenue | $1,000,000 |
| Returns of goods sold | $100,000 |
| Cash collected | $800,000 |
| Cost of goods sold | $700,000 |
Under the accrual basis of accounting, how much net revenue would be reported on Fairplay’s 2009 income statement?
A. $200,000
B. $900,000
C. $1,000,000
6. If the outcome of a long-term contract can be measured reliably, the preferred accounting method under both IFRS and U.S. GAAP is:
A. the cost recovery method.
B. the completed contract method.
C. the percentage-of-completion method.
7. At the beginning of 2009, Florida Road Construction entered into a contract to build a road for the government. Construction will take four years. The following information as of 31 December 2009 is available for the contract:
| Total revenue according to contract | $10,000,000 |
| Total expected cost | $8,000,000 |
| Cost incurred during 2009 | $1,200,000 |
Assume that the company estimates percentage complete based on costs incurred as a percentage of total estimated costs. Under the completed contract method, how much revenue will be reported in 2009?
A. None
B. $300,000
C. $1,500,000
8. During 2009, Argo Company sold 10 acres of prime commercial zoned land to a builder for $5,000,000. The builder gave Argo a $1,000,000 down payment and will pay the remaining balance of $4,000,000 to Argo in 2010. Argo purchased the land in 2002 for $2,000,000. Using the installment method, how much profit will Argo report for 2009?
A. $600,000
B. $1,000,000
C. $3,000,000
9. Using the same information as in Question 8, how much profit will Argo report for 2009 using the cost recovery method?
A. None
B. $600,000
C. $1,000,000
10. Under IFRS, revenue from barter transactions should be measured based on the fair value of revenue from:
A. similar barter transactions with unrelated parties.
B. similar nonbarter transactions with related parties.
C. similar nonbarter transactions with unrelated parties.
11. Apex Consignment sells items over the Internet for individuals on a consignment basis. Apex receives the items from the owner, lists them for sale on the Internet, and receives a 25 percent commission for any items sold. Apex collects the full amount from the buyer and pays the net amount after commission to the owner. Unsold items are returned to the owner after 90 days. During 2009, Apex had the following information:
- Total sales price of items sold during 2009 on consignment was €2,000,000.
- Total commissions retained by Apex during 2009 for these items was €500,000.
How much revenue should Apex report on its 2009 income statement?
A. €500,000
B. €2,000,000
C. €1,500,000
12. During 2009, Accent Toys Plc., which began business in October of that year, purchased 10,000 units of a toy at a cost of £10 per unit in October. The toy sold well in October. In anticipation of heavy December sales, Accent purchased 5,000 additional units in November at a cost of £11 per unit. During 2009, Accent sold 12,000 units at a price of £15 per unit. Under the first in, first out (FIFO) method, what is Accent’s cost of goods sold for 2009?
A. £120,000
B. £122,000
C. £124,000
13. Using the same information as in Question 12, what would Accent’s cost of goods sold be under the weighted average cost method?
A. £120,000
B. £122,000
C. £124,000
14. Which inventory method is least likely to be used under IFRS?
A. First in, first out (FIFO)
B. Last in, first out (LIFO)
C. Weighted average
15. At the beginning of 2009, Glass Manufacturing purchased a new machine for its assembly line at a cost of $600,000. The machine has an estimated useful life of 10 years and estimated residual value of $50,000. Under the straight-line method, how much depreciation would Glass take in 2010 for financial reporting purposes?
A. $55,000
B. $60,000
C. $65,000
16. Using the same information as in Question 15, how much depreciation would Glass take in 2009 for financial reporting purposes under the double-declining balance method?
A. $60,000
B. $110,000
C. $120,000
17. Which combination of depreciation methods and useful lives is most conservative in the year a depreciable asset is acquired?
A. Straight-line depreciation with a short useful life.
B. Declining balance depreciation with a long useful life.
C. Declining balance depreciation with a short useful life.
18. Under IFRS, a loss from the destruction of property in a fire would most likely be classified as:
A. an extraordinary item.
B. continuing operations.
C. discontinued operations.
19. For 2009, Flamingo Products had net income of $1,000,000. At 1 January 2009, there were 1,000,000 shares outstanding. On 1 July 2009, the company issued 100,000 new shares for $20 per share. The company paid $200,000 in dividends to common shareholders. What is Flamingo’s basic earnings per share for 2009?
A. $0.80
B. $0.91
C. $0.95
20. Cell Services Inc. (CSI) had 1,000,000 average shares outstanding during all of 2009. During 2009, CSI also had 10,000 options outstanding with exercise prices of $10 each. The average stock price of CSI during 2009 was $15. For purposes of computing diluted earnings per share, how many shares would be used in the denominator?
A. 1,003,333
B. 1,006,667
C. 1,010,000
1The International Accounting Standards Board (IASB) issues International Financial Reporting Standards (IFRS), which have been adopted as the accounting standards in many countries in the world. International Accounting Standard (IAS) 1, Presentation of Financial Statements, establishes the presentation and minimum content requirements of financial statements and guidelines for the structure of financial statements.
2The single authoritative source of U.S. GAAP is the Financial Accounting Standards Board (FASB) Accounting Standards CodificationTM (FASB ASC). FASB ASC Section 220-10-45 [Comprehensive Income–Overall–Other Presentation Matters] discusses acceptable formats in which to present income, other comprehensive income, and comprehensive income.
3In this chapter, the term income statement will be used to describe either the separate statement that reports profit or loss used for earnings per share calculations or that section of a statement of comprehensive income that reports the same profit or loss.
4Sales is sometimes understood to refer to the sale of goods, whereas revenue can include the sale of goods or services; however, the terms are often used interchangeably. In some countries, such as South Africa, turnover may be used in place of revenue. For an example of this, the reader can look at the Sasol (JSE: SOL) Annual Financial Statements 2009.
5Following net income, the income statement will also present earnings per share, the amount of earnings per common share of the company. Earnings per share will be discussed in detail later in this chapter, and the per-share display has been omitted from these exhibits to focus on the core income statement.
6IASB Framework for the Preparation and Presentation of Financial Statements, paragraphs 74 to 80.
7Requirements are presented in IAS 1, Presentation of Financial Statements.
8Later chapters will provide additional information about alternative methods to calculate cost of goods sold.
9IASB Framework for the Preparation and Presentation of Financial Statements (1989), paragraph 69. The text on the elements of financial statements and their recognition and measurement is the same in the 1989 Framework and the IASB Conceptual Framework for Financial Reporting (2010).
10Ibid., paragraph 70.
11In June 2010, IASB and FASB issued a joint proposal for a standard on revenue recognition. If adopted, there will be a single revenue recognition standard for IFRS and U.S. GAAP. The standards in this chapter are those in effect 30 June 2010 and do not reflect the proposed standard.
12IAS No. 18, Revenue, paragraph 14.
13IAS 18 IE describes a “consignment sale” as one in which the recipient undertakes to sell the goods on behalf of the shipper (seller). Revenue is recognized by the shipper when the recipient sells the goods to a third party. IAS 18 IE, Illustrative Examples, paragraph 2.
14IAS No. 18, Revenue, paragraph 20.
15FASB ASC Section 605-10-25 [Revenue Recognition-Overall-Recognition].
16The content of SEC Staff Accounting Bulletin 101 is contained in FASB ASC Section 605-10-S99 [Revenue Recognition-Overall-SEC Materials].
17IAS No. 18, Revenue, paragraph 21.
18IAS No. 11, Construction Contracts.
19IAS No. 18 IE, Illustrative Examples, paragraph 8.
20IFRIC Interpretation 15, Agreements for the Construction of Real Estate, distinguishes three types of agreements for real estate construction (construction contract, rendering services, sale of goods) to determine whether the revenue recognition methods described under long-term contracts apply.
21FASB ASC Section 360-20-55 [Property, Plant, and Equipment-Real Estate Sales-Implementation Guidance and Illustrations].
22IASB, SIC Interpretation 31, Revenue—Barter Transactions Involving Advertising Services, paragraph 5.
23FASB ASC paragraph 605-20-25-14 [Revenue Recognition-Services-Recognition-Advertising Barter Services].
24FASB ASC Section 605-45-45 [Revenue Recognition-Principal Agent Considerations-Other Presentation Matters].
25IASB Framework for the Preparation and Presentation of Financial Statements, paragraph 70.
26Ibid., paragraphs 78–80.
27Ibid., paragraph 94.
28Ibid., paragraph 95.
29Practically, the reason some companies choose to use LIFO in the United States is to reduce taxes. When prices and inventory quantities are rising, LIFO will normally result in higher cost of goods sold and lower income and hence lower taxes. U.S. tax regulations require that if LIFO is used on a company’s tax return, it must also be used on the company’s GAAP financial statements.
30If data on the precise timing of quarterly sales were available, the answer would differ because the cost of goods sold would be determined during the quarter rather than at the end of the quarter.
31Intangible assets with indefinite life are not amortized. Instead, they are reviewed each period as to the reasonableness of continuing to assume an indefinite useful life and are tested at least annually for impairment (i.e., if the recoverable or fair value of an intangible asset is materially lower than its value in the company’s books, the value of the asset is considered to be impaired and its value must be decreased). IAS 38, Intangible Assets and FASB ASC Topic 350 [Intangibles—Goodwill and Other].
32IAS No. 16, Property, Plant, and Equipment
33IAS 38, Intangible Assets.
34Goodwill is recorded in acquisitions and is the amount by which the price to purchase an entity exceeds the amount of net identifiable assets acquired (the total amount of identifiable assets acquired less liabilities assumed).
35In business writing, items expected to continue in the future are often described as “persistent” or “permanent,” whereas those not expected to continue are described as “transitory.”
36IAS No. 1, Presentation of Financial Statements, paragraph 85.
37These requirements apply to material amounts.
38IFRS No. 5, Noncurrent Assets Held for Sale and Discontinued Operations, paragraphs 31–33.
39IAS No. 1, Presentation of Financial Statements, paragraph 87.
40FASB ASC Section 225-20-45 [Income Statement-Extraordinary and Unusual Items–Other Presentation Matters].
41IAS No. 8, Accounting Policies, Changes in Accounting Estimates and Errors, and FASB ASC Topic 250 [Accounting Changes and Error Corrections].
42Ibid.
43FASB ASC Master Glossary.
44Examples of financial services companies are insurance companies, banks, brokers, dealers, and investment companies.
45IAS No. 33, Earnings Per Share.
46FASB ASC Topic 260 [Earnings Per Share].
47A warrant is a call option typically attached to securities issued by a company, such as bonds. A warrant gives the holder the right to acquire the company’s stock from the company at a specified price within a specified time period. IFRS and U.S. GAAP standards regarding earnings per share apply equally to call options, warrants, and equivalent instruments.
48Hereafter, options, warrants, and their equivalents will be referred to simply as “options” because the accounting treatment for EPS calculations is interchangeable for these instruments under IFRS and U.S. GAAP.
49This format can be distinguished as “vertical common-size analysis.” As the chapter on financial statement analysis discusses, there is another type of common-size analysis, known as “horizontal common-size analysis,” that states items in relation to a selected base year value. Unless otherwise indicated, text references to “common-size analysis” refer to vertical analysis.
50In the definition of margin ratios of this type, “sales” is often used interchangeably with “revenue.” “Return on sales” has also been used to refer to a class of profitability ratios having revenue in the denominator.
51IAS 1, Presentation of Financial Statements, paragraph 7.
52FASB ASC Section 220-10-05 [Comprehensive Income–Overall-Overview and Background].
53IAS 1, Presentation of Financial Statements, paragraph 7, and FASB ASC Section 220-10-55-02 [Comprehensive Income–Overall-Implementation Guidance and Illustrations].
54IAS 1, Presentation of Financial Statements, paragraph 81.
55FASB ASC 220-10-45 [Comprehensive Income–Overall-Other Presentation Matters] and FASB ASC 220-10-55 [Comprehensive Income–Overall-Implementation Guidance and Illustrations].