
CHAPTER 17
INTEGRATION OF FINANCIAL STATEMENT ANALYSIS TECHNIQUES
After completing this chapter, you will be able to do the following:
- Demonstrate the use of a framework for the analysis of financial statements given a particular problem, question, or purpose (e.g., valuing equity based on comparables, critiquing a credit rating, obtaining a comprehensive picture of financial leverage, evaluating the perspectives given in management’s discussion of financial results).
- Identify financial reporting choices and biases that affect the quality and comparability of companies’ financial statements, and illustrate how such biases affect financial decisions.
- Evaluate the quality of a company’s financial data, and recommend appropriate adjustments to improve quality and comparability with similar companies, including adjustments for differences in accounting rules, methods, and assumptions.
- Predict the impact on financial statements and ratios, given a change in accounting rules, methods, or assumptions.
- Analyze and interpret the effects of balance sheet modifications, earnings normalization, and cash flow statement related modifications on a company’s financial statements, financial ratios, and overall financial condition.
It is important to keep in mind that financial analysis is the means to the end, and not the end itself. Rather than try to apply every possible technique and tool to every situation, it is more important for the investor to understand the proper type of analysis to apply in a given situation.
The primary reason for performing financial analysis is to facilitate an economic decision. Before making such decisions as whether to lend to a particular long-term borrower or to invest a large sum in a common stock, venture capital vehicle, or private equity candidate, an investor wants to put the odds of a successful outcome on his or her side. Rather than leaving outcomes to chance, financial analysis should identify potential losses and make the potential favorable outcomes more visible.
The purpose of this chapter is to provide examples of the effective use of financial analysis in decision making. The framework for the analysis is shown in Exhibit 17-1. Each of the three case studies is set in a different type of company and has a different focus/purpose and context for the analysis. However, each case study follows the basic framework.
EXHIBIT 17.1 A Financial Statement Analysis Framework
| Phase | Sources of Information | Examples of Output |
| 1. Define the purpose and context of the analysis. |
|
|
| 2. Collect input data. |
|
|
| 3. Process input data, as required, into analytically useful data. |
|
|
| 4. Analyze/interpret the data. |
|
|
| 5. Develop and communicate conclusions and recommendations (e.g., with an analysis report). |
|
|
| 6. Follow up. |
|
|
2. CASE STUDY 1: LONG-TERM EQUITY INVESTMENT
The portfolio manager for the food sector of a large public employee pension fund wants to take a long-term equity stake in a publicly traded food company, and has become interested in Nestlé S.A. (SWX Swiss Exchange: NESN and OTC (NY ADR): NSRGY), a truly global company. In its 2007 management report, Nestlé’s management outlined its long-term objectives for organic growth, continuous margin improvement, and improvement in return on invested capital. The management report indicated the following general strategic direction: “We continue to believe that our greatest opportunity to create value for our shareholders is through further transforming our Food and Beverages business into a Nutrition, Health, and Wellness offering and by improving its performance further.” Those stated objectives captured the portfolio manager’s attention, and the manager has become intrigued with Nestlé as an investment possibility. He commissions an analyst to evaluate Nestlé for consideration as a core holding. Before investing in the company, the portfolio manager has several concerns that he has conveyed to the analyst:
- What are Nestlé’s sources of earnings growth? How sustainable is Nestlé’s performance? In other words, do the company’s reported earnings represent economic reality? And if their performance is indeed robustly reported, will it be repeatable for, say, five to 10 years while the pension fund treats the common stock as a core holding?
- In determining the quality of earnings over a long-term time frame, the portfolio manager wants to understand the relationship of earnings to cash flow.
- Having started out in the investment business as a lending officer, the portfolio manager wants to know how well Nestlé’s balance sheet takes into account the company’s full rights and obligations. Can the capital structure of the company support future operations and strategic plans? Even if the investor is primarily concerned with the earnings power of a possible investee, the balance sheet matters. For example, if asset write-downs or new legal liabilities cripple the company’s financial standing, it is difficult for a company to sustain profitability if it has to repair its balance sheet. Worse still for an investor: If “repairing the balance sheet” means the issuance of dilutive stock, it can be even more costly to existing investors.
The analyst develops a plan of analysis to address the portfolio manager’s concerns by following the framework in Exhibit 17-1. Phases 3 and 4 will be the focus of most of the work.
2.1. Phase 1: Define a Purpose for the Analysis
The analyst articulates the purpose and context of the analysis as isolating the factors that have driven the company’s financial success and assessing their sustainability, while delineating and understanding the risks that may upset the sustainability of returns.
2.2. Phase 2: Collect Input Data
The analyst finds that Nestlé has an extensive library of financial statements on its website. After gathering several years of annual reports, he is ready to begin processing the data.
2.3. Phase 3: Process Data/Phase 4: Analyze/Interpret the Processed Data
The analyst intends to accomplish his purpose stated in Phase 1 through a series of financial analyses, including:
- A DuPont analysis,1
- An analysis of the composition of Nestlé’s asset base,
- An analysis of Nestlé’s capital structure,
- A study of the company’s segments and the allocation of capital among them,
- An examination of the company’s accruals in reporting as they affect earnings quality,
- A study of the company’s cash flows and their adequacy for the company’s continued operations and strategies, and
- Decomposition and analysis of the company’s valuation.
While processing the input data consistent with the needs of the analyses given earlier, he plans to simultaneously interpret and analyze the resulting data. In his view, Phases 3 and 4 of the framework are best considered jointly.
2.3.1. DuPont Analysis
For several reasons, the analyst decides that the best way to first investigate Nestlé is through the lens of a DuPont analysis. The investment is expected to be in the company’s common stock, and ultimately, the DuPont analysis isolates the components affecting the return on common equity. Furthermore, the disaggregation of ROE components leads to more threads to follow in assessing the drivers of Nestlé’s performance. The analyst also intends to investigate the quality of the earnings and the underlying cash flows, as well as investigating the common shareholders’ standing in the Nestlé capital structure.
One basic premise underlying all research and analysis is to constantly look beneath the level of information presented—to constantly strive for disaggregation within information presented, whether it is a single line on a financial statement or within segments of an entire entity. This search for granularity can reveal the sources of a company’s earnings drivers; it can also highlight weaker operations being masked by stronger ones in the aggregate. That premise of “seeking granularity” underlies DuPont analysis: By isolating the different components of return on equity, it helps the analyst find potential operational flaws and provides a springboard for dialogue with management about possible problems.
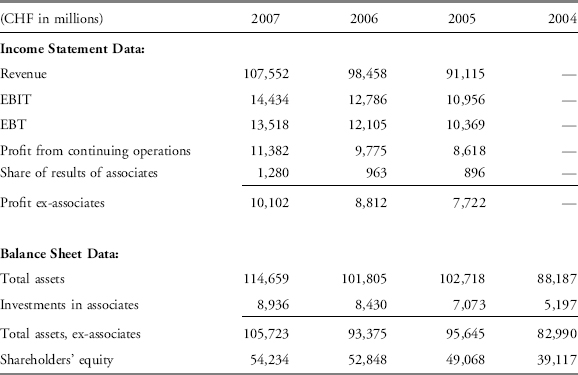
The analyst begins to process the data gathered in Phase 2 to assemble the information required for the DuPont analysis. Exhibit 17-2 shows the past three years of income statements for Nestlé; Exhibit 17-3 shows the past four years of Nestlé balance sheets. From his study of the income statement, the analyst notes that Nestlé has a significant amount of income from associates. In 2007, this amounted to CHF 1,280 million, or 11.2 percent, of Nestlé’s net income (referred to by Nestlé as Profit for the period). The income from associates2 is a pure net income figure, after taxes and with no related revenue in the income statement. Much of the income relates to Nestlé’s 30 percent stock ownership of L’Oreal, a cosmetics company.
The analyst’s interest is to evaluate the company on a decomposed basis as much as possible in order to isolate any problem operations or to find misunderstood or unidentified opportunities. Including the net investments and returns of associates with full reported value of Nestlé’s own assets and income would introduce noise into the analytical signals produced by the DuPont analysis. The returns earned by affiliates are not under the direct control of Nestlé’s management as are the “pure Nestlé” operations and resources. To avoid making incorrect inferences about the profitability of Nestlé’s operations, the analyst wants to remove the effects of the investments in associates from the balance sheet and income statement. Otherwise, DuPont analysis components such as net profit margin and total asset turnover will combine the impact of pure Nestlé operations with operations of associated companies. Conclusions drawn about Nestlé-only business would be based on flawed information.
EXHIBIT 17-2 Nestlé S.A. Income Statements 2007–2005
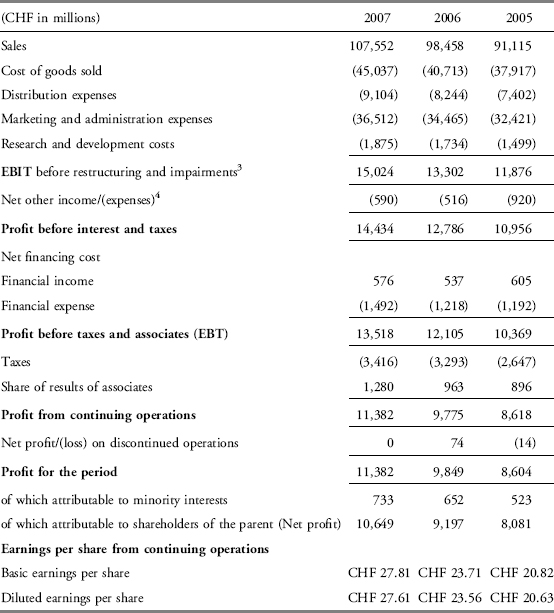
EXHIBIT 17-3 Nestlé S.A. Balance Sheets 2007–2004
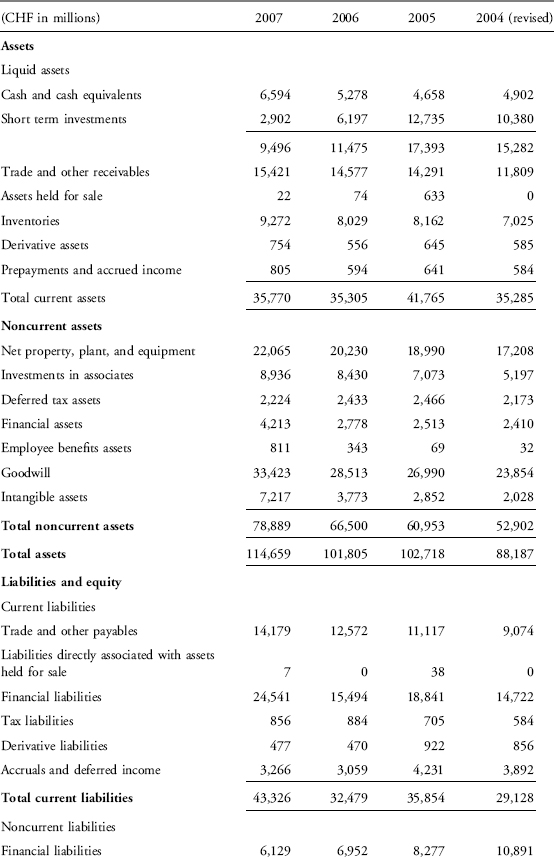
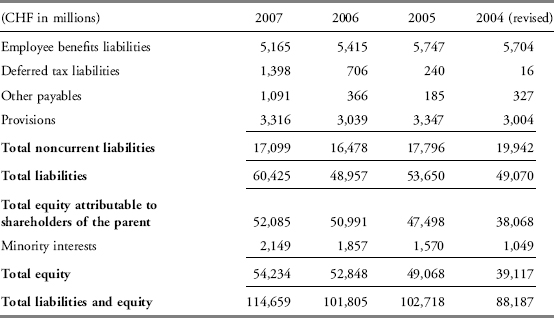
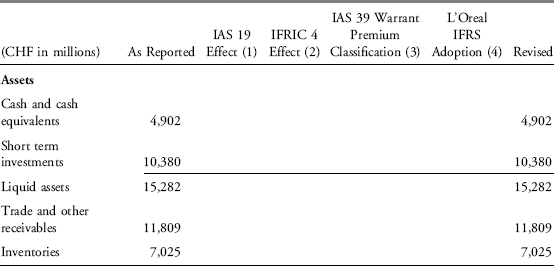
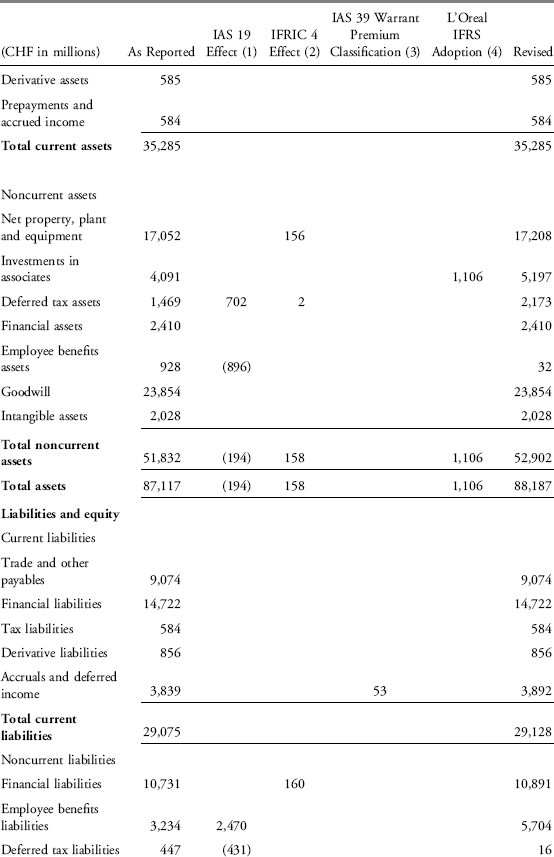
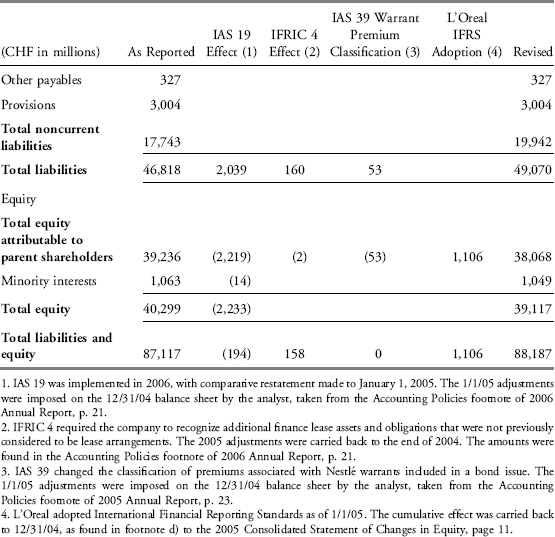
The analyst restated the 2004 balance sheet from the published version to take into account several accounting changes Nestlé made as of 1 January 2005. Those adjustments would have affected 31 December 2004 balances if the financial statements had been restated for that year. In order to keep the DuPont analysis as logically consistent as possible throughout all the periods of study, he restated the 2004 balance sheet for those adjustments by isolating the 1 January 2005 adjustments from the 2005 financial statements, and restating the 31 December 2004 year-end balances for them. They included changes for employee benefits plan accounting (IAS 19 adoption), lease classification (IFRIC 4 adoption), a reclassification of a warrants premium, and the cumulative effect on their investment of L’Oreal’s first-time adoption of International Financial Reporting Standards. The revisions made by the analyst to the as-reported 2004 balance sheet are shown in Exhibit 17-4.
EXHIBIT 17-4 Modifications to 2004 Balance Sheets
The analyst draws the data shown in Exhibit 17-5 from Exhibits 17-2, 17-3, and 17-4 for the preparation of DuPont analysis:
EXHIBIT 17-5 Data Needed for DuPont Analysis
The five-way decomposition of ROE needs to be expanded to account for the presence of the investment in associates and the share of income they provide to Nestlé. Subtracting the investment from total assets results in a figure that more closely represents Nestlé’s own asset base; subtracting the share of results of associates from the net income allows for the analysis of exclusively Nestlé profitability resulting from that exclusively Nestlé asset base. Exhibit 17-6 shows the results of expanding the DuPont analysis.
EXHIBIT 17-6 Expanded DuPont Analysis
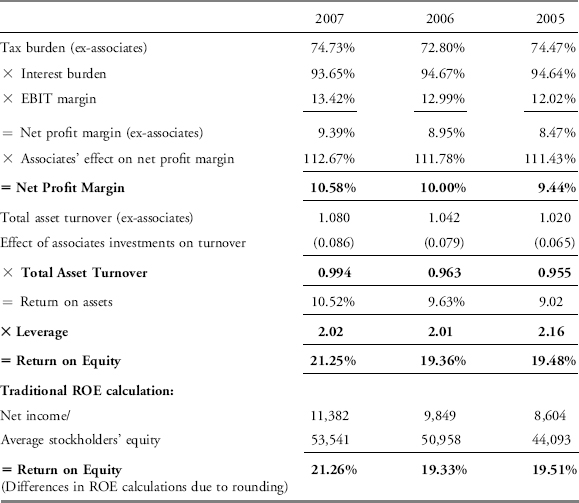
The net profit margin component and the asset turnover component require adjustments to remove the impact of the associates on the return on assets. To adjust the net profit margin component, the analyst subtracts the associates’ income from the net income, and divides it by earnings before taxes. Recall that the number referred to as EBT is profit before taxes and associates (Exhibit 17-2). In 2007 terms, this was represented by (CHF 11,382 net income − 1,280 income from associates)/CHF 13,518 earnings before taxes = 74.73 percent. Interest burden and EBIT or operating profit margin are calculated as usual. Interest burden is calculated by dividing the profit before taxes and associates by the profit before interest and taxes: CHF 13,518/14,434 = 93.65 percent for 2007. The EBIT margin is simply the earnings before interest and taxes (operating profit or income) divided by sales: CHF 14,434/107,552 = 13.42 percent.
Multiplying the three components together produces the net profit margin of Nestlé—9.39 percent in 2007—excluding the associates’ earnings. Calculating the net profit margin in the usual fashion—with the net income figure including the associates’ earnings—yields 10.58 percent (CHF 11,382/107,552). That profit margin is not representative of the Nestlé-only operations. Dividing the net profit margin by the net profit margin without associates income (10.58%/9.39% = 112.67%) quantifies the magnifying effect of the associates’ income on Nestlé’s own margins. Where the “Nestlé-only” entity really earned 9.39 percent on every sales dollar, inclusion of the associates’ income in net profit inflates the net profit margins by 12.67 percent (112.67% × 9.39% = 10.58%); a level that is not representative of what the Nestlé-only entity is capable of producing.
A similar picture of the net profit margin over time emerges from the DuPont analysis after neutralizing the effect of the associates’ earnings. The margin would be greater in each year if the associates’ earnings were included in net profit, as compared to looking at Nestlé alone. While Nestlé showed a consistent upward trend in the three years, the analysis excluding associates’ earnings shows that the company’s profit margins are not necessarily as large without the boost from associates’ earnings.
To calculate a “Nestlé-only” total asset turnover, the asset base also needs to be neutralized for the amount of the investment in associates. In 2007, the adjusted total assets were CHF 105,723 (CHF 114,659 − 8,936 = 105,723); for 2006, the adjusted total assets were CHF 93,375 (CHF 101,805 − 8,430 = 93,375). Dividing the average of the two figures into 2007’s sales yields a “Nestlé-only” total asset turnover rate of 1.080 (CHF 107,552/[(CHF 105,723+93,375)/2] = 1.080). Calculating the total asset turnover from the consolidated financial statements with amounts unadjusted for investments in associates yields a measure of 0.994 (CHF 107,552/[(CHF 114,659+101,805)/2] = 0.994). The difference between the asset turnover based on unadjusted financial statement amounts and the “Nestlé-only” asset turnover reveals the effect on total asset turnover of the investment in associates: a decrease of 0.087 in 2007.
The adjustments thus far have isolated the operational aspects of Nestlé performance and the assets that produced them from non-Nestlé operations. The resulting return on asset signal from the DuPont analysis is free from bias introduced by the affiliates’ results and the contribution to the overall return on assets from the non-Nestlé components is clearly identified.
The financial leverage ratio has not been adjusted by the analyst in similar fashion to profit margins and asset turnover. The DuPont components, profit margins and asset turnover, function fairly discretely: Nestlé assets produce a certain pretax return, as do the non-Nestlé assets. In the DuPont analysis, the assets are isolated from each other and it is possible to see the contributions of each to the aggregate performance. It might be tempting to likewise adjust the financial leverage ratio by subtracting the investment in associates from total assets and equity but it would not improve the DuPont analysis. Without knowledge of how the investment in associates was financed—all debt, all from internally generated cash flow, or a blend—it would be arbitrary to erase the investment amount from the asset base and equity base to arrive at an adjusted financial leverage figure. If such information was available, the analyst might calculate separate financial leverage components as well. In Nestlé’s case, such information is unavailable, and the analyst simply considers the investment to be part of the total assets supported by common equity. The inherent assumption is that a similar capital structure finances the associates’ assets and the Nestlé-only assets.
From Exhibit 17-6, multiplying the three conventionally calculated (including the effect of the associates) ROE components yields the return on equity shown in the top row of Exhibit 17-7. The return on equity exhibits a smooth, steadily increasing trend, when examined without adjusting for investment in associates; however, the analyst wants to see the ROE for Nestlé alone and compare it to the aggregate ROE. Calculating the ROE on a “Nestlé-only” basis is done by multiplying the net profit margin ex-associates’ investment by the total asset turnover ex-associates’ investment by the financial leverage. For 2007, the Nestlé-only ROE was 20.48 percent (9.39% × 1.080 × 2.02 = 20.48%). Exhibit 17-7 shows the ROE prepared on the two bases and the contribution of the associates’ investment to ROE. The trend is similar for the two ROE calculations but the magnitudes of the ROE based on Nestlé only are lower.
EXHIBIT 17-7 ROE Performance Due to Investment in Associates
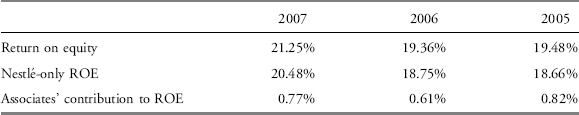
Although the analyst is satisfied with the trend and magnitude of the Nestlé return on equity, he is now aware that a significant amount of Nestlé’s profitability is attributable to the investments in associates. He is convinced that in order to completely understand Nestlé’s earnings drivers, he needs to understand these investments as well. He is somewhat concerned that the spread between “Nestlé-only” profit margins and the aggregate profit margins has widened over the past three years: Referring to Exhibit 17-6, the spread was 1.19 percent in 2007, higher than the 1.05 percent in 2006, which was higher than the 0.97 percent spread in 2005. In fact, the associate income for the past two years has made all the difference between double-digit net profit margins and single-digit profit margins. The analyst makes note to investigate the valuation aspects of the investment holdings later. For now, he is interested in learning more about the drivers of Nestlé’s growth and revenues.
2.3.2. Asset Base Composition
The analyst examines the composition of the balance sheet over time, as shown in Exhibit 17-8.
EXHIBIT 17-8 Asset Composition as a Percentage of Total Assets
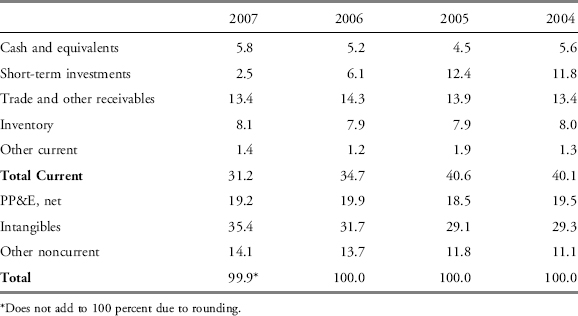
While he expected significant investments in current assets, inventory, and physical plant assets—given that Nestlé is a food manufacturer and marketer—he is surprised to see so much investment in intangible assets, indicating that Nestlé’s success may be due in part to successful acquisitions. The increasing proportion of the asset mix in intangibles and the reduction in short-term investments are consistent with growth through acquisition. The investing section of the cash flow statements, Exhibit 17-9, supports this fact:
EXHIBIT 17-9 Nestlé Investing Activity, 2004–2007
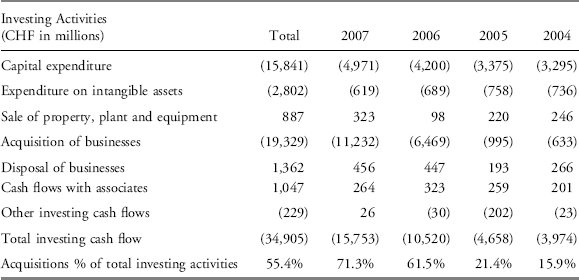
For the four-year period, the acquisition of businesses was a significant part of the total resources dedicated to investment activities—over half for the entire time frame. In the largest acquisition year, 2007, Nestlé acquired Gerber and Novartis Medical Nutrition; the two purchases accounted for 85 percent (CHF 9,535/11,232) of the total cash invested in 2007 for business acquisitions.
2.3.3. Capital Structure Analysis
The analyst then examined Nestlé’s long-term capital structure by constructing a chart on a common-size basis, displayed in Exhibit 17-10.
EXHIBIT 17-10 Percent of Long-Term Capital Structure
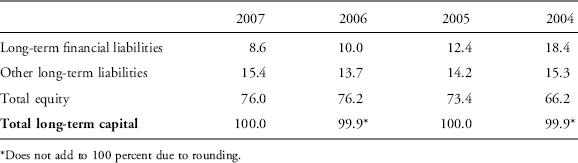
Although the DuPont analysis indicated that the company had deleveraged somewhat over the past three years—financial leverage decreased from 2.16 in 2005 to 2.02 in 2007—the leverage ratio alone does not show much about the nature of the leverage. For example, the financial burden imposed by bond debt is more onerous and bears more consequences in the event of default than does restructuring provisions or employee benefit plan obligations. A look at Exhibit 17-10 reveals that Nestlé has been making its capital structure substantially less financially risky over the past five years. Not only is the proportion of the less risky equity financing rising—from 66.2 percent in 2004 to 76.0 percent in 2007—the more risky long-term financial liabilities have become a significantly smaller part of the capital mix, dropping to 8.6 percent in 2007 from 18.4 percent in 2004. Meanwhile, the “other long-term liabilities” (primarily employee benefit plan obligations and provisions) have remained at nearly the same proportion of the financing mix over the period.
Given the deleveraging occurring in the long-term capital structure, the analyst wonders if there has been any offsetting change in the company’s working capital accounts. He decides to examine Nestlé’s liquidity situation; and from the financial statements in Exhibits 17-2 and 17-3, he constructs the table shown in Exhibit 17-11.
EXHIBIT 17-11 Nestlé Working Capital Accounts and Ratios, 2004–20075
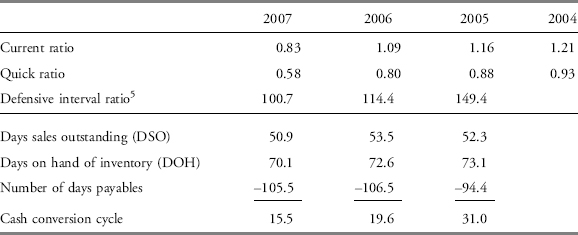
A significant increase in the current portion of the financial liabilities is responsible for the current ratio’s deterioration between 2006 and 2007. He notes that the company’s quick ratio and defensive interval ratio have also deteriorated in the past few years. The company seems to be responding by more aggressively managing its receivables and inventories; both receivables DSOs and inventory DOHs have improved in 2007 over 2006. While the decline in the actual working capital ratios is a concern, it is mitigated by the improvement in the management of receivables, inventory, and payables. Those improvements provide evidence that the company’s managers are moving in the right direction on the management of working capital.
2.3.4. Segment Analysis/Capital Allocation
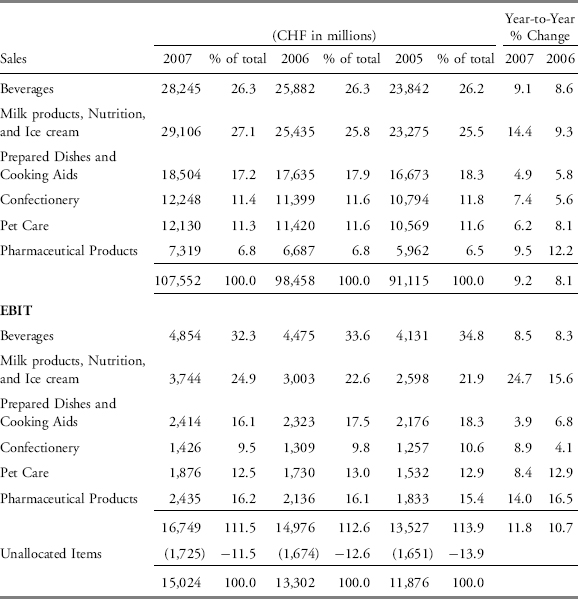
To understand any geopolitical investment risks, as well as the economies in which Nestlé operates, the analyst wants to know which geographic areas are of the greatest importance to the company. One issue the analyst confronts is the fact that Nestlé reports segment information by management responsibility and geographical area (hereafter referred to as “segment”), not by segments based exclusively on geographic areas. From the segment information in Exhibit 17-12, he notes that the European business, while still growing, is a lesser part of the revenue stream than two years ago; Nestlé Americas and Asia, Oceania, and Africa sectors show a similar decline as a percentage of revenues. All of the geographic sectors are growing in terms of absolute amount of revenues and EBIT, but they appear proportionally smaller each year because of the way Nestlé displays its Waters, Nutrition, and Other Food and Beverage segments: Their operations are not segmented geographically, but are shown on a global basis. Not only are they not included in the geographic information, they have also grown significantly in the past several years through acquisition: As pointed out earlier, the company acquired Gerber and Novartis Medical Nutrition in 2007. Those acquisitions, included into the nongeographic categories, make the three geographic categories look less material in the aggregate, from year to year. Nevertheless, the Americas sector appears to be the single most significant segment in terms of size and growth of both sales and EBIT.
EXHIBIT 17-12 Sales and EBIT by Segment
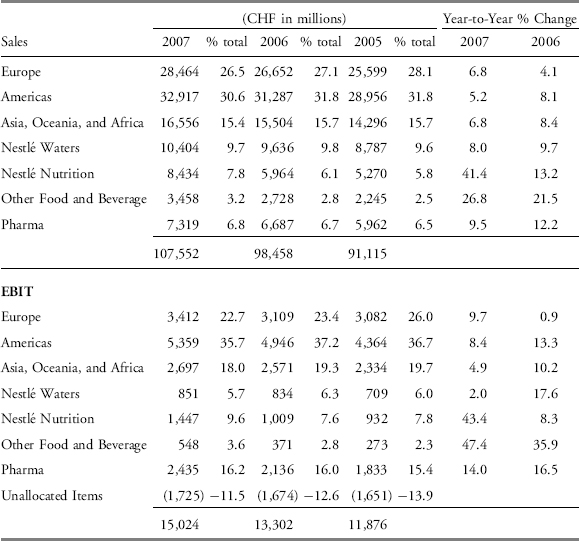
Because of a realignment of segments in 2006 and the lack of complete restated data, the analyst cannot make meaningful comparisons to years before 2005.
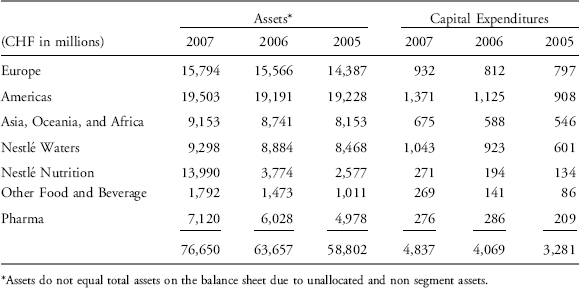
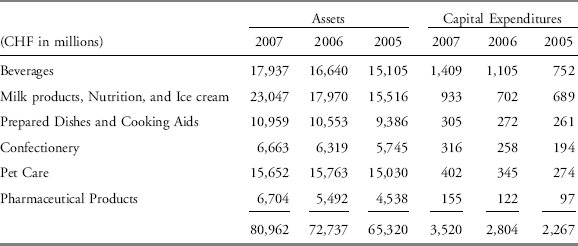
The analyst is curious about the company’s capital allocation decisions based on the geographic segments. Exhibit 17-13 shows the segment information regarding Nestlé’s capital expenditures and assets.
EXHIBIT 17-13 Asset and Capital Expenditure Segment Information
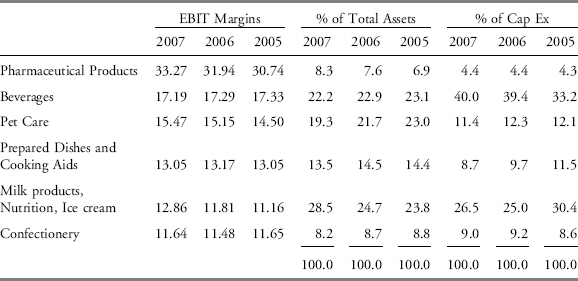
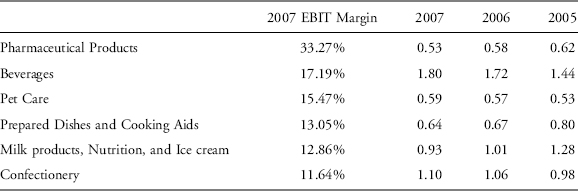
Using the information from Exhibit 17-12 to calculate EBIT margins, and using the information about the asset and capital expenditure distribution from Exhibit 17-13, the analyst constructs the table in Exhibit 17-14, ranked by descending order of EBIT profitability.
EXHIBIT 17-14 EBIT Margins, Asset, and Capital Expenditure Proportions by Segment
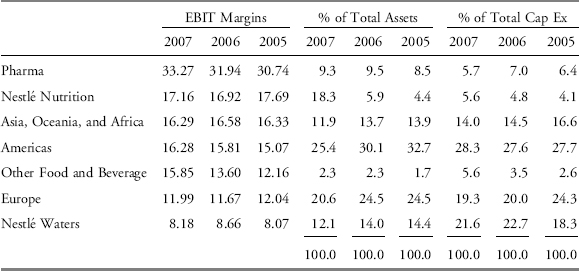
Although the segmentation is not purely geographical, the analyst can still make some judgments about the allocation of capital. On the premise that the largest investments in assets will require a similar proportion of capital expenditures, he calculates a ratio of capital expenditures proportion to total asset proportion for the past three years, and compares them to the current EBIT profitability ranking. The resulting table is shown in Exhibit 17-15.
EXHIBIT 17-15 Ratio of Capital Expenditures Percent to Total Asset Percent Ranked by EBIT Margin
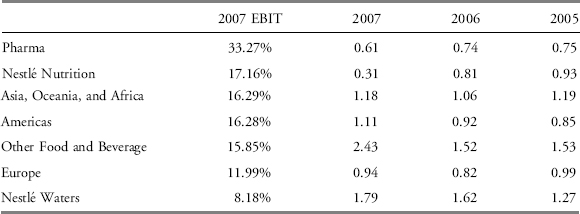
A ratio of 1 indicates that the segment’s proportion of capital expenditures is the same as its proportion of total assets. A ratio below 1 indicates that the segment is being allocated a lesser proportion of capital expenditures than its proportion of total assets; if a trend develops, the segment will become less significant over time. A ratio above 1 indicates the company is growing the segment. Comparing the ratio to the EBIT margin percentage gives the analyst an idea of whether the company is investing its capital in the most profitable segments.
Pharma, by the nature of the business, has significant research and development expenses and yet has the highest margins. It requires little in the way of invested assets and maintenance capital expenditures. Nutrition has similar characteristics, but to a lesser degree. The two are the highest EBIT margin segments, yet Nestlé has invested in both of them at a less aggressive rate, judging by the ratio of capital expenditures proportions to total assets proportions. The Nutrition segment, however, received significant investment in 2007 through the acquisition of Novartis Medical Nutrition and Gerber. The Pharma segment, consisting largely of U.S. eye-care company Alcon, is extremely profitable but is an outlier in terms of Nestlé’s current portfolio. Given the differences in the food and pharmaceutical businesses, it would seem unlikely that the world’s largest food company would elect to seriously grow the pharmaceutical segment. However, investment in Pharma is consistent with the objective stated in the management report to be recognized as a leader in Nutrition, Health, and Wellness. It was the strategy of transformation that initially appealed to the portfolio manager.
Investments in the Asia, Oceania, and Africa and the Americas segments have typically been in “growth” mode over the past three years; the proportion of capital expenditures to the proportion of total assets in each of these two segments is typically slightly above 1 annually. Given that these are large and well-margined segments, the capital allocation decisions appear reasonable.
The Other Food and Beverage segment appears problematic: While its EBIT margin is on almost the same level as the Asia, Oceania, and Africa and Americas segments, it is still the third-lowest segment in terms of profitability. Yet the capital expenditures devoted to it over the past three years are in a rapid growth mode. It may be that the segment is a catch-all, or it may be the development of another line of business that will become more visible in the future; for now, the analyst notes that while it could be a problem or a promise, it is a small part of Nestlé’s asset base, revenues, and EBIT and thus not of great concern at this time.
The Nestlé Waters segment is a much greater concern to the analyst. Its EBIT margin is about two-thirds of the next highest-ranked segment; and at 8.18 percent, it is well below the 13.42 percent company-wide EBIT margin (see Exhibit 17-6). Even after allowing for the fact the Waters segment was charged with a CHF 210 million goodwill write-down in 2007, the segment’s EBIT margin was only 10.20 percent—still well below the other segments. The fact that the Waters segment was the source of a goodwill write-down is also a sign that operating weaknesses might be present; otherwise, the cash flow assumptions used in the goodwill testing might have been high enough to prevent the write-down. Nestlé Waters is a significant part of the asset base at 12.1 percent in 2007, and it appears to be a high-maintenance operation. In each of the past three years, the ratio of capital expenditures proportion to total assets proportion shows the segment to be in a growth mode, with a ratio of 1.79, 1.62, and 1.27 in 2007, 2006, and 2005, respectively. In 2007 and 2006, the only segment to have greater absolute dollar capital expenditures was the more highly profitable Americas segment; in 2005, Nestlé Waters was outranked in terms of capital expenditures only by the Americas and Europe segments. In a worst-case scenario, if the company were to continue to allocate capital towards the lowest-margined businesses, the overall Nestlé-only returns might be impacted negatively. As a result, Nestlé might become more dependent on its investment in associates to sustain performance.
The analyst decides to look at Nestlé from a product group standpoint as well. The sales and EBIT information are shown in Exhibit 17-16.
EXHIBIT 17-16 Sales and EBIT Segment Information by Product Group
To further examine capital allocation decisions, the analyst garners the asset and capital expenditure information by product group from the financial statements, as shown in Exhibit 17-17. The total assets and capital expenditures differ between the presentations by segment and product group. Nestlé presents its assets for the product groups on an average basis rather than on a year-end basis as it does for the segment reporting. Further, a significant amount of assets is unallocated to segments, but there is no unallocated amount by product groups. Capital expenditures by segment and product group represent additional investments in PP&E during the year, but the unallocated amount of capital expenditures is far greater by product group.
EXHIBIT 17-17 Asset and Capital Expenditure Segment Information by Product Group
Using the information from Exhibit 17-16 to calculate EBIT margins and the information about the asset and capital expenditure distribution from Exhibit 17-17, the analyst constructs the table in Exhibit 17-18, ranked by descending order of EBIT profitability in 2007.
EXHIBIT 17-18 EBIT Margins, Assets, and Capital Expenditures Proportions by Product Group
He again prepares a schedule of the proportions of capital expenditures and the proportion of total assets for each of the product groups, and calculates the ratio of capital expenditure proportions to total asset proportions, ranked by the 2007 EBIT margin. The resulting table is shown in Exhibit 17-19.
EXHIBIT 17-19 Ratio of Capital Expenditures Percent to Total Asset Percent Ranked by EBIT Margin
The analyst uses this information to make some important observations:
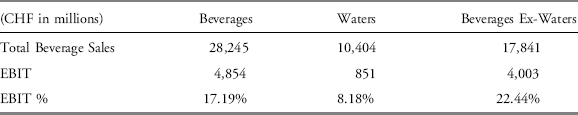
- The beverages product group has a significantly higher EBIT margin than Nestlé Waters EBIT margin of 8.18 percent. Because Nestlé Waters is contained within the beverages product group, the EBIT margins of the other products within the product group category—primarily soluble coffee, according to Nestlé’s 2007 Management Report—must be much greater. The analyst removes the Waters sales and EBIT from the total product group (Exhibit 17-20) and finds that the remaining business is by far the most profitable segment after pharmaceuticals.
EXHIBIT 17-20 EBIT Margin of Beverages with and without Waters
- The analyst reworks the ratios presented in Exhibit 17-19 excluding the assets and capital expenditures for the Nestlé Waters segment. The result in Exhibit 17-21 shows that the management is allocating its capital expenditures to the Beverages business on a growth basis the past year but at a lower rate than for beverages with waters. Given the margins of the product group without Waters, this is a favorable discovery but the amount allocated to waters is problematic.
EXHIBIT 17-21 Ratio of Capital Expenditures Percent to Total Asset Percent Ex-Nestlé Waters, Ranked by EBIT Margin
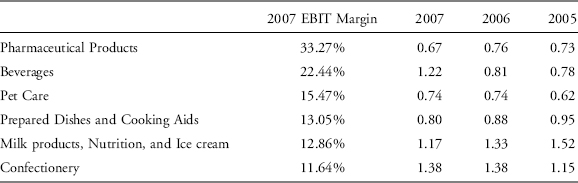
- Less favorable to note under either the original or revised exhibits: The two lowest-ranked product groups—Milk products, Nutrition and Ice cream and Confectionery—have been allocated capital expenditures at a “growth mode” rate for each of the past three years. If the trend continues and margins in these segments do not grow, Nestlé’s company-wide margins could suffer. Further, the allocation to Pharmaceutical Products, the most profitable segment, is cause for concern.
2.3.5. Accruals and Earnings Quality
The consistent profitability exhibited by Nestlé is a desirable attribute, as hoped for and expected of a company operating primarily in the food industry where the demand for the product is typically not cyclical. However, the analyst wants to understand how important a role accruals may play in the company’s performance; he is concerned in case the consistency is a result of earnings management. He decides to examine the balance sheet-based accruals and cash flow-based accruals over the past few years. From the Nestlé financial statements, he assembles the information and intermediate calculations shown in Exhibit 17-22.
EXHIBIT 17-22 Selected Balance Sheet and Cash Flow Statement Information
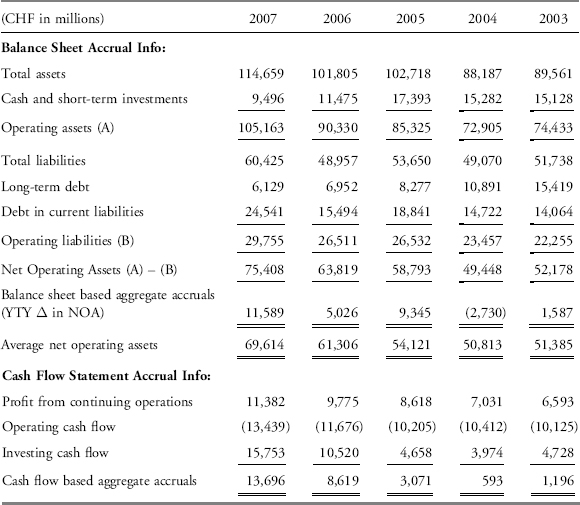
The accruals ratios for the past five years are shown in Exhibit 17-23.
EXHIBIT 17-23 Accruals Ratios
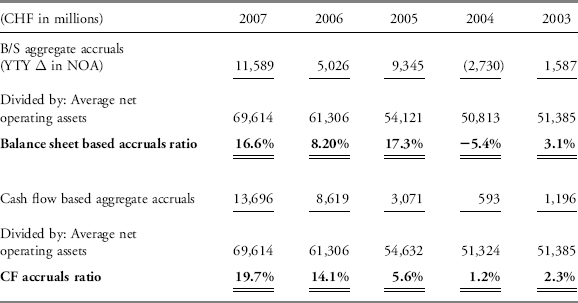
The analyst notes that the absolute level of accruals present in the balance sheet is not extremely high, but it is much higher in the most recent year than in the earlier years. Furthermore, the balance sheet based accruals ratio has fluctuated significantly. The analyst’s concern with the accruals ratio fluctuations is that they could indicate the use of accruals to “time” earnings.
A slightly different, but no less concerning, trend exists for the cash flow based accrual ratio. The accruals ratio is low in the early years of the analysis and increases steadily over time. In 2007 and 2006, they are significantly higher than in the earlier years, indicating a higher degree of accruals present in the company’s earnings.
2.3.6. Cash Flow Relationships
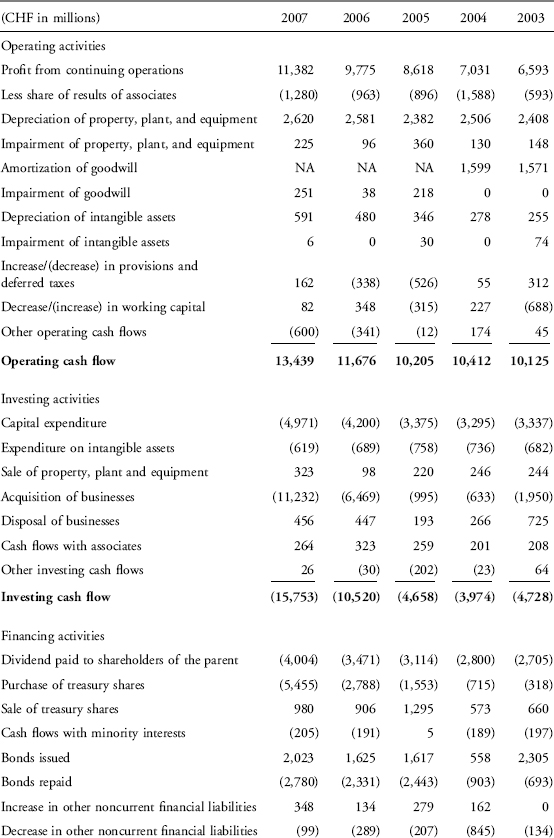
Given his concerns about the possible use of accruals to manage earnings, the analyst decides to study the company’s cash flow and its relationship to net income. He begins his analysis with the compilation of Nestlé’s cash flow statements shown in Exhibit 17-24.
EXHIBIT 17-24 Nestlé Cash Flow Statements, 2003–2007
The analyst’s most pressing concern: Are Nestlé’s operating earnings backed by cash flow, or does the pattern presented by the accrual measures given earlier indicate that the operating earnings may be more of an accounting result? To convince himself of the genuineness of the Nestlé earnings, he first compares the operating cash flow before interest and taxes to the operating income, adjusted for accounting changes as shown in Exhibit 17-25.
EXHIBIT 17-25 Operating Cash Flow to Operating Income, 2003–2007
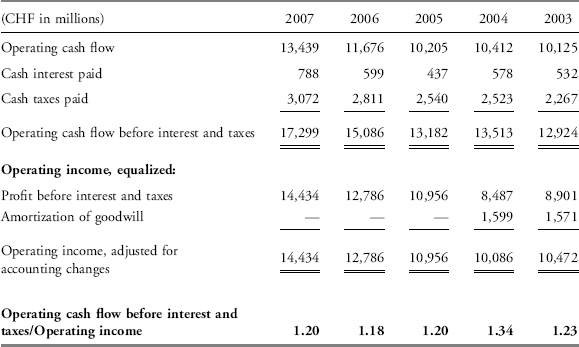
To keep the comparisons between cash flow and earnings symmetrical, the analyst added the cash paid for interest and taxes to the operating cash flow. The resulting operating cash flow before interest and taxes is the relevant operating cash flow for comparison to the operating income. This revision makes the cash from operations more directly comparable to accrual basis operating income; it is effectively the operating income (profit before earnings and taxes or EBIT) on a cash basis. In another adjustment to make all comparisons analogous, the analyst added goodwill amortization to the 2003 and 2004 operating income amounts. International Financial Reporting Standard 3, “Business Combinations,” suspended the amortization of goodwill after 31 March 2004; to subtract the amortization in just two years of operating earnings would result in a misleading trend in the ratio of the relevant operating cash flow to operating earnings.
The analyst is encouraged by the fact that the operating cash flow before interest and taxes substantially exceeded the operating earnings in 2007, and in fact, for each of the past five years. With the exception of 2004, the ratio of the relevant operating cash flow to operating earnings has consistently been around 1.20.
Knowing that Nestlé has made a number of acquisitions, the analyst decides to examine the relationship between operating cash flow and total assets. The total assets reflect the sum total of management’s resource allocations. The relationship is shown in Exhibit 17-26.
EXHIBIT 17-26 Operating Cash Flow to Total Assets, 2003–2007
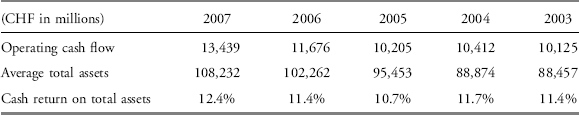
The 2007 cash return on total assets is the highest in the five-year span and fairly consistent during the entire period. A similar pattern of returns, albeit of a higher magnitude, results if operating cash flow before interest and taxes is used. Nevertheless, the analyst is encouraged to do more cash flow analysis due to the results of the accruals analysis, coupled with the slight volatility in the relationship between operating cash flow and operating income. He decides to compare cash flow to reinvestment, debt, and debt-servicing capacity, as shown in Exhibit 17-27.
EXHIBIT 17-27 Operating Cash Flow to Reinvestment, Debt, and Debt-Servicing Capacity, 2003–2007
The current cash flow measures for each metric are strong: Reinvestment needs have been covered by cash flow by a factor of 2.40 in 2007 and 2.39 in 2006, indicating ample resources for the company’s reinvestment program. Those two measures are only slightly lower than the cash flow reinvestment coverage of the prior three years. The decrease is the result of higher amounts of capital expenditures in the recent years compared to the earlier years.
The 2007 cash flow to total debt ratio of 55.5 percent indicates that the company is not highly leveraged. The ratio is high enough to indicate additional borrowing could be arranged should an investment opportunity arise. Further, the analyst notes that Nestlé has the capacity to pay off its debt in approximately four years even while maintaining its current reinvestment policy [31,147/(13,439 − 5,590)].
Finally, the cash flow interest coverage ratio indicates more than satisfactory financial strength in the current year, with cash flow 22.0 times the interest paid. Like the cash flow to total debt ratio, it indicates that the company actually has plenty of financial capacity to add more debt if there is an investment reason. However, the current cash flow to interest is much lower than it was only two years ago at 30.2 times. The analyst is not overly concerned given the recent acquisitions by Nestlé.
2.3.7. Decomposition and Analysis of the Company’s Valuation
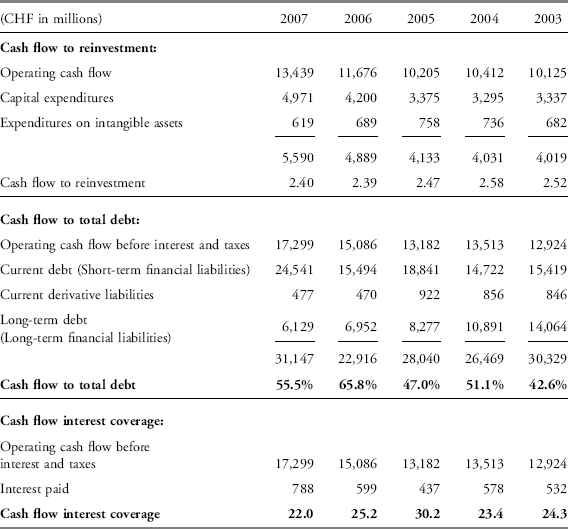
At this point, the analyst believes he has obtained sufficient information about the company’s sources of earnings and returns on shareholder equity, its capital structure, the results of its capital allocation decisions, and its earnings quality. Before he makes his report to the portfolio manager, he wants to study the company’s market valuation. During his reading of the annual report, he noted that Nestlé owns significant equity stakes in Alcon (NYSE: ACL), a U.S. ophthalmic products company (77.4 percent), and L’Oreal (Paris exchange: OR), a French cosmetics company (30.0 percent). By virtue of majority ownership in Alcon, Nestlé consolidates the company in its own financial statements, while L’Oreal is handled in the financial statements as an investment, because Nestlé’s ownership stake does not give it control. While these companies contribute to the earnings of Nestlé as a whole, they also are valued in the public markets separately and their discrete valuations may be very different from a pure Nestlé valuation. To determine the value that the market is placing solely on Nestlé operations, the analyst first removes the value of the Alcon and L’Oreal holdings from the Nestlé market value, as shown in Exhibit 17-28.
EXHIBIT 17.28 Nestlé Market Value without Alcon and L’Oreal as of 31 December 2007
| (currency in millions, except share prices) | |
| L’Oreal Value: | |
| 12/31/2007 share price | €97.98 |
| Shares held by Nestlé (millions) | 178.381 |
| L’Oreal holding value | €17,478 |
| 12/31 euro:CHF rate | 1.657 |
| L’Oreal holding value in Swiss francs | CHF 28,961 |
| Alcon Value: | |
| 12/31/2007 share price | $140.78 |
| Shares held by Nestlé (millions) | 230.250 |
| Alcon holding value | $32,415 |
| 12/31 USD:CHF rate | 1.126 |
| Alcon holding value in Swiss francs | CHF 36,499 |
| Nestlé Market Value, with and without holdings | |
| Nestlé 12/31/2007 share price | CHF 497.77 |
| Shares outstanding (millions) | 393.073 |
| Nestlé market capitalization | CHF 195,661 |
| Value of L’Oreal holding | (28,961) |
| Value of Alcon holding | (36,499) |
| Implied value of Nestlé operations | CHF 130,201 |
| Pro rata market value: | |
| L’Oreal | 14.8% |
| Alcon | 18.7% |
| Nestlé | 66.5% |
| 100.0% | |
The value of the L’Oreal and Alcon holdings is approximately one-third of the value of Nestlé’s market capitalization. The analyst now wants to remove their earnings from the earnings of the combined entity (Exhibit 17-29) so as to make price/earnings comparison for Nestlé earnings alone. For L’Oreal, this is simple: L’Oreal and Nestlé both report on an IFRS basis and Nestlé discloses in its annual report that L’Oreal has contributed CHF 1,302 to the current year earnings.
It is a more complicated, and less precise, exercise to remove the Alcon earnings from the consolidated whole. Alcon financial statements are filed in the United States and are prepared on a U.S. GAAP basis. Although Alcon is responsible for providing Nestlé with information on an IFRS basis, there is no publicly available reconciliation showing differences in reported earnings. The analyst can only estimate the amount of Alcon net earnings embedded in Nestlé’s earnings on an IFRS basis. In reading the 2007 Management Review of Nestlé, he noted a mention of Alcon’s sales and EBIT for 2007: CHF 6,700 and 2,300, respectively. Referencing the 2007 consolidated statement of earnings found in the U.S. 20-F filing, he retrieves the other post-EBIT items and converts them into Swiss franc amounts using the average rate for 2007, found in the Nestlé 2007 financial statements. Those amounts are then combined with the EBIT; the resulting pretax figure is taxed at the Nestlé effective rate.
EXHIBIT 17-29 Calculation of Nestlé Earnings without Alcon and L’Oreal as of 12/31/2007
| From Alcon 20-F, restated into CHF at average 2007 CHF/USD exchange rate of 1.196 | ||
| (all currency in millions) | In U.S.$ | In CHF |
| Calculation of Alcon estimated IFRS earnings: | ||
| EBIT | 2,300.0 | |
| Gain from foreign currency, net | $11.2 | 13.4 |
| Interest income | 69.3 | 82.9 |
| Interest expense | (50.0) | (59.8) |
| Other, net | 15.4 | 18.4 |
| Total after-EBIT items | 54.9 | |
| Earnings before income taxes | 2,354.9 | |
| Income taxes at 25.3% (Nestlé’s effective tax rate) | 595.8 | |
| Estimated Alcon contribution to net income | 1,759.1 | |
| Minority interest percentage: (1−77.4%) | 22.6% | |
| Portion allocable to minority interest | 397.6 | |
| Portion allocable to Nestlé group shareholders | 1,361.5 | |
| Calculation of non-Alcon minority interest: | ||
| Reported profit attributable to minority interests | 733.0 | |
| Less: Alcon-related portion | (397.6) | |
| Non-Alcon minority interest | 335.4 | |
| Calculation of Nestlé stand-alone earnings: | ||
| Nestlé consolidated earnings | 11,382.0 | |
| Less: L’Oreal earnings | (1,302.0) | |
| Less: Estimated Alcon contribution to net income | (1,759.1) | |
| Nestlé stand-alone earnings | 8,320.9 | |
| Non-Alcon minority interest | (335.4) | |
| Nestlé stand-alone earnings to shareholders | 7,985.5 | |
The estimate is crude, because it implicitly assumes the four non-EBIT item amounts, pulled from the U.S. financial statements, would be the same under IFRS. The analyst does note, however, that the revenues on an IFRS basis were nearly the same amount as on a U.S. basis, when converted into Swiss francs at the average 2007 exchange rate. The Management Review mentioned that Alcon had 2007 revenues of CHF 6,700 million; converted into U.S. dollars at an average rate of 1.196, the dollar equivalent revenues are $5,602 million compared to the $5,599 million presented in the Alcon 20-F. Apparently, no significant difference exists between the revenues on an IFRS basis or U.S. GAAP basis. Applying the same exercise to the IFRS-based EBIT of CHF 2,300 million mentioned in the Management Review, the U.S. dollar equivalent is $1,923 million, compared to the 20-F amount of $1,892 million. The analyst excludes the U.S. GAAP charge for in-process R&D from the 20-F EBIT amount; in-process R&D is capitalized under IFRS. The difference in the EBIT figures is minor, only about 2 percent, giving the analyst some comfort that the two bases of accounting produce much the same results for a large part of the reported Alcon earnings.
After isolating the different earnings sources, the analyst prepares the table shown in Exhibit 17-30, which compares the different market values and price/earnings ratios.
EXHIBIT 17-30 Comparison of Decomposed Nestlé Earnings and Price/Earnings Ratios
At the time of the analysis (early 2008), Nestlé’s common stock traded at a price/earnings multiple of 18.4 based on its year-end stock price and trailing earnings: a discount of 17 percent to the price/earnings multiple of 22.2 for the S&P 500 at year-end 2007. Yet once earnings and available market value of the non-Nestlé holdings are taken out of the price/earnings valuation, the shares of the “Nestlé-only” company are selling on an even more discounted basis: at 16.3 times earnings, the discount to the overall market’s price/earnings multiple was a steeper 27 percent. The analyst believes the discount is inappropriate for a company with the demonstrated cash flow and low financial leverage of Nestlé; it also seems severe in terms of the company’s returns on equity. The analyst concludes that Nestlé shares may be undervalued relative to the market.
At this time, the analyst believes that he has processed and analyzed the data sufficiently to pull together his findings and make his report to the portfolio manager.
2.4. Phase 5: Develop and Communicate Conclusions and Recommendations (for Example, with an Analysis Report)
As a result of the analyses performed, the analyst has gathered sufficient evidence regarding many of the operational and financial characteristics of Nestlé and believes he is able to address the concerns initially expressed by the portfolio manager. Summary points he will cover in his report are divided into two classes: support for an investment in Nestlé shares, and causes for concern.
Support for an investment in Nestlé shares:
- Nestlé’s earnings growth and returns have come from its own operations, acquisitions, and investments in associates. Nestlé has the financial stability to fund growth in its existing operations and carry out its growth-by-acquisition strategy. The company’s current liquidity and cash flows are more than adequate for future operating and investment purposes. The company has low leverage and the capital structure is capable of supporting future operations and strategic plans.
- The company’s margins and ROE have been consistently positive and generally have exhibited an upward trend. The disaggregation of the effects of income from associates on margins and ROE indicates that the investment in associates has improved ROE and margins but not been the primary driver of ROE or margins. Nestlé’s performance appears sustainable.
- The operating cash flows have consistently exceeded the operating earnings. The ratio of operating cash to operating income has been fairly consistent, approximately 1.20, and gives confidence in the quality of the earnings. Measures comparing cash flows to reinvestment, debt, and debt-servicing capacity indicate strength in financial capacity.
- Nestlé has been increasing its size by acquisitions, evidenced by the growth of goodwill in its asset mix, and its cash return on assets has been increasing over the past three years. The current cash return on total assets is the highest in the five-year span. The acquisitions appear to be generating the required cash to justify the acquisitions.
- Decomposing the earnings into Nestlé-only, L’Oreal, and Alcon and considering the respective P/Es, it appears that the implied Nestlé-only portion is undervalued. The implied Nestlé-only portion has a far lower P/E than Alcon, L’Oreal, or the market. This should be considered an opportunity, given Nestlé’s demonstrated cash-flows and low financial leverage.
Causes for concern:
- The increases in balance-sheet-based and cash-flow-accrual ratios raise the possible issue of earnings management. However, this concern was alleviated by the comparison of operating cash flows with various measures, as noted previously.
- The company has some unusual priorities in the allocation of capital expenditures. The low-margined Waters business seems to be taking in an inordinate amount of the company’s capital expenditures. This will be an area of constant monitoring if the company makes an investment in Nestlé common stock.
- The research department’s monitoring cost, in terms of time and effort, for an investment in Nestlé common stock may require an analyst to follow two additional companies. While Nestlé is viewed by the market as just one company, the presence of Alcon and L’Oreal are important separable components that reflect considerably on the aggregate Nestlé performance. If an investment in Nestlé stock requires an analyst to follow two additional companies, there is less analytical capacity available for other investments to be evaluated or to be monitored on a continuing basis.
The analyst concludes that Nestlé represents a good investment opportunity and recommends it as such.
2.5. Phase 6: Follow-Up
Because of the discounted value of Nestlé shares and the financial strength and stability of the company, the portfolio manager decides to commit the pension fund to a core investment holding of Nestlé common stock. The portfolio manager is somewhat troubled with the resource allocation within the company, and wants to continually reevaluate the holding. Unproductive capital spending may be a trigger for eliminating the holding. The analyst is charged with updating his findings in the initial research report at each reporting period, with a particular emphasis on the company’s progress and continued investment in the Waters segment; the quality measures expressed by the accruals tests; and the cash flow support of earnings, with particular regard to returns on assets.
3. CASE STUDY 2: OFF-BALANCE SHEET LEVERAGE FROM OPERATING LEASES
The quantitative analyst for a large equity mutual fund has become concerned that the fund’s research analysts may not be looking for off-balance sheet financing as much as they should. While the fund’s investment philosophy has always been rooted in understanding the fundamentals of an investee company, the accounting scandals of the early 2000s and the more recent credit crisis in the United States has convinced the quantitative analyst the fund should be focusing more efforts on determining the unseen financial leverage that companies may be employing. Due to the nature of the fund’s investments in service industries, there has been little concern with unseen financial leverage.
The fund’s investment philosophy has always led them to invest in service industries, with little operating leverage or inventory risk, and to avoid industries with high financial and operating leverage, such as the airline and retail industries. The companies in the latter industries are capital-intensive and typically have highly leveraged balance sheets, and also employ off-balance sheet leverage in the form of operating leases. Investors in those industries, as a result, are inclined to look for off-balance sheet financing. However, because the fund invests in service industries, off-balance sheet financing is assumed to be a nonissue. The quantitative analyst wonders if this is in fact true.
3.1. Phase 1: Define a Purpose for the Analysis
As a result of this concern, the quantitative analyst decides to look for companies in the fund’s holdings where off-balance sheet financing may be an issue. He decides to focus on identifying companies with potentially unrecorded capital leases. The objective is not to come up with a point estimate of unrecorded leases or other sources of off-balance sheet financing, but rather to discover any companies in the fund’s portfolio that might have hidden leverage and, if in fact such leverage exists, to analyze the impact of the leverage.
3.2. Phase 2: Collect Input Data
To identify companies with potentially unrecorded leases, the quantitative analyst filters the fund’s holdings using a financial database. He compares the ratio of 7.4 times the current rent (operating lease) expense to total assets with a threshold percentage of 5 percent. 7.4 is the present value factor on a 10-year constant payment discounted at 6 percent; multiplying 7.4 times the rental expense generates an estimate of the incremental assets and debt under a 10-year capital lease discounted at 6 percent. While there is no way of knowing the actual terms of all the leases held by companies in the fund’s holdings, he assumes a 10-year lease is representative of current-lease terms.
The ratio of the estimated incremental assets and liabilities to total assets is compared to 5 percent. The quantitative analyst is only concerned with major understatements of assets and liabilities due to off-balance sheet treatment of operating leases and selects a 5 percent understatement threshold for further investigation of portfolio companies. If the ratio of “hidden” assets to total assets exceeds 5 percent for any of the companies in the fund’s holdings, that company’s information will be subjected to further analysis to see if in fact there are significant assets and liabilities that could be justifiably capitalized on the balance sheet.
3.3. Phase 3: Process Data and Phase 4: Analyze/Interpret the Processed Data
The screening process, shown in Exhibit 17-31, identifies a company that surprises the quantitative analyst: French advertising company Publicis Groupe (Euronext Paris: PUB).
EXHIBIT 17.31 Publicis Groupe: Operating Lease Expense Capitalized at 7.4 Times
| 2007 lease expense | €189.0 |
| Lease multiplier | 7.40 |
| Estimated incremental assets and debt | €1,398.6 |
| 2007 total assets | €12,244.0 |
| Estimated incremental assets to total reported assets | 11% |
The quantitative analyst is puzzled: Not only does the company lack heavy machinery or retail outlets to finance invisibly through operating leases, but even for a service company it is highly people-intensive. According to the Publicis Groupe annual report, there were 43,808 employees at the end of 2007; it has large office space needs to accommodate those employees. Publicis Groupe does business in virtually every country in the world and owns few offices, primarily leasing.
At 11 percent of total reported assets, the situation demands closer investigation by the analyst responsible for covering Publicis Groupe (the PG analyst). The PG analyst consults the 2007 annual report and finds that Publicis Groupe has significant long-term lease obligations through 2012, with another €455 million beyond that. He assumes that the post-2012 lease payments will be the same amount as in 2012, extinguishing the entire amount of the €455 million by 2016. From a scan of the company’s debt schedule, he sees that the company has issued a Eurobond due in 2012 with an effective interest rate of 4.3 percent. He then assumes that the lease borrowing rate that Publicis Groupe would bear on the operating leases if they were capitalized might approximate 4.5 percent. From the payment schedule, he constructs the estimated present value of discounted lease payments shown in Exhibit 17-32.
EXHIBIT 17.32 Publicis Groupe: Operating Lease Payments and Present Value
| (in millions) | ||
| Operating Lease Payments: | At 12/31/2007 | PMT PV |
| 2008 | €215 | €206 |
| 2009 | 186 | 170 |
| 2010 | 160 | 140 |
| 2011 | 141 | 118 |
| 2012 | 136 | 109 |
| 2013 | 136 | 104 |
| 2014 | 136 | 100 |
| 2015 | 136 | 96 |
| 2016 | 47 | 32 |
| €1,293 | €1,075 |
With the refined estimate of incremental asset basis and debt, the PG analyst revises balance sheet amounts and ratios with the new information on a pro forma basis, as shown in Exhibit 17-33.
EXHIBIT 17-33 Publicis Groupe: 2007 Leverage Ratios after Capitalizing Operating Leases
| As Reported | Pro Forma | |
| Financial leverage: | ||
| Total assets | €12,244 | |
| Total assets including estimated incremental asset based on capitalizing operating leases | €13,319 | |
| Total equity | €2,225 | €2,225 |
| Financial leverage | 5.50 | 5.99 |
| Debt to equity: | ||
| Estimated incremental liability based on capitalizing operating leases | — | €1,075 |
| Long-term financial debt | 1,293 | 1,293 |
| Total long-term financial debt | €1,293 | €2,368 |
| Long-term financial debt to equity: | 58.1% | 106.4% |
| Debt to long-term capital: | ||
| Long-term financial debt | €1,293 | €2,368 |
| Total equity | 2,225 | 2,225 |
| Long-term capital (L-T financial debt+equity) | €3,518 | €4,593 |
| Long-term financial debt to long-term capital | 36.8% | 51.6% |
Regardless of the leverage measure under scrutiny, Publicis Groupe becomes significantly more leveraged in the capitalization of the operating lease pro forma scenario than under the present operating lease reporting. In Exhibit 17-34, the analyst examines the impact on interest coverage if the operating leases are capitalized.
EXHIBIT 17-34 Publicis Groupe: 2007 Interest Coverage Ratio without and with Capitalizing Operating Leases
| As Reported | Pro Forma | |
| Earnings before interest and taxes | €746 | €746 |
| Average rent expense (2007 and 2006) | 191 | |
| Estimated depreciation expense on newly recognized assets: (€1,075.3M/9 years, the estimated lease term) | (119) | |
| Revised EBIT | €818 | |
| Average interest rate on debt | 4.5% | |
| Interest expense as reported | €73.0 | €73.0 |
| Assumed interest expense on leases (4.5% × 1075.3) | 48.4 | |
| Adjusted interest expense | €121.4 | |
| Interest coverage | 10.2 | 6.7 |
While Publicis Groupe still has ample interest coverage, the ratio presents a far different picture of financial strength than the as-reported figures. The PG analyst consults the mutual fund’s internal strategist who is forecasting an economic slowdown. The PG analyst concludes that this will reduce advertising spending, which will adversely affect Publicis Groupe.
3.4. Phase 5: Develop and Communicate Conclusions and Recommendations (for Example, with an Analysis Report)
The financial strength of the company, as evidenced by the debt and interest coverage ratios, does not appear as great when the operating leases are capitalized. Further, the PG analyst is concerned with the possible market response to a change in accounting for operating leases. In the most recent update of their Memorandum of Understanding for achieving accounting standard convergence, completed 11 September 2008, the FASB and the IASB agreed to develop a new lease standard by 2011. One likely reform is that all leases, including those currently defined as operating leases, might be required to be capitalized.
If Publicis Groupe was required to capitalize its lease obligations, then the balance sheet of Publicis Groupe would show far less available capacity for adding debt than currently. The ratios would deteriorate as shown by the pro forma information. While it is possible that bankers, bond investors, and shareholders make such adjustments in their lending decisions and in valuing the equity, the PG analyst is not convinced of the market’s efficiency and is concerned with a decline in value when the hidden leverage is shown on the balance sheet. Given the significant hidden leverage within Publicis Groupe and a negative macroeconomic outlook, the PG analyst recommends that the fund decrease its holding in Publicis Groupe.
3.5. Phase 6: Follow-Up
The quantitative analyst and PG analyst will continue to observe the value of Publicis Groupe to get feedback on the decision. Accounting pronouncements and changes will be monitored for potential impact on financial statements. They are both watching for and ready to assess the impact of a change in the accounting treatment of operating leases, should it occur, on the value of companies with significant hidden leverage.
4. CASE STUDY 3: ANTICIPATING EFFECTS OF CHANGES IN ACCOUNTING STANDARDS
The quantitative analyst of the large equity mutual fund, consistent with his mandate to monitor accounting pronouncements and changes, decides to look further at the technical plans on the websites of the International Accounting Standards Board and the Financial Accounting Standards Board.6 In looking at the websites, he becomes aware of some very near-term efforts at the FASB in the United States to change the accounting for securitizations.
Currently under Statement 140, a company can remove financial assets from its balance sheet by placing them into a qualified special purpose entity, which then issues securities representing interests in those assets. If carried out in accordance with Statement 140 accounting, this transaction results in the recognition of a sale of the assets and their elimination from the balance sheet. The qualified special purpose entity, and the securities issued by it, does not appear on the seller’s balance sheet. The combination of asset removal and nonrecognition of liabilities may have a powerfully beneficial effect on financial leverage presented in the balance sheet.
The FASB has considered eliminating the concept of a “qualified” special purpose entity from the securitization accounting contained in Statement 140, and requiring consideration of such vehicles under the accounting requirements of FASB Interpretation 46, Revised (FIN 46R). The revised accounting standards would make a sale treatment of financial instruments—such as mortgage loans, accounts receivable, or credit card receivables—through a securitization much less likely. Companies could still securitize financial assets, but they would not be as easily removed from the balance sheet as under Statement 140. Liabilities issued in connection with the securitizations would also be likely to be shown on the company’s balance sheet.
If the FASB’s plans come to pass, then the United States accounting for securitizations would be closer to the accounting contained in International Accounting Standard 39, Financial Instruments: Recognition and Measurement. If the proposed accounting changes are to be applied to existing securitization transactions, it will probably cause companies to reconsolidate assets onto their balance sheets, along with associated liabilities, that had previously been accounted for as being sold. That could cause drastic changes in the leverage of companies that had been securitizing financial assets.
Knowing that the mutual fund has holdings in several financial institutions that frequently securitize assets, the quantitative analyst contacted the financial analyst responsible for the financial institutions and advised him to look into the potential changes.
4.1. Phase 1: Define a Purpose for the Analysis
The financial analyst’s objective is to identify financial institutions with securitizations that might be susceptible to the potential new accounting treatment, to analyze the effect this would have on reported leverage, and to consider the consequences of the reported leverage.
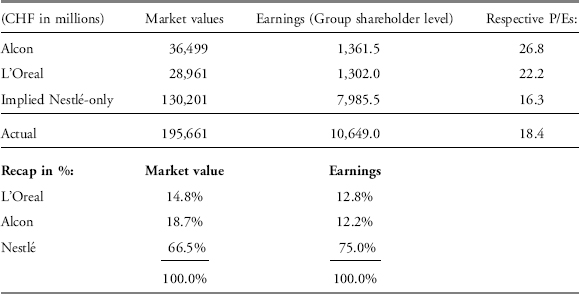
The financial analyst realized that the mutual fund’s large holding in Discover Financial Services (NYSE: DFS) could be at risk from the possible accounting changes. She knows that the SEC requires companies to disclose the anticipated effects of new accounting pronouncements in the Management’s Discussion and Analysis (MD&A) section of the 10-K filing. However, this disclosure does not occur until after a standard had been issued, and occurs with varying degrees of diligence by companies affected by a particular accounting pronouncement. Rather than waiting for the FASB to issue the pronouncement, and perhaps finding adequate disclosure of the effects of it in the 2008 10-K issued in early 2009, she decides to use existing disclosures to estimate the impact of the FASB’s intended changes in securitization accounting. She considers it far more important to estimate the direction of changes in balance sheet leverage now, rather than wait for an exact amount.
4.2. Phase 2: Collect Input Data
She obtains the current 2008 10-Q filings and the 2007 10-K filing for Discover Financial Services (Discover Financial), and notices that the MD&A section and the segment information footnote presents certain financial data on a “managed basis.” On this basis, the information is presented as if Discover Financial’s sale treatment of credit card receivables had never occurred; instead the financial data is shown as if the securitization had been treated as a secured borrowing, with the assets remaining on the balance sheet and also including the securitization liabilities on the balance sheet.
4.3. Phase 3: Process Data and Phase 4: Analyze/Interpret the Processed Data
Using the balance sheets and the “managed basis” data related to securitization adjustments, she revises the reported balance sheet as of year-end 30 November 2007 to a managed basis as shown in Exhibit 17-35.
EXHIBIT 17-35 Discover Financial Services: Removing Effects of “Sale” Treatment Securitizations
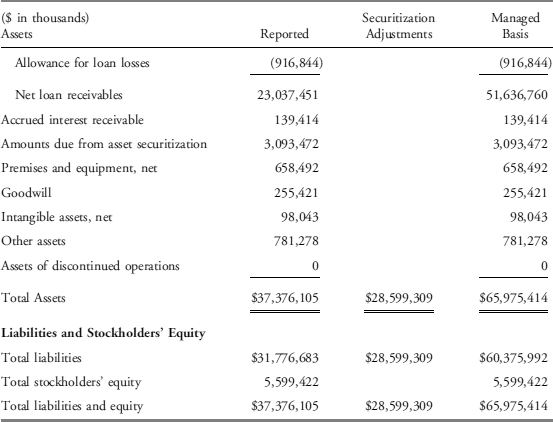
The managed basis information indicates that loan receivables and total assets have increased by $28.6 billion; the analyst assumes that the increase relates solely to the credit card loan portfolio. No additional information is provided that describes how the short-term and long-term liabilities would be affected by the inclusion of the securities resulting from the application of the managed basis. Therefore, the analyst adjusts for the impact under the heading of “total liabilities,” implicitly assuming that the liabilities recognized would be the same as the assets recognized.
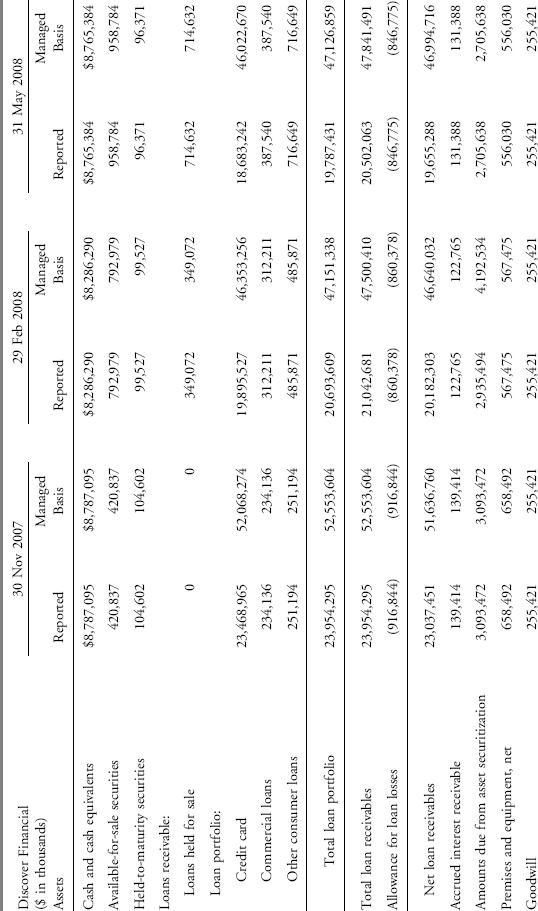
The adjustments have a significant impact on the balance sheet. Total assets increase 77 percent; total liabilities increase 90 percent. She then applies the same adjustment to the balance sheets as of 29 February 2008 and 31 May 2008 using information from the respective MD&A sections of the filings, and produces the schedule shown in Exhibit 17-36. The presentation shows 30 November 2007 on the left and 31 May 2008 on the right.
On an as-reported basis, the company appears to have become less leveraged over the past six months. Financial leverage (total assets divided by total equity) was 6.67 at 30 November 2007 and decreased to 5.85 by 31 May 2008. Discover Financial’s application of Statement 140 treated its securitizations of receivables as if they were asset sales instead of secured borrowings. This has the effect of decreasing overall leverage. When calculating the financial leverage ratio on a pro forma managed basis—as if the securitized receivables were still the assets of the company—Discover Financial shows higher leverage but similar improvement over the same period. On a managed basis, the financial leverage was 11.78 at 30 November 2007 and decreased to 10.53 by 31 May 2008. The Statement 140 sale treatment understated leverage by 43 percent (11/30/07), 43 percent (2/29/08), and 44 percent (5/31/08) in the three respective periods.
EXHIBIT 17-36 Discover Financial Services: Revised Balance Sheets and Leverage Ratios
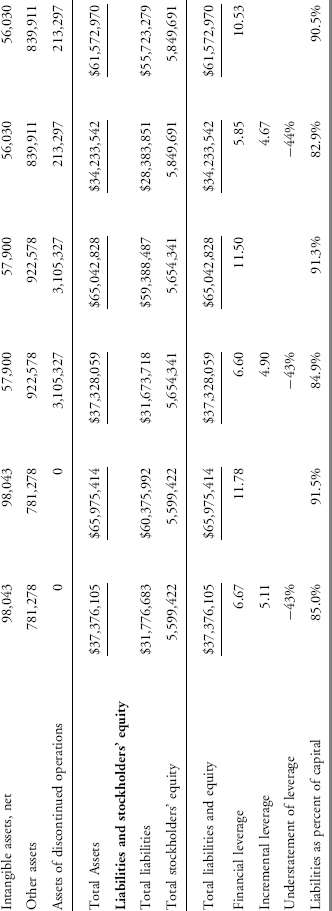
Another measure of financial leverage, liabilities as a percentage of total assets, shows the as-reported liabilities would be 82.9 percent of total capital at 31 May 2008. That proportion is 90.5 percent in a calculation based on managed basis figures. While financial leverage on either basis (as-reported or managed) shows a lessening of leverage over the six-month period, that decline is less on a managed basis. Further, the absolute level of leverage would be significantly increased in a standard change like the one contemplated by the FASB.
The financial analyst then looks to the MD&A for information on the effects the managed basis would have on the income statement. While net interest income, provision for loan losses, and other income would change, the net income would be unaffected. It appears that the balance sheet impacts are those of concern.
4.4. Phase 5: Develop and Communicate Conclusions and Recommendations (for Example, with an Analysis Report)
The balance sheet effects concern the financial analyst on several levels. First, she is concerned that the current accounting treatment for securitizations masks the company’s true leverage. Second, she is concerned that expected changes by standard setters will force Discover Financial to present a balance sheet that is more highly leveraged than investors have come to expect. That may raise concerns among other market participants about the company’s financial standing, possibly weakening the company’s valuation. Third, she is concerned that the company may try to offset the effects of the anticipated accounting change by raising equity, which would dilute the company’s ownership and also possibly weaken the company’s valuation.
She believes it is highly probable that the FASB will act on the project to change Statement 140 accounting and that it can only portend negative effects for the company’s holding in Discover Financial Services. She recommends that the company reduce its holdings in Discover Financial Services.
4.5. Phase 6: Follow-Up
Specifically, the quantitative analyst and financial analyst will continue to observe the value of Discover Financial Services to get feedback on the decision. Generally, accounting pronouncements and changes will be monitored for potential impact on financial statements and on company valuation.
The three case studies demonstrate the use of financial analysis in decision making. Each case is set in a different type of industry: manufacturing, service, and financial service. The different focus, purpose, and context for each analysis result in different techniques and tools being applied to the analysis. However, each case demonstrates the use of a common financial statement analysis framework. In each case, an economic decision is arrived at; this is consistent with the primary reason for performing financial analysis: to facilitate an economic decision.
The following information relates to Questions 1 through 8.
Sergei Leenid, CFA, is a long-only fixed income portfolio manager for the Parliament Funds. He has developed a quantitative model, based on financial statement data, to predict changes in the credit ratings assigned to corporate bond issues. Before applying the model, Leenid first performs a screening process to exclude bonds that fail to meet certain criteria relative to their credit rating. Existing holdings that fail to pass the initial screen are individually reviewed for potential disposition. Bonds that pass the screening process are evaluated using the quantitative model to identify potential rating changes.
Leenid is concerned that a pending change in accounting rules could affect the results of the initial screening process. One current screen excludes bonds when the financial leverage ratio (equity multiplier) exceeds a given level and/or the interest coverage ratio falls below a given level for a given bond rating. For example, any “A”-rated bond of a company with a financial leverage ratio exceeding 2.0 or an interest coverage ratio below 6.0 would fail the initial screening. The failing bonds are eliminated from further analysis using the quantitative model.
The new accounting rule would require substantially all leases to be capitalized on a company’s balance sheets. To test whether the change in accounting rules will affect the output of the screening process, Leenid collects a random sample of “A”-rated bonds issued by companies in the retail industry, which he believes will be among the industries most affected by the change.
Two of the companies, Silk Road Stores and Colorful Concepts, recently issued bonds with similar terms and interest rates. Leenid decides to thoroughly analyze the potential effects of the change on these two companies and begins by gathering information from their most recent annual financial statements (Exhibit A).
EXHIBIT A Selected Financial Data for Silk Road Stores and Colorful Concepts
| Silk Road | Colorful Concepts | |
| Revenue | 3,945 | 7,049 |
| EBIT | 318 | 865 |
| Interest expense | 21 | 35 |
| Income taxes | 121 | 302 |
| Net income | 176 | 528 |
| Average total assets | 2,075 | 3,844 |
| Average total equity | 1,156 | 2,562 |
| Lease expense | 213 | 406 |
After examining lease disclosures, Leenid estimates the average lease term for each company at eight years with a fairly consistent lease expense over that time. He believes the leases should be capitalized using 6.5%, the rate at which both companies recently issued bonds.
While examining the balance sheet for Colorful Concepts, Leenid also discovers that the company has a 204 ending asset balance (188 beginning) for investments in associates, primarily due to its 20% interest in the equity of Exotic Imports. Exotic Imports is a specialty retail chain and in the most recent year reported 1,230 in sales, 105 in net income, and had average total assets of 620.
1. If the accounting rules were to change, Silk Road’s assets would increase by approximately:
A. 1,297.
B. 1,576.
C. 1,704.
2. If the accounting rules were to change, Silk Road’s interest coverage ratio would be closest to:
A. 3.03.
B. 3.50.
C. 5.04.
3. If the accounting rules were to change, Silk Road’s financial leverage ratio would be closest to:
A. 1.37.
B. 1.79.
C. 2.92.
4. Will the change in accounting rules impact the result of the initial screening process for Colorful Concepts?
A. It passes the screens now, but will not pass if the accounting rules change.
B. It passes the screens now and will continue to pass if the accounting rules change.
C. It fails the screens now and will continue to fail if the accounting rules change.
5. Based on Leenid’s analysis of the results of the initial screening, relative to Colorful Concepts the bond rating of Silk Road should be:
A. lower.
B. higher.
C. the same.
6. Ignoring the potential impact of any accounting change and excluding the investment in associates, the net profit margin for Colorful Concepts would be closest to:
A. 6.0%.
B. 7.2%.
C. 7.5%.
7. Ignoring the impact of any accounting change, the asset turnover ratio for Colorful Concepts excluding the investments in associates would:
A. stay the same.
B. increase by 0.10.
C. decrease by 0.10.
8. Excluding the investments in associates would result in the interest coverage ratio for Colorful Concepts being:
A. lower.
B. higher.
C. the same.
The following information relates to Questions 9 through 15.
Quentin Abay, CFA, is an analyst for a private equity firm interested in purchasing Bickchip Enterprises, a conglomerate. His first task is to determine the trends in ROE and the main drivers of the trends using DuPont analysis. To do so he gathers the data in Exhibit B.
EXHIBIT B Selected Financial Data for Bickchip Enterprises
After conducting the DuPont analysis, Abay believes that his firm could increase the ROE without operational changes. Further, Abay thinks that ROE could improve if the company divested segments that were generating the lowest returns on capital employed (total assets less noninterest-bearing liabilities). Segment EBIT margins in 2009 were 11% for Automation Equipment, 5% for Power and Industrial, and 8% for Medical Equipment. Other relevant segment information is presented in Exhibit C.
EXHIBIT C Segment Data for Bickchip Enterprises (€ thousands)
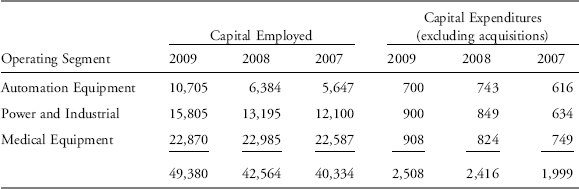
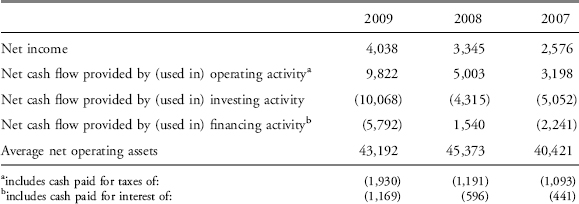
Abay is also concerned with earnings quality, so he intends to calculate Bickchip’s cash-flow-based accruals ratio and the ratio of operating cash flow before interest and taxes to operating income. To do so, he prepares the information in Exhibit D.
EXHIBIT D Earnings Quality Data for Bickchip Enterprises (€ in thousands)
9. Over the three-year period presented in Exhibit B, Bickchip’s return on equity is best described as:
A. stable.
B. trending lower.
C. trending higher.
10. Based on the DuPont analysis, Abay’s belief regarding ROE is most likely based on:
A. leverage.
B. profit margins.
C. asset turnover.
11. Based on Abay’s criteria, the business segment best suited for divestiture is:
A. medical equipment.
B. power and industrial.
C. automation equipment.
12. Bickchip’s cash-flow-based accruals ratio in 2009 is closest to:
A. 9.9%.
B. 13.4%.
C. 23.3%.
13. The cash-flow-based accruals ratios from 2007 to 2009:
A. indicate improving earnings quality.
B. indicate deteriorating earnings quality.
C. indicate no change in earnings quality.
14. The ratio of operating cash flow before interest and taxes to operating income for Bickchip for 2009 is closest to:
A. 1.6.
B. 1.9.
C. 2.1.
15. Based on the ratios for operating cash flow before interest and taxes to operating income, Abay should conclude that:
A. Bickchip’s earnings are backed by cash flow.
B. Bickchip’s earnings are not backed by cash flow.
C. Abay can draw no conclusion due to the changes in the ratios over time.
The following information relates to Questions 16 through 21.
Michael Wetstone is an equity analyst covering the software industry for a public pension fund. Prior to comparing the financial results of Software Services Inc. and PDQ GmbH, Wetstone discovers the need to make adjustments to their respective financial statements. The issues preventing comparability, using the financial statements as reported, are the sale of receivables and the impact of minority interests.
Software Services sold $267.5 million of finance receivables to a special purpose entity. PDQ does not securitize finance receivables. An abbreviated balance sheet for Software Services is presented in Exhibit E.
EXHIBIT E Abbreviated Balance Sheet for Software Services ($ 000)
| Year Ending: | 31 December 2009 |
| Total Current Assets | $1,412,900 |
| Total Assets | $3,610,600 |
| Total Current Liabilities | $1,276,300 |
| Total Liabilities | $2,634,100 |
| Total Equity | $976,500 |
A significant portion of PDQ’s net income is explained by its 20% minority interest in Astana Systems. Wetstone collects certain data (Exhibit F) related to both PDQ and Astana in order to estimate the financials of PDQ on a stand-alone basis.
EXHIBIT F Selected Financial Data Related to PDQ and Astana Systems
| PDQ (€ in 000) | Astana ($ in 000) | |
| Earnings before tax (2009) | €41,730 | $15,300 |
| Income taxes (2009) | 13,562 | 5,355 |
| Net income (2009) | 28,168 | 9,945 |
| Market capitalization (recent) | 563,355 | 298,350 |
| Average $/€ exchange rate in 2009 | 1.55 | |
| Current $/€ exchange rate | 1.62 |
16. Compared to holding securitized finance receivables on the balance sheet, treating them as sold had the effect of reducing Software Services’ reported financial leverage by:
A. 6.8%.
B. 7.4%.
C. 9.2%.
17. Had the securitized finance receivables been held on the balance sheet, Software Services’ ratio of liabilities to total capital would have been closest to:
A. 73.0%.
B. 74.8%.
C. 80.4%.
18. How much of PDQ’s value can be explained by its equity stake in Astana?
A. 6.5%.
B. 10.6%.
C. 20.0%.
19. On a “solo” basis, PDQ’s P/E ratio is closest to:
A. 19.6.
B. 21.0.
C. 24.5.
20. The adjusted financial statements were created during which phase of the financial analysis process?
A. Data collection.
B. Data processing.
C. Data interpretation.
21. The estimate of PDQ’s solo value is crude because of:
A. the potential differences in accounting standards used by PDQ and Astana.
B. the differing risk characteristics of PDQ and Astana.
C. differences in liquidity and market efficiency where PDQ and Astana trade.
1A reminder to the reader: This case study is an example, and starting financial statement analysis with a DuPont analysis is not a mandate. Alternatively, another analyst might have preferred starting with a time-series common-size income statement. This analyst might be more interested in the trends of various income and expense categories, as a financial statement analysis starting point, than in the sources of returns on shareholder equity. It depends on the perspective of the individual analyst.
2Associates are companies in which Nestlé has the power to exercise a significant influence but does not exercise control. They are accounted for by the equity method.
3 Expenses include depreciation and amortization of 3,211; 3,061; and 2,728 for 2007, 2006, and 2005 respectively.
4 Includes impairments of 482, 134, and 608 for 2007, 2006, and 2005 respectively.
5For 2007, the daily cash expenditure = [45,037+9,104+36,512+1,875 − 3,211+(590 − 482)+(1492 − 576)]/365 = 247.5. The defensive interval ratio is 24,917/247.5 = 100.7.
6www.iasb.org/Current+Projects/IASB+Projects/IASB+Work+Plan.htm and www.fasb.org/project/, respectively.