CHAPTER 6
UNDERSTANDING CASH FLOW STATEMENTS
After completing this chapter, you will be able to do the following:
- Compare cash flows from operating, investing, and financing activities and classify cash flow items as relating to one of those three categories given a description of the items.
- Describe how noncash investing and financing activities are reported.
- Contrast cash flow statements prepared under International Financial Reporting Standards (IFRS) and U.S. generally accepted accounting principles (U.S. GAAP).
- Distinguish between the direct and indirect methods of presenting cash from operating activities and describe the arguments in favor of each method.
- Describe how the cash flow statement is linked to the income statement and the balance sheet.
- Describe the steps in the preparation of direct and indirect cash flow statements, including how cash flows can be computed using income statement and balance sheet data.
- Convert cash flows from the indirect to direct method.
- Analyze and interpret both reported and common-size cash flow statements.
- Calculate and interpret free cash flow to the firm, free cash flow to equity, and performance and coverage cash flow ratios.
The cash flow statement provides information about a company’s cash receipts and cash payments during an accounting period. The cash-based information provided by the cash flow statement contrasts with the accrual-based information from the income statement. For example, the income statement reflects revenues when earned rather than when cash is collected; in contrast, the cash flow statement reflects cash receipts when collected as opposed to when the revenue was earned. A reconciliation between reported income and cash flows from operating activities provides useful information about when, whether, and how a company is able to generate cash from its operating activities. Although income is an important measure of the results of a company’s activities, cash flow is also essential. As an extreme illustration, a hypothetical company that makes all sales on account, without regard to whether it will ever collect its accounts receivable, would report healthy sales on its income statement and might well report significant income; however, with zero cash inflow, the company would not survive. The cash flow statement also provides a reconciliation of the beginning and ending cash on the balance sheet.
In addition to information about cash generated (or, alternatively, cash used) in operating activities, the cash flow statement provides information about cash provided (or used) in a company’s investing and financing activities. This information allows the analyst to answer such questions as
- Does the company generate enough cash from its operations to pay for its new investments, or is the company relying on new debt issuance to finance them?
- Does the company pay its dividends to common stockholders using cash generated from operations, from selling assets, or from issuing debt?
Answers to these questions are important because, in theory, generating cash from operations can continue indefinitely, but generating cash from selling assets, for example, is possible only as long as there are assets to sell. Similarly, generating cash from debt financing is possible only as long as lenders are willing to lend, and the lending decision depends on expectations that the company will ultimately have adequate cash to repay its obligations. In summary, information about the sources and uses of cash helps creditors, investors, and other statement users evaluate the company’s liquidity, solvency, and financial flexibility.
This chapter explains how cash flow activities are reflected in a company’s cash flow statement. The chapter is organized as follows. Section 2 describes the components and format of the cash flow statement, including the classification of cash flows under International Financial Reporting Standards (IFRS) and U.S. generally accepted accounting principles (GAAP) and the direct and indirect formats for presenting the cash flow statement. Section 3 discusses the linkages of the cash flow statement with the income statement and balance sheet and the steps in the preparation of the cash flow statement. Section 4 demonstrates the analysis of cash flow statements, including the conversion of an indirect cash flow statement to the direct method and how to use common-size cash flow analysis, free cash flow measures, and cash flow ratios used in security analysis. Section 5 summarizes the chapter. Finally, practice problems in the CFA Institute multiple-choice format are provided.
2. COMPONENTS AND FORMAT OF THE CASH FLOW STATEMENT
The analyst needs to be able to extract and interpret information on cash flows from financial statements. The basic components and allowable formats of the cash flow statement are well established.
- The cash flow statement has subsections relating specific items to the operating, investing, and financing activities of the company.
- Two presentation formats for the operating section are allowable: direct and indirect.
The following discussion presents these topics in greater detail.
2.1. Classification of Cash Flows and Noncash Activities
All companies engage in operating, investing, and financing activities. These activities are the classifications used in the cash flow statement under both IFRS and U.S. GAAP and are described as follows:1
- Operating activities include the company’s day-to-day activities that create revenues, such as selling inventory and providing services, and other activities not classified as investing or financing. Cash inflows result from cash sales and from collection of accounts receivable. Examples include cash receipts from the provision of services and royalties, commissions, and other revenue. To generate revenue, companies undertake such activities as manufacturing inventory, purchasing inventory from suppliers, and paying employees. Cash outflows result from cash payments for inventory, salaries, taxes, and other operating-related expenses and from paying accounts payable. Additionally, operating activities include cash receipts and payments related to dealing or trading securities (as opposed to buying or selling securities as investments, as discussed later).
- Investing activities include purchasing and selling long-term assets and other investments. These long-term assets and other investments include property, plant, and equipment; intangible assets; other long-term assets; and both long-term and short-term investments in the equity and debt (bonds and loans) issued by other companies. For this purpose, investments in equity and debt securities exclude (a) any securities considered cash equivalents (very short-term, highly liquid securities) and (b) securities held for dealing or trading purposes, the purchase and sale of which are considered operating activities even for companies where this is not a primary business activity. Cash inflows in the investing category include cash receipts from the sale of nontrading securities; property, plant, and equipment; intangibles; and other long-term assets. Cash outflows include cash payments for the purchase of these assets.
- Financing activities include obtaining or repaying capital, such as equity and long-term debt. The two primary sources of capital are shareholders and creditors. Cash inflows in this category include cash receipts from issuing stock (common or preferred) or bonds and cash receipts from borrowing. Cash outflows include cash payments to repurchase stock (e.g., treasury stock) and to repay bonds and other borrowings. Note that indirect borrowing using accounts payable is not considered a financing activity—such borrowing is classified as an operating activity.
EXAMPLE 6-1 Net Cash Flow from Investing Activities
A company recorded the following in Year 1:
| Proceeds from issuance of long-term debt | €300,000 |
| Purchase of equipment | €200,000 |
| Loss on sale of equipment | € 70,000 |
| Proceeds from sale of equipment | €120,000 |
| Equity in earnings of affiliate | € 10,000 |
On the Year 1 statement of cash flows, the company would report net cash flow from investing activities closest to
A. (€150,000).
B. (€80,000).
C. €200,000.
Solution: B is correct. The only two items that would affect the investing section are the purchase of equipment and the proceeds from sale of equipment: (€200,000)+€120,000=(€80,000). The loss on sale of equipment and the equity in earnings of affiliate affect net income but are not cash flows. The issuance of debt is a financing cash flow.
IFRS provide companies with choices in reporting some items of cash flow, particularly interest and dividends. IFRS explain that although for a financial institution interest paid and received would normally be classified as operating activities, for other entities, alternative classifications may be appropriate. For this reason, under IFRS, interest received may be classified either as an operating activity or as an investing activity. Under IFRS, interest paid may be classified as either an operating activity or a financing activity. Furthermore, under IFRS, dividends received may be classified as either an operating activity or an investing activity and dividends paid may be classified as either an operating activity or a financing activity. Companies must use a consistent classification from year to year and disclose separately the amounts of interest and dividends received and paid and where the amounts are reported.
Under U.S. GAAP, discretion is not permitted in classifying interest and dividends. Interest received and interest paid are reported as operating activities for all companies.2 Under U.S. GAAP, dividends received are always reported as operating activities and dividends paid are always reported as financing activities.
EXAMPLE 6-2 Operating vs. Financing Cash Flows
On 31 December 2009, a company issued a £30,000 180-day note at 8 percent and used the cash received to pay for inventory and issued £110,000 long-term debt at 11 percent annually and used the cash received to pay for new equipment. Which of the following most accurately reflects the combined effect of both transactions on the company’s cash flows for the year ended 31 December 2009 under IFRS? Cash flows from
A. Operations are unchanged.
B. Financing increase £110,000.
C. Operations decrease £30,000.
Solution: C is correct. The payment for inventory would decrease cash flows from operations. The issuance of debt (both short-term and long-term) is part of financing activities and would increase cash flows from financing activities by £140,000. The purchase of equipment is an investing activity. Note that the treatment under U.S. GAAP would be the same for these transactions.
Companies may also engage in noncash investing and financing transactions. A noncash transaction is any transaction that does not involve an inflow or outflow of cash. For example, if a company exchanges one nonmonetary asset for another nonmonetary asset, no cash is involved. Similarly, no cash is involved when a company issues common stock either for dividends or in connection with conversion of a convertible bond or convertible preferred stock. Because no cash is involved in noncash transactions (by definition), these transactions are not incorporated in the cash flow statement. However, because such transactions may affect a company’s capital or asset structures, any significant noncash transaction is required to be disclosed, either in a separate note or a supplementary schedule to the cash flow statement.
2.2. A Summary of Differences between IFRS and U.S. GAAP
As highlighted in the previous section, there are some differences in cash flow statements prepared under IFRS and U.S. GAAP that the analyst should be aware of when comparing the cash flow statements of companies prepared in accordance with different sets of standards. The key differences are summarized in Exhibit 6-1. Most significantly, IFRS allow more flexibility in the reporting of such items as interest paid or received and dividends paid or received and in how income tax expense is classified.
U.S. GAAP classify interest and dividends received from investments as operating activities, whereas IFRS allow companies to classify those items as either operating or investing cash flows. Likewise, U.S. GAAP classify interest expense as an operating activity, even though the principal amount of the debt issued is classified as a financing activity. IFRS allow companies to classify interest expense as either an operating activity or a financing activity. U.S. GAAP classify dividends paid to stockholders as a financing activity, whereas IFRS allow companies to classify dividends paid as either an operating activity or a financing activity.
U.S. GAAP classify all income tax expenses as an operating activity. IFRS also classify income tax expense as an operating activity, unless the tax expense can be specifically identified with an investing or financing activity (e.g., the tax effect of the sale of a discontinued operation could be classified under investing activities).
EXHIBIT 6-1 Cash Flow Statements: Differences between IFRS and U.S. GAAP
| Topic | IFRS | U.S. GAAP |
Classification of Cash Flows:
|
Operating or investing Operating or financing Operating or investing Operating or financing |
Operating Operating Operating Financing |
|
Considered part of cash equivalents | Not considered part of cash and cash equivalents and classified as financing |
| Taxes paid | Generally operating, but a portion can be allocated to investing or financing if it can be specifically identified with these categories | Operating |
| Format of statement | Direct or indirect; direct is encouraged | Direct or indirect; direct is encouraged. A reconciliation of net income to cash flow from operating activities must be provided regardless of method used. |
Sources: IAS 7; FASB ASC Topic 230; and “IFRS and U.S. GAAP: Similarities and Differences,” Pricewaterhouse Coopers (September 2009), available at www.pwc.com.
Under either set of standards, companies currently have a choice of formats for presenting cash flow statements, as discussed in the next section.
2.3. Direct and Indirect Methods for Reporting Cash Flow from Operating Activities
There are two acceptable formats for reporting cash flow from operating activities (also known as cash flow from operations or operating cash flow), defined as the net amount of cash provided from operating activities: the direct and the indirect methods. The amount of operating cash flow is identical under both methods; only the presentation format of the operating cash flow section differs. The presentation format of the cash flows from investing and financing is exactly the same, regardless of which method is used to present operating cash flows.
The direct method shows the specific cash inflows and outflows that result in reported cash flow from operating activities. It shows each cash inflow and outflow related to a company’s cash receipts and disbursements. In other words, the direct method eliminates any impact of accruals and shows only cash receipts and cash payments. The primary argument in favor of the direct method is that it provides information on the specific sources of operating cash receipts and payments. This is in contrast to the indirect method, which shows only the net result of these receipts and payments. Just as information on the specific sources of revenues and expenses is more useful than knowing only the net result—net income—the analyst gets additional information from a direct-format cash flow statement. The additional information is useful in understanding historical performance and in predicting future operating cash flows.
The indirect method shows how cash flow from operations can be obtained from reported net income as the result of a series of adjustments. The indirect format begins with net income. To reconcile net income with operating cash flow, adjustments are made for noncash items, for nonoperating items, and for the net changes in operating accruals. The main argument for the indirect approach is that it shows the reasons for differences between net income and operating cash flows. (However, the differences between net income and operating cash flows are equally visible on an indirect-format cash flow statement and in the supplementary reconciliation required under U.S. GAAP if the company uses the direct method.) Another argument for the indirect method is that it mirrors a forecasting approach that begins by forecasting future income and then derives cash flows by adjusting for changes in balance sheet accounts that occur because of the timing differences between accrual and cash accounting.
IFRS and U.S. GAAP both encourage the use of the direct method but permit either method. U.S. GAAP encourage the use of the direct method but also require companies to present a reconciliation between net income and cash flow (which is equivalent to the indirect method).3 If the indirect method is chosen, no direct-format disclosures are required. The majority of companies, reporting under IFRS or U.S. GAAP, present using the indirect method for operating cash flows.
Many users of financial statements prefer the direct format, particularly analysts and commercial lenders, because of the importance of information about operating receipts and payments in assessing a company’s financing needs and capacity to repay existing obligations. Preparers argue that adjusting net income to operating cash flow, as in the indirect format, is easier and less costly than reporting gross operating cash receipts and payments, as in the direct format. With advances in accounting systems and technology, it is not clear that gathering the information required to use the direct method is difficult or costly. CFA Institute has advocated that standard setters require the use of the direct format for the main presentation of the cash flow statement, with indirect cash flows as supplementary disclosure.4
2.3.1. An Indirect-Format Cash Flow Statement Prepared under IFRS
Exhibit 6-2 presents the consolidated cash flow statement prepared under IFRS from Unilever Group’s 2009 annual report.5 The statement, covering the fiscal years ended 31 December 2009, 2008, and 2007, shows the use of the indirect method. Unilever is an Anglo-Dutch consumer products company with headquarters in the United Kingdom and the Netherlands.6
EXHIBIT 6-2 Unilever Group Consolidated Cash Flow Statement (€ millions)
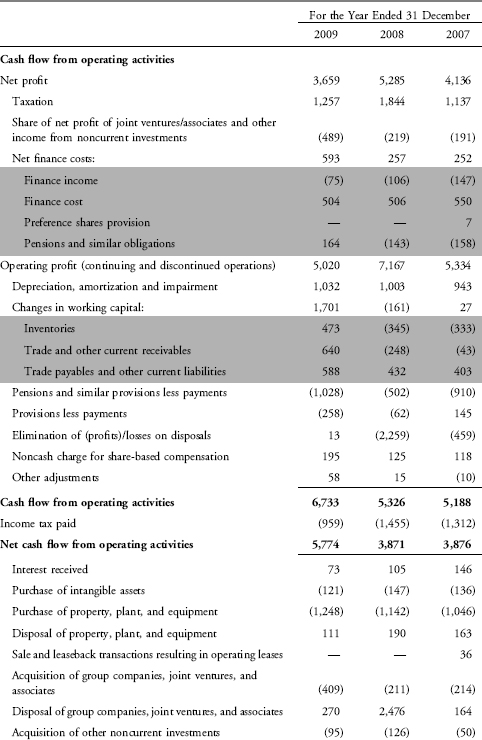
Beginning first at the bottom of the statement, we note that cash increased from €710 million at the beginning of 2007 to €2,397 million at the end of 2009, with the largest increase occurring in 2008. To understand the changes, we next examine the sections of the statement. In each year, the primary cash inflow derived from operating activities, as would be expected for a mature company in a relatively stable industry. In each year, the operating cash flow was more than the reported net profit, again, as would be expected from a mature company, with the largest differences primarily arising from the add-back of depreciation. Also, in each year, the operating cash flow was more than enough to cover the company’s capital expenditures. For example, in 2009, the company generated €5,774 million in net cash from operating activities and—as shown in the investing section—spent €1,137 million on property, plant, and equipment (€1,248 million, net of €111 million proceeds from disposals). Also, as shown in the investing section, the main reason for the large increase in cash in 2008 was the €2,476 million inflow from the disposal of group companies, joint ventures, and associates.
The financing section of the statement shows that each year the company returned about €2.1 billion to its common shareholders and around €500 million to its debt holders and preferred shareholders via interest and dividends. The company also repurchased about €1.5 billion in common stock in both 2007 and 2008. In 2009, the company repaid debt (repayments of €4,456 million exceeded additional financing liabilities of €2,913 million).
Having examined each section of the statement, we return to the operating activities section of Unilever’s cash flow statement, which presents a reconciliation of net profit to net cash flow from operating activities (i.e., uses the indirect method). The following discussion of certain adjustments to reconcile net profit to operating cash flows explains some of the main reconciliation adjustments and refers to the amounts in 2009. The first adjustment adds back the €1,257 million income tax expense (labeled “Taxation”) that had been recognized as an expense in the computation of net profit. A €959 million deduction for the (cash) income taxes paid is then shown separately, as the last item in the operating activities section, consistent with the IFRS requirement that cash flows arising from income taxes be separately disclosed. The classification of taxes on income paid should be indicated. The classification is in operating activities unless the taxes can be specifically identified with financing or investing activities.
The next adjustment “removes” from the operating cash flow section the €489 million representing Unilever’s share of joint ventures’ income that had been included in the computation of net profit. A €201 million inflow of (cash) dividends received from those joint ventures is then shown in the investing activities section. Similarly, a €593 million adjustment removes the net finance costs from the operating activities section. Unilever then reports its €73 million (cash) interest received in the investing activities section and its €517 million (cash) interest paid (and preference dividends paid) in the financing activities section. The next adjustment in the operating section of this indirect-method statement adds back €1,032 million depreciation, amortization, and impairment, all of which are expenses that had been deducted in the computation of net income but which did not involve any outflow of cash in the period. The €1,701 million adjustment for changes in working capital is necessary because these changes result from applying accrual accounting and thus do not necessarily correspond to the actual cash movement. These adjustments are described in greater detail in a later section.
In summary, some observations from an analysis of Unilever’s cash flow statement include
- Total cash increased from €710 million at the beginning of 2007 to €2,397 million at the end of 2009, with the largest increase occurring in 2008.
- In each year, the operating cash flow was more than the reported net profit, as would generally be expected from a mature company.
- In each year, the operating cash flow was more than enough to cover the company’s capital expenditures.
- The company returned cash to its equity investors through dividends in each year and through share buybacks in 2007 and 2008.
2.3.2. A Direct-Format Cash Flow Statement Prepared under IFRS
In the direct format of the cash flow statement, the cash received from customers, as well as other operating items, is clearly shown.
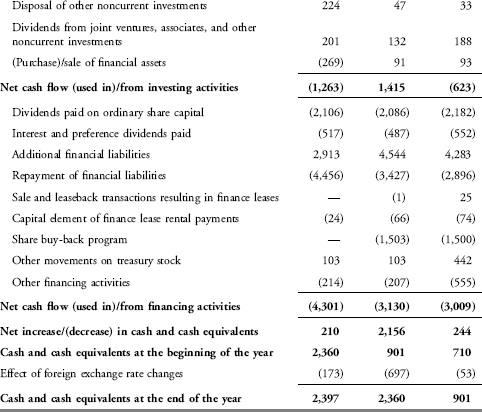
Exhibit 6-3 presents a direct-method format cash flow statement prepared under IFRS for Telefónica Group (SM: TEF), a diversified telecommunications company based in Madrid.7
EXHIBIT 6-3 Telefónica Group Consolidated Statement of Cash Flows (€ millions)
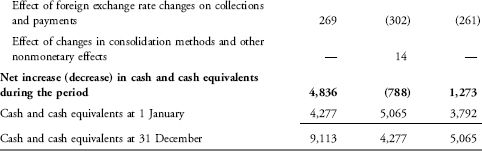
As shown at the bottom of the statement, cash and cash equivalents increased from €3,792 million at the beginning of 2007 to €9,113 million at the end of 2009. The largest increase in cash occurred in 2009, with 2008 showing a decrease. Cash from operations was the primary source of cash, consistent with the profile of a mature company in a relatively stable industry. Each year, the company generated significantly more cash from operations than it required for its capital expenditures. For example, in 2009, the company generated €16.1 billion cash from operations and spent—as shown in the investing section—only €7.4 billion on property, plant, and equipment (€7,593 million, net of €242 million from disposals). Another notable item from the investing section is the company’s limited acquisition activity in 2009 compared with 2008 and 2007. In both 2007 and 2008, the company made over €2 billion of acquisitions, and in 2007, the company also received €5.5 billion from disposals. Instead of using cash for acquisition activity in 2009 when net acquisitions used only €14 million (€48 million acquisitions, net of €34 million from disposals), the company invested €1,411 million in financial investments excluded from cash and cash equivalents (i.e., long-term financial investments).
As shown in the financing section, in 2009, the net cash inflow from debt issuance was €3,504 million (€8,617 million proceeds from debentures and bonds plus €2,330 million proceeds from loans, borrowings, and promissory notes, net of repayments and cancellations totaling €7,443 million).
In summary, some observations from an analysis of Telefónica’s cash flow statement include
- Total cash and cash equivalents increased over the three-year period, with 2009 showing the biggest increase.
- Cash from operating activities was large enough in each year to cover the company’s capital expenditures.
- The amount paid for property, plant, and equipment and intangible assets was the largest investing expenditure each year and did not significantly vary from year to year.
- The company had a significant amount of acquisition and divestiture activity in 2007 and 2008 but not in 2009.
- The company paid an increasing amount of dividends over the three-year period.
An analyst can also make some comparisons between the income statement (not shown here) and the statement of cash flows. For example, contrast the change in revenues from the income statement to the change in cash received from customers. An increase in revenues coupled with a decrease in cash received from customers, for example, could signal collection problems. As shown in Exhibit 6-3, cash received from customers in 2009 decreased 2.46 percent compared with 2008, from €69,060 million to €67,358 million. The company reported revenues on the income statement of €56,731 million and €57,946 million for 2009 and 2008, respectively. Thus, the decrease in cash received from customers was slightly greater than the 2.10 percent decrease in total revenue and would not in itself indicate any collection issue.
2.3.3. Illustrations of Cash Flow Statements Prepared under U.S. GAAP
Previously, we presented cash flow statements prepared under IFRS. In this section, we illustrate cash flow statements prepared under U.S. GAAP. This section presents the cash flow statements of two companies, Tech Data Corporation (NASDAQ: TECD) and Walmart (NYSE: WMT). Tech Data reports its operating activities using the direct method, whereas Walmart reports its operating activities using the more common indirect method.
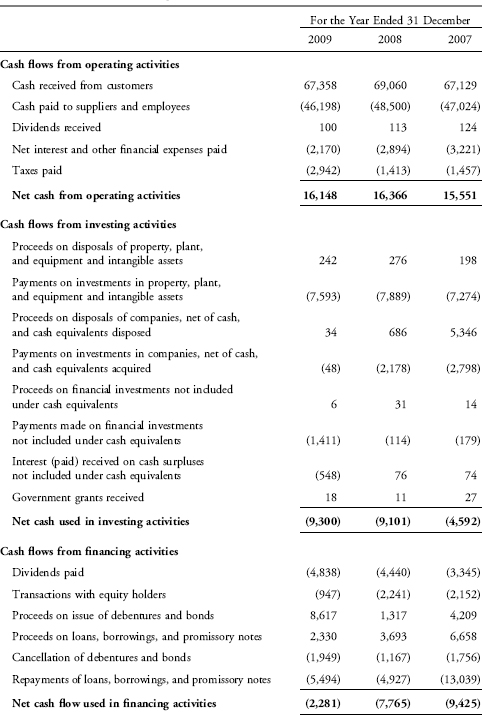
Tech Data Corporation is a leading distributor of information technology products. Exhibit 6-4 presents comparative cash flow statements from the company’s annual report for the fiscal years ended 31 January 2008 through 2010.
EXHIBIT 6-4 Tech Data Corporation and Subsidiaries Consolidated Cash Flow Statements Years Ended 31 January (in thousands)
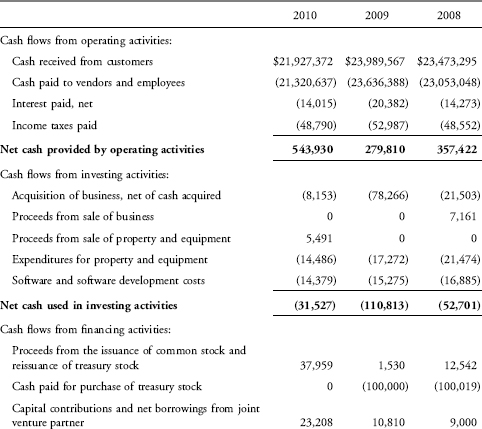
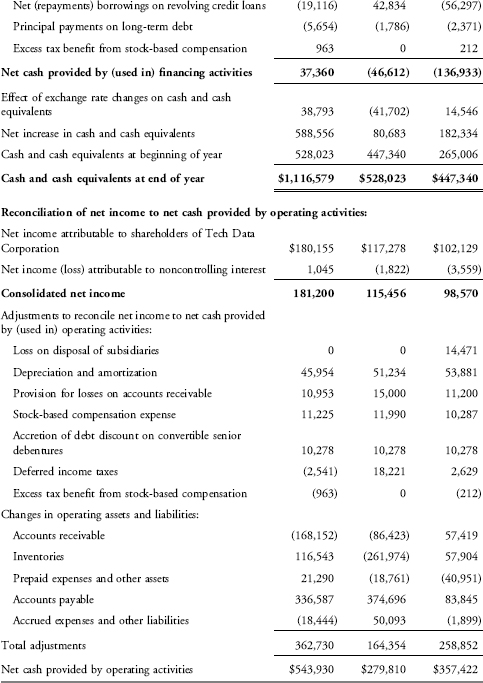
Tech Data Corporation prepares its cash flow statements under the direct method. The company’s cash increased from $265 million at the beginning of 2008 to $1.1 billion at the end of January 2010, with the biggest increase occurring in the most recent year. The 2010 increase was driven by changes across all three sections of the statement. In the cash flows from operating activities section of Tech Data’s cash flow statements, the company identifies the amount of cash it received from customers, $21.9 billion for 2010, and the amount of cash that it paid to suppliers and employees, $21.3 billion for 2010. Cash receipts decreased from $24.0 billion in the prior year, but cash paid decreased by even more such that cash provided by operating activities increased in 2010 compared with 2009. Net cash provided by operating activities of $543.9 million was adequate to cover the company’s investing activities, primarily purchases of property and equipment ($14.5 million) and software development ($14.4 million). Overall, investing activities in 2010 used far less cash than in 2009, primarily because of reduced amounts of cash used for acquisition of businesses. In 2010, the company issued $38 million of common stock and received $23.2 million in contributions and borrowings from its joint venture partner, providing net cash from financing activities of $37.4 million after its debt repayments.
Whenever the direct method is used, U.S. GAAP require a disclosure note and a schedule that reconciles net income with the net cash flow from operating activities. Tech Data shows this reconciliation at the bottom of its consolidated statements of cash flows. The disclosure note and reconciliation schedule are exactly the information that would have been presented in the body of the cash flow statement if the company had elected to use the indirect method rather than the direct method. For 2009, the reconciliation highlights an increase in the company’s accounts receivable, a decrease in inventory, and a significant increase in payables.
In summary, some observations from an analysis of Tech Data’s cash flow statement include
- The company’s cash increased by $852 (= 1,117 − 265 or=589+81+182) million over the three years ending in January 2010, with the biggest increase occurring in the most recent year.
- The company’s operating cash was adequate to cover the company’s investments in all three years.
- In 2009, the company issued stock and received financing from its joint venture partner, which provided the company with a stronger cash cushion.
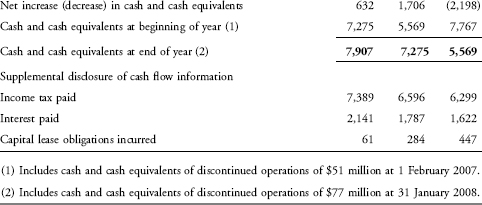
Walmart is a global retailer that conducts business under the names of Walmart and Sam’s Club. Exhibit 6-5 presents the comparative cash flow statements from the company’s annual report for the fiscal years ended 31 January 2010, 2009, and 2008.
EXHIBIT 6-5 Walmart Cash Flow Statements Fiscal Years Ended 31 January ($ millions)
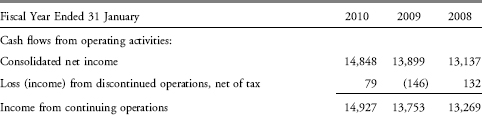
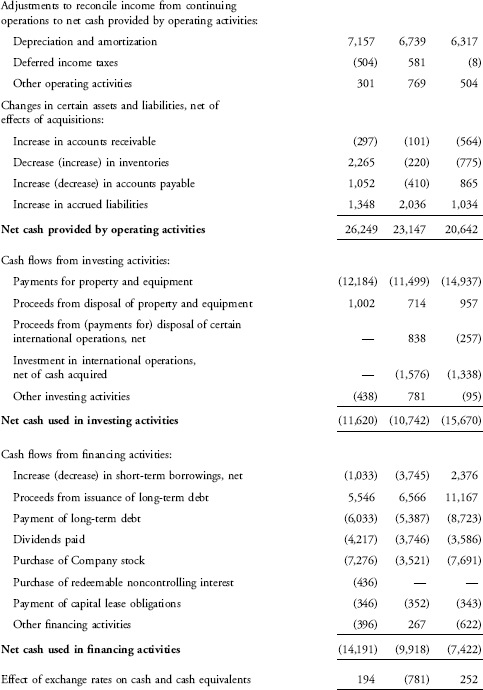
Walmart’s cash flow statement indicates the following:
- Cash and cash equivalents changed only slightly over the three years, from $7.8 billion at the beginning of fiscal 2008 to $7.9 billion at the end of fiscal 2010, but year-to-year cash flows varied significantly.
- Operating cash flow increased steadily from $20.6 billion in fiscal 2008 to $26.2 billion in 2010 and was significantly greater than the company’s expenditures on property and equipment in every year.
- In 2009 and 2010, the company used cash to repay borrowing, to pay dividends, and to repurchase its common stock.
Walmart prepares its cash flow statements under the indirect method. In the cash flows from operating activities section of Walmart’s cash flow statement, the company reconciles its net income of $14.8 billion to net cash provided by operating activities of $26.2 billion. Whenever the indirect method is used, U.S. GAAP mandate disclosure of how much cash was paid for interest and income taxes. Note that these are line items in cash flow statements using the direct method, so disclosure does not have to be mandated. Walmart discloses the amount of cash paid for income tax ($7.4 billion), interest ($2.1 billion), and capital lease obligations ($61 million) at the bottom of its cash flow statements.
3. THE CASH FLOW STATEMENT: LINKAGES AND PREPARATION
The indirect format of the cash flow statement demonstrates that changes in balance sheet accounts are an important factor in determining cash flows. The next section addresses the linkages between the cash flow statement and other financial statements.
3.1. Linkages of the Cash Flow Statement with the Income Statement and Balance Sheet
Recall the accounting equation that summarizes the balance sheet:
![]()
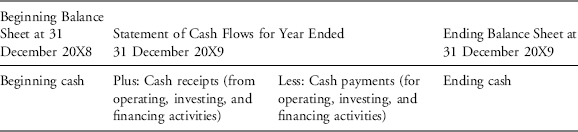
Cash is an asset. The statement of cash flows ultimately shows the change in cash during an accounting period. The beginning and ending balances of cash are shown on the company’s balance sheets for the previous and current years, and the bottom of the cash flow statement reconciles beginning cash with ending cash. The relationship, stated in general terms, is as shown following.
In the case of cash held in foreign currencies, there would also be an impact from changes in exchange rates. For example, Walmart’s cash flow statement for 2010, presented in Exhibit 6-5, shows cash flows from operating, investing, and financing activities that total $438 million during the year ($26,249 − $11,620 − $14,191). Combined with the $194 million net effect of exchange rates on cash and cash equivalents, the net increase in cash and cash equivalents was $632 million, the amount by which end-of-year cash and cash equivalents ($7,907) exceeds beginning-of-year cash and cash equivalents ($7,275).
The body of Walmart’s cash flow statement shows why the change in cash occurred; in other words, it shows the company’s operating, investing, and financing activities (as well as the impact of foreign currency translation). The beginning and ending balance sheet values of cash and cash equivalents are linked through the cash flow statement.
The current assets and current liabilities sections of the balance sheet typically reflect a company’s operating decisions and activities. Because a company’s operating activities are reported on an accrual basis in the income statement, any differences between the accrual basis and the cash basis of accounting for an operating transaction result in an increase or decrease in some (usually) short-term asset or liability on the balance sheet. For example, if revenue reported using accrual accounting is higher than the cash actually collected, the result will typically be an increase in accounts receivable. If expenses reported using accrual accounting are lower than cash actually paid, the result will typically be a decrease in accounts payable or another accrued liability account.8 As an example of how items on the balance sheet are related to the income statement and/or cash flow statement through the change in the beginning and ending balances, consider accounts receivable:
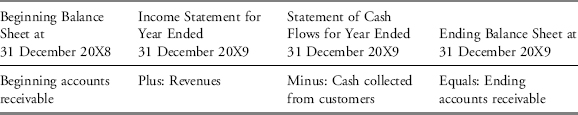
Knowing any three of these four items makes it easy to compute the fourth. For example, if you know beginning accounts receivable, revenues, and cash collected from customers, you can easily compute ending accounts receivable. Understanding the interrelationships between the balance sheet, income statement, and cash flow statement is useful in not only understanding the company’s financial health but also in detecting accounting irregularities. Recall the extreme illustration of a hypothetical company that makes sales on account without regard to future collections and thus reports healthy sales and significant income on its income statement yet lacks cash inflow. Such a pattern would occur if a company improperly recognized revenue.
A company’s investing activities typically relate to the long-term asset section of the balance sheet, and its financing activities typically relate to the equity and long-term debt sections of the balance sheet. The next section demonstrates the preparation of cash flow information based on income statement and balance sheet information.
3.2. Steps in Preparing the Cash Flow Statement
The preparation of the cash flow statement uses data from both the income statement and the comparative balance sheets.
As noted earlier, companies often only disclose indirect operating cash flow information, whereas analysts prefer direct-format information. Understanding how cash flow information is put together will enable you to take an indirect statement apart and reconfigure it in a more useful manner. The result is an approximation of a direct cash flow statement, which—while not perfectly accurate—can be helpful to an analyst. The following demonstration of how an approximation of a direct cash flow statement is prepared uses the income statement and the comparative balance sheets for Acme Corporation (a fictitious retail company) shown in Exhibits 6-6 and 6-7.
EXHIBIT 6-6 Acme Corporation Income Statement Year Ended 31 December 2009
| Revenue | $23,598 | |
| Cost of goods sold | 11,456 | |
| Gross profit | 12,142 | |
| Salary and wage expense | $4,123 | |
| Depreciation expense | 1,052 | |
| Other operating expenses | 3,577 | |
| Total operating expenses | 8,752 | |
| Operating profit | 3,390 | |
| Other revenues (expenses): | ||
| Gain on sale of equipment | 205 | |
| Interest expense | (246) | (41) |
| Income before tax | 3,349 | |
| Income tax expense | 1,139 | |
| Net income | $2,210 |
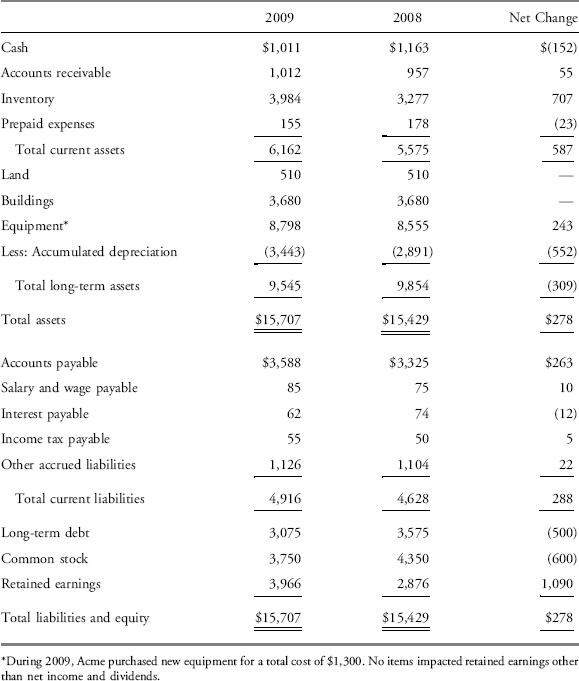
EXHIBIT 6-7 Acme Corporation Comparative Balance Sheets 31 December 2009 and 2008
The first step in preparing the cash flow statement is to determine the total cash flows from operating activities. The direct method of presenting cash from operating activities is illustrated in sections 3.2.1 through 3.2.4. Section 3.2.5 illustrates the indirect method of presenting cash flows from operating activities. Cash flows from investing activities and from financing activities are identical under either method.
3.2.1. Operating Activities: Direct Method
We first determine how much cash Acme received from its customers, followed by how much cash was paid to suppliers and to employees as well as how much cash was paid for other operating expenses, interest, and income taxes.
3.2.1.1. Cash Received from Customers
The income statement for Acme reported revenue of $23,598 for the year ended 31 December 2009. To determine the approximate cash receipts from its customers, it is necessary to adjust this revenue amount by the net change in accounts receivable for the year. If accounts receivable increase during the year, revenue on an accrual basis is higher than cash receipts from customers, and vice versa. For Acme Corporation, accounts receivable increased by $55, so cash received from customers was $23,543, as follows:
| Revenue | $23,598 |
| Less: Increase in accounts receivable | (55) |
| Cash received from customers | $23,543 |
Cash received from customers affects the accounts receivable account as follows:
| Beginning accounts receivable | $957 |
| Plus revenue | 23,598 |
| Minus cash collected from customers | (23,543) |
| Ending accounts receivable | $1,012 |
The accounts receivable account information can also be presented as follows:
| Beginning accounts receivable | $957 |
| Plus revenue | 23,598 |
| Minus ending accounts receivable | (1,012) |
| Cash collected from customers | $23,543 |
EXAMPLE 6-3 Computing Cash Received from Customers
Blue Bayou, a fictitious advertising company, reported revenues of $50 million, total expenses of $35 million, and net income of $15 million in the most recent year. If accounts receivable decreased by $12 million, how much cash did the company receive from customers?
A. $38 million
B. $50 million
C. $62 million
Solution: C is correct. Revenues of $50 million plus the decrease in accounts receivable of $12 million equals $62 million cash received from customers. The decrease in accounts receivable means that the company received more in cash than the amount of revenue it reported.
“Cash received from customers” is sometimes referred to as “cash collections from customers” or “cash collections.”
3.2.1.2. Cash Paid to Suppliers
For Acme, the cash paid to suppliers was $11,900, determined as follows:
| Cost of goods sold | $11,456 |
| Plus: Increase in inventory | 707 |
| Equals purchases from suppliers | $12,163 |
| Less: Increase in accounts payable | (263) |
| Cash paid to suppliers | $11,900 |
There are two pieces to this calculation: the amount of inventory purchased and the amount paid for it. To determine purchases from suppliers, cost of goods sold is adjusted for the change in inventory. If inventory increased during the year, then purchases during the year exceeded cost of goods sold, and vice versa. Acme reported cost of goods sold of $11,456 for the year ended 31 December 2009. For Acme Corporation, inventory increased by $707, so purchases from suppliers was $12,163. Purchases from suppliers affect the inventory account, as shown here:
| Beginning inventory | $3,277 |
| Plus purchases | 12,163 |
| Minus cost of goods sold | (11,456) |
| Ending inventory | $3,984 |
Acme purchased $12,163 of inventory from suppliers in 2009, but is this the amount of cash that Acme paid to its suppliers during the year? Not necessarily. Acme may not have yet paid for all of these purchases and may yet owe for some of the purchases made this year. In other words, Acme may have paid less cash to its suppliers than the amount of this year’s purchases, in which case Acme’s liability (accounts payable) will have increased by the difference. Alternatively, Acme may have paid even more to its suppliers than the amount of this year’s purchases, in which case Acme’s accounts payable will have decreased.
Therefore, once purchases have been determined, cash paid to suppliers can be calculated by adjusting purchases for the change in accounts payable. If the company made all purchases with cash, then accounts payable would not change and cash outflows would equal purchases. If accounts payable increased during the year, then purchases on an accrual basis would be higher than they would be on a cash basis, and vice versa. In this example, Acme made more purchases than it paid in cash, so the balance in accounts payable increased. For Acme, the cash paid to suppliers was $11,900, determined as follows:
| Purchases from suppliers | $12,163 |
| Less: Increase in accounts payable | (263) |
| Cash paid to suppliers | $11,900 |
The amount of cash paid to suppliers is reflected in the accounts payable account, as shown here:
| Beginning accounts payable | $3,325 |
| Plus purchases | 12,163 |
| Minus cash paid to suppliers | (11,900) |
| Ending accounts payable | $3,588 |
EXAMPLE 6-4 Computing Cash Paid to Suppliers
Orange Beverages Plc., a fictitious manufacturer of tropical drinks, reported cost of goods sold for the year of $100 million. Total assets increased by $55 million, but inventory declined by $6 million. Total liabilities increased by $45 million, but accounts payable decreased by $2 million. How much cash did the company pay to its suppliers during the year?
A. $96 million
B. $104 million
C. $108 million
Solution: A is correct. Cost of goods sold of $100 million less the decrease in inventory of $6 million equals purchases from suppliers of $94 million. The decrease in accounts payable of $2 million means that the company paid $96 million in cash ($94 million plus $2 million).
3.2.1.3. Cash Paid to Employees
To determine the cash paid to employees, it is necessary to adjust salary and wages expense by the net change in salary and wages payable for the year. If salary and wages payable increased during the year, then salary and wages expense on an accrual basis would be higher than the amount of cash paid for this expense, and vice versa. For Acme, salary and wages payable increased by $10, so cash paid for salary and wages was $4,113, as follows:
| Salary and wages expense | $4,123 |
| Less: Increase in salary and wages payable | (10) |
| Cash paid to employees | $4,113 |
The amount of cash paid to employees is reflected in the salary and wages payable account, as shown here:
| Beginning salary and wages payable | $75 |
| Plus salary and wages expense | 4,123 |
| Minus cash paid to employees | (4,113) |
| Ending salary and wages payable | $85 |
3.2.1.4. Cash Paid for Other Operating Expenses
To determine the cash paid for other operating expenses, it is necessary to adjust the other operating expenses amount on the income statement by the net changes in prepaid expenses and accrued expense liabilities for the year. If prepaid expenses increased during the year, other operating expenses on a cash basis would be higher than on an accrual basis, and vice versa. Likewise, if accrued expense liabilities increased during the year, other operating expenses on a cash basis would be lower than on an accrual basis, and vice versa. For Acme Corporation, the amount of cash paid for operating expenses in 2009 was $3,532, as follows:
| Other operating expenses | $3,577 |
| Less: Decrease in prepaid expenses | (23) |
| Less: Increase in other accrued liabilities | (22) |
| Cash paid for other operating expenses | $3,532 |
EXAMPLE 6-5 Computing Cash Paid for Other Operating Expenses
Black Ice, a fictitious sportswear manufacturer, reported other operating expenses of $30 million. Prepaid insurance expense increased by $4 million, and accrued utilities payable decreased by $7 million. Insurance and utilities are the only two components of other operating expenses. How much cash did the company pay in other operating expenses?
A. $19 million
B. $33 million
C. $41 million
Solution: C is correct. Other operating expenses of $30 million plus the increase in prepaid insurance expense of $4 million plus the decrease in accrued utilities payable of $7 million equals $41 million.
3.2.1.5. Cash Paid for Interest
The cash paid for interest is included in operating cash flows under U.S. GAAP and may be included in operating or financing cash flows under IFRS. To determine the cash paid for interest, it is necessary to adjust interest expense by the net change in interest payable for the year. If interest payable increases during the year, then interest expense on an accrual basis will be higher than the amount of cash paid for interest, and vice versa. For Acme Corporation, interest payable decreased by $12, and cash paid for interest was $258, as follows:
| Interest expense | $246 |
| Plus: Decrease in interest payable | 12 |
| Cash paid for interest | $258 |
Alternatively, cash paid for interest may also be determined by an analysis of the interest payable account, as shown here:
| Beginning interest payable | $74 |
| Plus interest expense | 246 |
| Minus cash paid for interest | (258) |
| Ending interest payable | $62 |
3.2.1.6. Cash Paid for Income Taxes
To determine the cash paid for income taxes, it is necessary to adjust the income tax expense amount on the income statement by the net changes in taxes receivable, taxes payable, and deferred income taxes for the year. If taxes receivable or deferred tax assets increase during the year, income taxes on a cash basis will be higher than on an accrual basis, and vice versa. Likewise, if taxes payable or deferred tax liabilities increase during the year, income tax expense on a cash basis will be lower than on an accrual basis, and vice versa. For Acme Corporation, the amount of cash paid for income taxes in 2009 was $1,134, as follows:
| Income tax expense | $1,139 |
| Less: Increase in income tax payable | (5) |
| Cash paid for income taxes | $1,134 |
3.2.2. Investing Activities
The second and third steps in preparing the cash flow statement are to determine the total cash flows from investing activities and from financing activities. The presentation of this information is identical, regardless of whether the direct or indirect method is used for operating cash flows.
Purchases and sales of equipment were the only investing activities undertaken by Acme in 2009, as evidenced by the fact that the amounts reported for land and buildings were unchanged during the year. An informational note in Exhibit 6-7 tells us that Acme purchased new equipment in 2009 for a total cost of $1,300. However, the amount of equipment shown on Acme’s balance sheet increased by only $243 (ending balance of $8,798 minus beginning balance of $8,555); therefore, Acme must have also sold or otherwise disposed of some equipment during the year. To determine the cash inflow from the sale of equipment, we analyze the equipment and accumulated depreciation accounts as well as the gain on the sale of equipment from Exhibits 6-6 and 6-7. Assuming that the entire accumulated depreciation is related to equipment, the cash received from sale of equipment is determined as follows.
The historical cost of the equipment sold was $1,057. This amount is determined as follows:
| Beginning balance equipment (from balance sheet) | $8,555 |
| Plus equipment purchased (from informational note) | 1,300 |
| Minus ending balance equipment (from balance sheet) | (8,798) |
| Equals historical cost of equipment sold | $1,057 |
The accumulated depreciation on the equipment sold was $500, determined as follows:
| Beginning balance accumulated depreciation (from balance sheet) | $2,891 |
| Plus depreciation expense (from income statement) | 1,052 |
| Minus ending balance accumulated depreciation (from balance sheet) | (3,443) |
| Equals accumulated depreciation on equipment sold | $500 |
The historical cost information, accumulated depreciation information, and information from the income statement about the gain on the sale of equipment can be used to determine the cash received from the sale.
| Historical cost of equipment sold (calculated earlier) | $1,057 |
| Less accumulated depreciation on equipment sold (calculated earlier) | (500) |
| Equals book value of equipment sold | $557 |
| Plus gain on sale of equipment (from the income statement) | 205 |
| Equals cash received from sale of equipment | $762 |
EXAMPLE 6-6 Computing Cash Received from the Sale of Equipment
Copper, Inc., a fictitious brewery and restaurant chain, reported a gain on the sale of equipment of $12 million. In addition, the company’s income statement shows depreciation expense of $8 million and the cash flow statement shows capital expenditure of $15 million, all of which was for the purchase of new equipment.
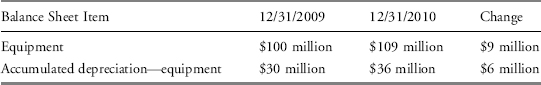
Using the above information from the comparative balance sheets, how much cash did the company receive from the equipment sale?
A. $12 million
B. $16 million
C. $18 million
Solution: B is correct. Selling price (cash inflow) minus book value equals gain or loss on sale; therefore, gain or loss on sale plus book value equals selling price (cash inflow). The amount of gain is given, $12 million. To calculate the book value of the equipment sold, find the historical cost of the equipment and the accumulated depreciation on the equipment.
- Beginning balance of equipment of $100 million plus equipment purchased of $15 million minus ending balance of equipment of $109 million equals historical cost of equipment sold, or $6 million.
- Beginning accumulated depreciation on equipment of $30 million plus depreciation expense for the year of $8 million minus ending balance of accumulated depreciation of $36 million equals accumulated depreciation on the equipment sold, or $2 million.
- Therefore, the book value of the equipment sold was $6 million minus $2 million, or $4 million.
- Because the gain on the sale of equipment was $12 million, the amount of cash received must have been $16 million.
3.2.3. Financing Activities
As with investing activities, the presentation of financing activities is identical, regardless of whether the direct or indirect method is used for operating cash flows.
3.2.3.1. Long-Term Debt and Common Stock
The change in long-term debt, based on the beginning 2009 (ending 2008) and ending 2009 balances in Exhibit 6-7, was a decrease of $500. Absent other information, this indicates that Acme retired $500 of long-term debt. Retiring long-term debt is a cash outflow relating to financing activities.
Similarly, the change in common stock during 2009 was a decrease of $600. Absent other information, this indicates that Acme repurchased $600 of its common stock. Repurchase of common stock is also a cash outflow related to financing activity.
3.2.3.2. Dividends
Recall the following relationship:
Beginning retained earnings + Net income − Dividends = Ending retained earnings
Based on this relationship, the amount of cash dividends paid in 2009 can be determined from an analysis of retained earnings, as follows:
| Beginning balance of retained earnings (from the balance sheet) | $2,876 |
| Plus net income (from the income statement) | 2,210 |
| Minus ending balance of retained earnings (from the balance sheet) | (3,966) |
| Equals dividends paid | $1,120 |
Note that dividends paid are presented in the statement of changes in equity.
3.2.4. Overall Statement of Cash Flows: Direct Method
Exhibit 6-8 summarizes the information about Acme’s operating, investing, and financing cash flows in the statement of cash flows. At the bottom of the statement, the total net change in cash is shown to be a decrease of $152 (from $1,163 to $1,011). This decrease can also be seen on the comparative balance sheet in Exhibit 6-7. The cash provided by operating activities of $2,606 was adequate to cover the net cash used in investing activities of $538; however, the company’s debt repayments, cash payments for dividends, and repurchase of common stock (i.e., its financing activities) of $2,220 resulted in an overall decrease in cash of $152.
EXHIBIT 6-8 Acme Corporation Cash Flow Statement (Direct Method) for Year Ended 31 December 2009
| Cash flow from operating activities: | |
| Cash received from customers | $23,543 |
| Cash paid to suppliers | (11,900) |
| Cash paid to employees | (4,113) |
| Cash paid for other operating expenses | (3,532) |
| Cash paid for interest | (258) |
| Cash paid for income tax | (1,134) |
| Net cash provided by operating activities | 2,606 |
| Cash flow from investing activities: | |
| Cash received from sale of equipment | 762 |
| Cash paid for purchase of equipment | (1,300) |
| Net cash used for investing activities | (538) |
| Cash flow from financing activities: | |
| Cash paid to retire long-term debt | (500) |
| Cash paid to retire common stock | (600) |
| Cash paid for dividends | (1,120) |
| Net cash used for financing activities | (2,220) |
| Net increase (decrease) in cash | (152) |
| Cash balance, 31 December 2008 | 1,163 |
| Cash balance, 31 December 2009 | $1,011 |
3.2.5. Overall Statement of Cash Flows: Indirect Method
Using the alternative approach to reporting cash from operating activities, the indirect method, we will present the same amount of cash provided by operating activities. Under this approach, we reconcile Acme’s net income of $2,210 to its operating cash flow of $2,606.
To perform this reconciliation, net income is adjusted for the following: (a) any nonoperating activities, (b) any noncash expenses, and (c) changes in operating working capital items.
The only nonoperating activity in Acme’s income statement, the sale of equipment, resulted in a gain of $205. This amount is removed from the operating cash flow section; the cash effects of the sale are shown in the investing section.
Acme’s only noncash expense was depreciation expense of $1,052. Under the indirect method, depreciation expense must be added back to net income because it was a noncash deduction in the calculation of net income.
Changes in working capital accounts include increases and decreases in the current operating asset and liability accounts. The changes in these accounts arise from applying accrual accounting; that is, recognizing revenues when they are earned and expenses when they are incurred instead of when the cash is received or paid. To make the working capital adjustments under the indirect method, any increase in a current operating asset account is subtracted from net income and a net decrease is added to net income. As described earlier, the increase in accounts receivable, for example, resulted from Acme recording income statement revenue higher than the amount of cash received from customers; therefore, to reconcile back to operating cash flow, that increase in accounts receivable must be deducted from net income. For current operating liabilities, a net increase is added to net income and a net decrease is subtracted from net income. As described earlier, the increase in wages payable, for example, resulted from Acme recording income statement expenses higher than the amount of cash paid to employees.
Exhibit 6-9 presents a tabulation of the most common types of adjustments that are made to net income when using the indirect method to determine net cash flow from operating activities.
EXHIBIT 6-9 Adjustments to Net Income Using the Indirect Method
| Additions |
|
| Subtractions |
|
Accordingly, for Acme Corporation, the $55 increase in accounts receivable and the $707 increase in inventory are subtracted from net income and the $23 decrease in prepaid expenses is added to net income. For Acme’s current liabilities, the increases in accounts payable, salary and wage payable, income tax payable, and other accrued liabilities ($263, $10, $5, and $22, respectively) are added to net income and the $12 decrease in interest payable is subtracted from net income. Exhibit 6-10 presents the cash flow statement for Acme Corporation under the indirect method by using the information that we have determined from our analysis of the income statement and the comparative balance sheets. Note that the investing and financing sections are identical to the statement of cash flows prepared using the direct method.
EXHIBIT 6-10 Acme Corporation Cash Flow Statement (Indirect Method) Year Ended 31 December 2009
| Cash flow from operating activities: | |
| Net income | $2,210 |
| Depreciation expense | 1,052 |
| Gain on sale of equipment | (205) |
| Increase in accounts receivable | (55) |
| Increase in inventory | (707) |
| Decrease in prepaid expenses | 23 |
| Increase in accounts payable | 263 |
| Increase in salary and wage payable | 10 |
| Decrease in interest payable | (12) |
| Increase in income tax payable | 5 |
| Increase in other accrued liabilities | 22 |
| Net cash provided by operating activities | 2,606 |
| Cash flow from investing activities: | |
| Cash received from sale of equipment | 762 |
| Cash paid for purchase of equipment | (1,300) |
| Net cash used for investing activities | (538) |
| Cash flow from financing activities: | |
| Cash paid to retire long-term debt | (500) |
| Cash paid to retire common stock | (600) |
| Cash paid for dividends | (1,120) |
| Net cash used for financing activities | (2,220) |
| Net decrease in cash | (152) |
| Cash balance, 31 December 2008 | 1,163 |
| Cash balance, 31 December 2009 | $1,011 |
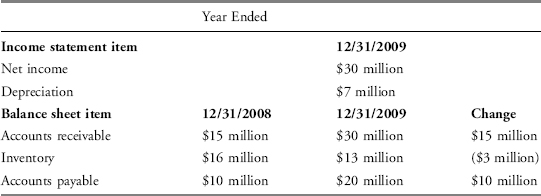
EXAMPLE 6-7 Adjusting Net Income to Compute Operating Cash Flow
Based on the following information for Pinkerly Inc., a fictitious company, what are the total adjustments that the company would make to net income in order to derive operating cash flow?
A. Add $5 million.
B. Add $21 million.
C. Subtract $9 million.
Solution: A is correct. To derive operating cash flow, the company would make the following adjustments to net income: add depreciation (a noncash expense) of $7 million; add the decrease in inventory of $3 million; add the increase in accounts payable of $10 million; and subtract the increase in accounts receivable of $15 million. Total additions of $20 million and total subtractions of $15 million result in net total additions of $5 million.
3.3. Conversion of Cash Flows from the Indirect to the Direct Method
An analyst may desire to review direct-format operating cash flow to review trends in cash receipts and payments (such as cash received from customers or cash paid to suppliers). If a direct-format statement is not available, cash flows from operating activities reported under the indirect method can be converted to the direct method. Accuracy of conversion depends on adjustments using data available in published financial reports. The method described here is sufficiently accurate for most analytical purposes.
The three-step conversion process is demonstrated for Acme Corporation in Exhibit 6-11. Referring again to Exhibits 6-6 and 6-7 for Acme Corporation’s income statement and balance sheet information, begin by disaggregating net income of $2,210 into total revenues and total expenses (Step 1). Next, remove any nonoperating and noncash items (Step 2). For Acme, we therefore remove the nonoperating gain on the sale of equipment of $205 and the noncash depreciation expense of $1,052. Then, convert accrual amounts of revenues and expenses to cash flow amounts of receipts and payments by adjusting for changes in working capital accounts (Step 3). The results of these adjustments are the items of information for the direct format of operating cash flows. These line items are shown as the results of Step 3.
EXHIBIT 6-11 Conversion from the Indirect to the Direct Method
| Step 1 | Total revenues | $23,803 |
| Aggregate all revenue and all expenses | Total expenses | 21,593 |
| Net income | $2,210 | |
| Step 2 | Total revenue less noncash item revenues: | |
| Remove all noncash items from aggregated revenues and expenses and break out remaining items into relevant cash flow items | ($23,803 − $205)=$23,598 | |
| Revenue | $23,598 | |
| Total expenses less noncash item expenses: | ($21,593 − $1,052)=$20,541 | |
| Cost of goods sold | $11,456 | |
| Salary and wage expenses | 4,123 | |
| Other operating expenses | 3,577 | |
| Interest expense | 246 | |
| Income tax expense | 1,139 | |
| Total | $20,541 | |
| Step 3 | aCash received from customers | $23,543 |
| Convert accrual amounts to cash flow amounts by adjusting for working capital changes | bCash paid to suppliers | (11,900) |
| cCash paid to employees | (4,113) | |
| dCash paid for other operating expenses | (3,532) | |
| eCash paid for interest | (258) | |
| fCash paid for income tax | (1,134) | |
| Net cash provided by operating activities | $2,606 |
Calculations for Step 3
aRevenue of $23,598 less increase in accounts receivable of $55.
bCost of goods sold of $11,456 plus increase in inventory of $707 less increase in accounts payable of $263.
cSalary and wage expense of $4,123 less increase in salary and wage payable of $10.
dOther operating expenses of $3,577 less decrease in prepaid expenses of $23 less increase in other accrued liabilities of $22.
eInterest expense of $246 plus decrease in interest payable of $12.
fIncome tax expense of $1,139 less increase in income tax payable of $5.
4. CASH FLOW STATEMENT ANALYSIS
The analysis of a company’s cash flows can provide useful information for understanding a company’s business and earnings and for predicting its future cash flows. This section describes tools and techniques for analyzing the statement of cash flows, including the analysis of sources and uses of cash and cash flow, common-size analysis, and calculation of free cash flow measures and cash flow ratios.
4.1. Evaluation of the Sources and Uses of Cash
Evaluation of the cash flow statement should involve an overall assessment of the sources and uses of cash between the three main categories as well as an assessment of the main drivers of cash flow within each category, as follows:
1. Evaluate where the major sources and uses of cash flow are between operating, investing, and financing activities.
2. Evaluate the primary determinants of operating cash flow.
3. Evaluate the primary determinants of investing cash flow.
4. Evaluate the primary determinants of financing cash flow.
Step 1: The major sources of cash for a company can vary with its stage of growth. For a mature company, it is expected and desirable that operating activities are the primary source of cash flows. Over the long term, a company must generate cash from its operating activities. If operating cash flow were consistently negative, a company would need to borrow money or issue stock (financing activities) to fund the shortfall. Eventually, these providers of capital need to be repaid from operations or they will no longer be willing to provide capital. Cash generated from operating activities can be used in either investing or financing activities. If the company has good opportunities to grow the business or other investment opportunities, it is desirable to use the cash in investing activities. If the company does not have profitable investment opportunities, the cash should be returned to capital providers, a financing activity. For a new or growth stage company, operating cash flow may be negative for some period of time as it invests in such assets as inventory and receivables (extending credit to new customers) in order to grow the business. This situation is not sustainable over the long term, so eventually the cash must start to come primarily from operating activities so that capital can be returned to the providers of capital. Lastly, it is desirable that operating cash flows are sufficient to cover capital expenditures (in other words, the company has free cash flow as discussed further in Section 4.3). In summary, major points to consider at this step are
- What are the major sources and uses of cash flow?
- Is operating cash flow positive and sufficient to cover capital expenditures?
Step 2: Turning to the operating section, the analysts should examine the most significant determinants of operating cash flow. Companies need cash for use in operations (for example, to hold receivables and inventory and to pay employees and suppliers) and receive cash from operating activities (for example, payments from customers). Under the indirect method, the increases and decreases in receivables, inventory, payables, and so on can be examined to determine whether the company is using or generating cash in operations and why. It is also useful to compare operating cash flow with net income. For a mature company, because net income includes noncash expenses (depreciation and amortization), it is expected and desirable that operating cash flow exceeds net income. The relationship between net income and operating cash flow is also an indicator of earnings quality. If a company has large net income but poor operating cash flow, it may be a sign of poor earnings quality. The company may be making aggressive accounting choices to increase net income but not be generating cash for its business. You should also examine the variability of both earnings and cash flow and consider the impact of this variability on the company’s risk as well as the ability to forecast future cash flows for valuation purposes. In summary:
- What are the major determinants of operating cash flow?
- Is operating cash flow higher or lower than net income? Why?
- How consistent are operating cash flows?
Step 3: Within the investing section, you should evaluate each line item. Each line item represents either a source or use of cash. This enables you to understand where the cash is being spent (or received). This section will tell you how much cash is being invested for the future in property, plant, and equipment; how much is used to acquire entire companies; and how much is put aside in liquid investments, such as stocks and bonds. It will also tell you how much cash is being raised by selling these types of assets. If the company is making major capital investments, you should consider where the cash is coming from to cover these investments (e.g., is the cash coming from excess operating cash flow or from the financing activities described in Step 4). If assets are being sold, it is important to determine why and to assess the effects on the company.
Step 4: Within the financing section, you should examine each line item to understand whether the company is raising capital or repaying capital and what the nature of its capital sources are. If the company is borrowing each year, you should consider when repayment may be required. This section will also present dividend payments and repurchases of stock that are alternative means of returning capital to owners. It is important to assess why capital is being raised or repaid.
We now provide an example of a cash flow statement evaluation.
EXAMPLE 6-8 Analysis of the Cash Flow Statement
Derek Yee, CFA, is preparing to forecast cash flow for Groupe Danone (FP: BN) as an input into his valuation model. He has asked you to evaluate the historical cash flow statement of Groupe Danone, which is presented in Exhibit 6-12. Groupe Danone prepares its financial statements in conformity with IFRS. Note that Groupe Danone presents the most recent period on the right.
EXHIBIT 6-12 Groupe Danone Consolidated Financial Statements
| Consolidated Statements of Cash Flows Years Ended 31 December (in € millions) | ||
| 2008 | 2009 | |
| Net income attributable to the Group | 1,313 | 1,361 |
| Net income attributable to minority interests | 178 | 160 |
| Net income from discontinued operations | (269) | — |
| Share of profits of associates | (62) | 77 |
| Depreciation and amortization | 525 | 549 |
| Dividends received from associates | 29 | 174 |
| Other flows with impact on cash | (113) | (157) |
| Other flows with no impact on cash | 98 | (72) |
| Cash flows provided by operating activities, excluding changes in net working capital | 1,699 | 2,092 |
| (Increase) decrease in inventories | 3 | 37 |
| (Increase) decrease in trade accounts receivable | (74) | (112) |
| Increase (decrease) in trade accounts payable | 36 | (127) |
| Changes in other accounts receivable and payable | 90 | 110 |
| Change in other working capital requirements | 55 | (92) |
| Cash flows provided by (used in) operating activities | 1,754 | 2,000 |
| Capital expenditure | (706) | (699) |
| Purchase of businesses and other investments, net of cash and cash equivalents acquired | (259) | (147) |
| Proceeds from the sale of businesses and other investments, including indebtedness of companies sold | 329 | 1,024 |
| (Increase) decrease in long-term loans and other long-term assets | 67 | 36 |
| Cash flows provided by (used in) investing activities | (569) | 214 |
| Increase in capital and additional paid-in capital | 48 | 2,977 |
| Purchases of treasury stock (net of disposals) | 46 | 100 |
| Dividends paid to Danone shareholders and to minority interests | (705) | (451) |
| Settlement of debt hedge financial instruments (mainly equalization payments) | (154) | |
| Increase (decrease) in noncurrent financial liabilities | 1,338 | (4,154) |
| Increase (decrease) in current financial liabilities | (1,901) | (427) |
| Increase (decrease) in marketable securities | 63 | (60) |
| Cash flows provided by (used in) financing activities | (1,111) | (2,169) |
| Effect of exchange rate changes | (31) | 8 |
| Increase (decrease) in cash and cash equivalents | 43 | 53 |
| Cash and cash equivalents at beginning of period | 548 | 591 |
| Cash and cash equivalents at end of period | 591 | 644 |
| Supplemental disclosures | ||
| Payments during the year of: | ||
| • net interest | 433 | 272 |
| • income tax | 430 | 413 |
Yee would like answers to the following questions:
- What are the major sources of cash for Groupe Danone?
- What are the major uses of cash for Groupe Danone?
- What is the relationship between net income and cash flow from operating activities?
- Is cash flow from operating activities sufficient to cover capital expenditures?
- Other than capital expenditures, is cash being used or generated in investing activities?
- What types of financing cash flows does Groupe Danone have?
Solution: The major categories of cash flows can be summarized as follows (in € millions):
| 2008 | 2009 | |
| Cash flows provided by operating activities | 1,754 | 2,000 |
| Cash flows provided by (used in) investing activities | (569) | 214 |
| Cash flows provided by (used in) financing activities | (1,111) | (2,169) |
| Exchange rate effects on cash | (31) | 8 |
| Increase in cash | 43 | 53 |
The primary source of cash for Groupe Danone is operating activities. In 2009, investing activities provided cash as the result of the sale of businesses and other investments. Cash flow is being used in financing activities, primarily to repay financial liabilities and to pay dividends. The fact that the primary source of cash is from operations is positive and desirable for a mature company. Additionally, the fact that operating cash flow exceeds net income in both years is a positive sign. Finally, operating cash flows exceed capital expenditures, indicating that the company can fund capital expenditures from operations.
4.2. Common-Size Analysis of the Statement of Cash Flows
In common-size analysis of a company’s income statement, each income and expense line item is expressed as a percentage of net revenues (net sales). For the common-size balance sheet, each asset, liability, and equity line item is expressed as a percentage of total assets. For the common-size cash flow statement, there are two alternative approaches. The first approach is to express each line item of cash inflow (outflow) as a percentage of total inflows (outflows) of cash, and the second approach is to express each line item as a percentage of net revenue.
Exhibit 6-13 demonstrates the total cash inflows/total cash outflows method for Acme Corporation. Under this approach, each of the cash inflows is expressed as a percentage of the total cash inflows, whereas each of the cash outflows is expressed as a percentage of the total cash outflows. In Panel A, Acme’s common-size statement is based on a cash flow statement using the direct method of presenting operating cash flows. Operating cash inflows and outflows are separately presented on the cash flow statement, and therefore, the common-size cash flow statement shows each of these operating inflows (outflows) as a percentage of total inflows (outflows). In Panel B, Acme’s common-size statement is based on a cash flow statement using the indirect method of presenting operating cash flows. When a cash flow statement has been presented using the indirect method, operating cash inflows and outflows are not separately presented; therefore, the common-size cash flow statement shows only the net operating cash flow (net cash provided by or used in operating activities) as a percentage of total inflows or outflows, depending on whether the net amount was a cash inflow or outflow. Because Acme’s net operating cash flow is positive, it is shown as a percentage of total inflows.
EXHIBIT 6-13 Acme Corporation Common-Size Cash Flow Statement Year Ended 31 December 2009
| Panel A. Direct Format for Cash Flow | ||
| Inflows | Percentage of Total Inflows | |
| Receipts from customers | $23,543 | 96.86% |
| Sale of equipment | 762 | 3.14 |
| Total | $24,305 | 100.00% |
| Outflows | Percentage of Total Outflows | |
| Payments to suppliers | $11,900 | 48.66% |
| Payments to employees | 4,113 | 16.82 |
| Payments for other operating expenses | 3,532 | 14.44 |
| Payments for interest | 258 | 1.05 |
| Payments for income tax | 1,134 | 4.64 |
| Purchase of equipment | 1,300 | 5.32 |
| Retirement of long-term debt | 500 | 2.04 |
| Retirement of common stock | 600 | 2.45 |
| Dividend payments | 1,120 | 4.58 |
| Total | $24,457 | 100.00% |
| Net increase (decrease) in cash | ($152) | |
| Panel B. Indirect Format for Cash Flow | ||
| Inflows | Percentage of Total Inflows | |
| Net cash provided by operating activities | $2,606 | 77.38% |
| Sale of equipment | 762 | 22.62 |
| Total | $3,368 | 100.00% |
| Outflows | Percentage of Total Outflows | |
| Purchase of equipment | $1,300 | 36.93% |
| Retirement of long-term debt | 500 | 14.20 |
| Retirement of common stock | 600 | 17.05 |
| Outflows | Percentage of Total Outflows | |
| Dividend payments | 1,120 | 31.82 |
| Total | $3,520 | 100.00% |
| Net increase (decrease) in cash | ($152) | |
Exhibit 6-14 demonstrates the net revenue common-size cash flow statement for Acme Corporation. Under the net revenue approach, each line item in the cash flow statement is shown as a percentage of net revenue. The common-size statement in this exhibit has been developed based on Acme’s cash flow statement using the indirect method for operating cash flows and using net revenue of $23,598 as shown in Exhibit 6-6. Each line item of the reconciliation between net income and net operating cash flows is expressed as a percentage of net revenue. The common-size format makes it easier to see trends in cash flow rather than just looking at the total amount. This method is also useful to the analyst in forecasting future cash flows because individual items in the common-size statement (e.g., depreciation, fixed capital expenditures, debt borrowing, and repayment) are expressed as a percentage of net revenue. Thus, once the analyst has forecast revenue, the common-size statement provides a basis for forecasting cash flows for those items with an expected relation to net revenue.
EXHIBIT 6-14 Acme Corporation Common-Size Cash Flow Statement: Indirect Format Year Ended 31 December 2009
| Percentage of Net Revenue | ||
| Cash flow from operating activities: | ||
| Net income | $2,210 | 9.37% |
| Depreciation expense | 1,052 | 4.46 |
| Gain on sale of equipment | (205) | (0.87) |
| Increase in accounts receivable | (55) | (0.23) |
| Increase in inventory | (707) | (3.00) |
| Decrease in prepaid expenses | 23 | 0.10 |
| Increase in accounts payable | 263 | 1.11 |
| Increase in salary and wage payable | 10 | 0.04 |
| Decrease in interest payable | (12) | (0.05) |
| Increase in income tax payable | 5 | 0.02 |
| Increase in other accrued liabilities | 22 | 0.09 |
| Net cash provided by operating activities | $2,606 | 11.04% |
| Cash flow from investing activities: | ||
| Cash received from sale of equipment | $762 | 3.23% |
| Cash paid for purchase of equipment | (1,300) | (5.51) |
| Net cash used for investing activities | $(538) | (2.28)% |
| Cash flow from financing activities: | ||
| Cash paid to retire long-term debt | $(500) | (2.12)% |
| Cash paid to retire common stock | (600) | (2.54) |
| Cash paid for dividends | (1,120) | (4.75) |
| Net cash used for financing activities | $(2,220) | (9.41)% |
| Net decrease in cash | $(152) | (0.64)% |
EXAMPLE 6-9 Analysis of a Common-Size Cash Flow Statement
Andrew Potter is examining an abbreviated common-size cash flow statement for Dell Inc. (NASDAQ: DELL), a provider of technological products and services. The common-size cash flow statement was prepared by dividing each line item by total net revenue for the same year. The terminology is that used by Dell. “Change in cash from” is used instead of “cash provided by (used in).”
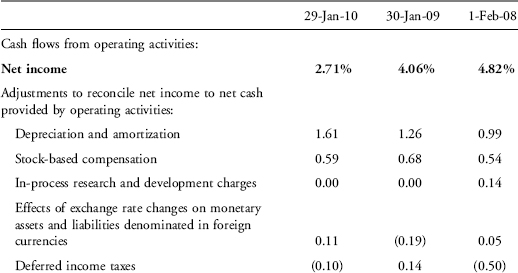
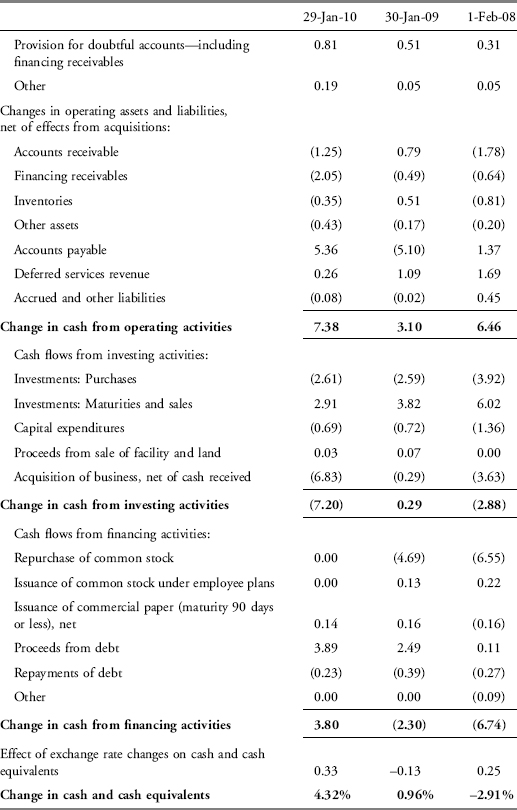
Based on the information in the previous exhibit:
1. Discuss the significance of
A. depreciation and amortization.
B. capital expenditures.
2. Compare Dell’s operating cash flow as a percentage of revenue with Dell’s net profit margin.
3. Discuss Dell’s use of its positive operating cash flow.
Solution to 1:
A. Dell’s depreciation and amortization expense is less than 2 percent of total net revenue in the year ended 29 January 2010. However, as a percentage of total revenue, it has been increasing each year. In the year ended 29 January 2010, adding this expense back to determine operating cash flow has a significant impact on cash flow from operations as a percentage of total revenue because its size was approximately 60 percent of net profit margin (net income/total net revenue).
B. Dell’s level of capital expenditures is relatively small, less than 1 percent of revenues in the most recent years. Cash flow from operations as a percentage of total revenue indicates that operating cash flows are more than sufficient to cover these expenditures.
Solution to 2: Dell’s operating cash flow as a percentage of revenue is usually much higher than net profit margin, with the exception of the year ended 30 January 2009. In that year, the net profit margin was 4.06 percent and operating cash flow as a percentage of total revenue was 3.10 percent. The primary difference between that year and the other years appears to have been a significant reduction in accounts payable; in each of the other years, accounts payable increased. For the year ended 29 January 2010, operating cash flow as a percentage of total revenue was 7.38 percent and net profit margin was 2.71 percent.
Solution to 3: In the year ended 29 January 2010, the largest cash outflow was for an acquisition of business (investing activities). In prior years, much of Dell’s operating cash flow was used to repurchase its own stock (financing activities). In each of the three years, Dell’s purchases of investments (investing activities) were less than the amounts of maturities and sales; thus, on a net basis, investments provided a net source of cash.
4.3. Free Cash Flow to the Firm and Free Cash Flow to Equity
It was mentioned earlier that it is desirable that operating cash flows are sufficient to cover capital expenditures. The excess of operating cash flow over capital expenditures is known generically as free cash flow. For purposes of valuing a company or its equity securities, an analyst may want to determine and use other cash flow measures, such as free cash flow to the firm (FCFF) or free cash flow to equity (FCFE).
FCFF is the cash flow available to the company’s suppliers of debt and equity capital after all operating expenses (including income taxes) have been paid and necessary investments in working capital and fixed capital have been made. FCFF can be computed starting with net income as9
![]()
where
NI=Net income
NCC=Noncash charges (such as depreciation and amortization)
Int=Interest expense
FCInv=Capital expenditures (fixed capital, such as equipment)
WCInv=Working capital expenditures
The reason for adding back interest is that FCFF is the cash flow available to the suppliers of debt capital as well as equity capital. Conveniently, FCFF can also be computed from cash flow from operating activities as
![]()
CFO represents cash flow from operating activities under U.S. GAAP or under IFRS where the company has included interest paid in operating activities. If interest paid was included in financing activities, then CFO does not have to be adjusted for Int(1 − Tax rate). Under IFRS, if the company has placed interest and dividends received in investing activities, these should be added back to CFO to determine FCFF. Additionally, if dividends paid were subtracted in the operating section, these should be added back in to compute FCFF.
The computation of FCFF for Acme Corporation (based on the data from Exhibits 6-6, 6-7, and 6-8) is as follows:
| CFO | $2,606 |
| Plus: Interest paid times (1 − income tax rate) | |
| {$258 [1 − 0.34a]} | 170 |
| Less: Net investments in fixed capital | |
| ($1,300 − $762) | (538) |
| FCFF | $2,238 |
aIncome tax rate of 0.34=(Tax expense÷Pretax income)=($1,139÷$3,349).
FCFE is the cash flow available to the company’s common stockholders after all operating expenses and borrowing costs (principal and interest) have been paid and necessary investments in working capital and fixed capital have been made. FCFE can be computed as
![]()
When net borrowing is negative, debt repayments exceed receipts of borrowed funds. In this case, FCFE can be expressed as
![]()
The computation of FCFE for Acme Corporation (based on the data from Exhibits 6-6, 6-7, and 6-8) is as follows:
| CFO | $2,606 |
| Less: Net investments in fixed capital ($1,300 − $762) | (538) |
| Less: Debt repayment | (500) |
| FCFE | $1,568 |
Positive FCFE means that the company has an excess of operating cash flow over amounts needed for capital expenditures and repayment of debt. This cash would be available for distribution to owners.
4.4. Cash Flow Ratios
The statement of cash flows provides information that can be analyzed over time to obtain a better understanding of the past performance of a company and its future prospects. This information can also be effectively used to compare the performance and prospects of different companies in an industry and of different industries. There are several ratios based on cash flow from operating activities that are useful in this analysis. These ratios generally fall into cash flow performance (profitability) ratios and cash flow coverage (solvency) ratios. Exhibit 6-15 summarizes the calculation and interpretation of some of these ratios.
EXHIBIT 6-15 Cash Flow Ratios
| Performance Ratios | Calculation | What It Measures |
| Cash flow to revenue | CFO ÷ Net revenue | Operating cash generated per dollar of revenue |
| Cash return on assets | CFO ÷ Average total assets | Operating cash generated per dollar of asset investment |
| Cash return on equity | CFO ÷ Average shareholders’ equity | Operating cash generated per dollar of owner investment |
| Cash to income | CFO ÷ Operating income | Cash generating ability of operations |
| Cash flow per sharea | (CFO − Preferred dividends)÷ Number of common shares outstanding | Operating cash flow on a per-share basis |
| Coverage Ratios | Calculation | What It Measures |
| Debt coverage | CFO ÷ Total debt | Financial risk and financial leverage |
| Interest coverageb | (CFO+Interest paid+Taxes paid) ÷ Interest paid | Ability to meet interest obligations |
| Reinvestment | CFO ÷ Cash paid for long-term assets | Ability to acquire assets with operating cash flows |
| Debt payment | CFO ÷ Cash paid for long-term debt repayment | Ability to pay debts with operating cash flows |
| Dividend payment | CFO ÷ Dividends paid | Ability to pay dividends with operating cash flows |
| Investing and financing | CFO ÷ Cash outflows for investing and financing activities | Ability to acquire assets, pay debts, and make distributions to owners |
aIf the company reports under IFRS and includes total dividends paid as a use of cash in the operating section, total dividends should be added back to CFO as reported and then preferred dividends should be subtracted. Recall that CFO reported under U.S. GAAP and IFRS may differ depending on the treatment of interest and dividends, received and paid.
bIf the company reports under IFRS and included interest paid as a use of cash in the financing section, then interest paid should not be added back to the numerator.
EXAMPLE 6-10 A Cash Flow Analysis of Comparables
Andrew Potter is comparing the cash-flow-generating ability of Dell Inc. with that of other computer manufacturers: Hewlett Packard (NYSE: HPQ) and Apple Inc. (NASDAQ: AAPL). He collects information from the companies’ annual reports and prepares the following table.
Cash flow from operating activities
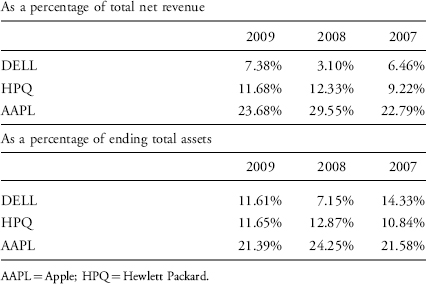
What is Potter likely to conclude about the relative cash-flow-generating ability of these companies?
Solution: On both measures—operating cash flow divided by revenue and operating cash flow divided by assets—Apple’s performance was much stronger than the two comparable companies. Dell’s operating cash flow divided by revenue is lower than HP’s for all three years. Dell’s operating cash flow relative to assets is similar to HP’s in 2009, lower than HP’s in 2008, and higher than HP’s in 2007. Apple’s measures are significantly higher than the others, indicating that it has the best cash generating ability. Note that Apple’s cash generating ability presumably reflects the company’s successful introduction and sales of new products (including the iPhone), tightly managed inventory, and ability to generate revenues (and operating cash flow) from businesses not requiring significant investment in such assets as service contracts and sales of third-party compatible products. Overall, Potter should undertake additional research to understand the underlying business reasons for the differences in the companies’ cash flow profiles.
The cash flow statement provides important information about a company’s cash receipts and cash payments during an accounting period as well as information about a company’s operating, investing, and financing activities. Although the income statement provides a measure of a company’s success, cash and cash flow are also vital to a company’s long-term success. Information on the sources and uses of cash helps creditors, investors, and other statement users evaluate the company’s liquidity, solvency, and financial flexibility. Key concepts are as follows:
- Cash flow activities are classified into three categories: operating activities, investing activities, and financing activities. Significant noncash transaction activities (if present) are reported by using a supplemental disclosure note to the cash flow statement.
- Cash flow statements under IFRS and U.S. GAAP are similar; however, IFRS provide companies with more choices in classifying some cash flow items as operating, investing, or financing activities.
- Companies can use either the direct or the indirect method for reporting their operating cash flow:
- The direct method discloses operating cash inflows by source (e.g., cash received from customers, cash received from investment income) and operating cash outflows by use (e.g., cash paid to suppliers, cash paid for interest) in the operating activities section of the cash flow statement.
- The indirect method reconciles net income to operating cash flow by adjusting net income for all noncash items and the net changes in the operating working capital accounts.
- The cash flow statement is linked to a company’s income statement and comparative balance sheets and to data on those statements.
- Although the indirect method is most commonly used by companies, an analyst can generally convert it to an approximation of the direct format by following a simple three-step process.
- An evaluation of a cash flow statement should involve an assessment of the sources and uses of cash and the main drivers of cash flow within each category of activities.
- The analyst can use common-size statement analysis for the cash flow statement. Two approaches to developing the common-size statements are the total cash inflows/total cash outflows method and the percentage of net revenues method.
- The cash flow statement can be used to determine free cash flow to the firm (FCFF) and free cash flow to equity (FCFE).
- The cash flow statement may also be used in financial ratios that measure a company’s profitability, performance, and financial strength.
1. The three major classifications of activities in a cash flow statement are
A. inflows, outflows, and net flows.
B. operating, investing, and financing.
C. revenues, expenses, and net income.
2. The sale of a building for cash would be classified as what type of activity on the cash flow statement?
A. Operating
B. Investing
C. Financing
3. Which of the following is an example of a financing activity on the cash flow statement under U.S. GAAP?
A. Payment of interest
B. Receipt of dividends
C. Payment of dividends
4. A conversion of a face value $1 million convertible bond for $1 million of common stock would most likely be
A. reported as a $1 million investing cash inflow and outflow.
B. reported as a $1 million financing cash outflow and inflow.
C. reported as supplementary information to the cash flow statement.
5. Interest paid is classified as an operating cash flow
A. under U.S. GAAP but may be classified as either operating or investing cash flows under IFRS.
B. under IFRS but may be classified as either operating or investing cash flows under U.S. GAAP.
C. under U.S. GAAP but may be classified as either operating or financing cash flows under IFRS.
6. Cash flows from taxes on income
A. must be separately disclosed under IFRS only.
B. must be separately disclosed under U.S. GAAP only.
C. must be separately disclosed under both IFRS and U.S GAAP.
7. Which of the following components of the cash flow statement may be prepared under the indirect method under both IFRS and U.S. GAAP?
A. Operating
B. Investing
C. Financing
8. Which of the following is most likely to appear in the operating section of a cash flow statement under the indirect method?
A. Net income
B. Cash paid to suppliers
C. Cash received from customers
9. Red Road Company, a consulting company, reported total revenues of $100 million, total expenses of $80 million, and net income of $20 million in the most recent year. If accounts receivable increased by $10 million, how much cash did the company receive from customers?
A. $90 million
B. $100 million
C. $110 million
10. Green Glory Corp., a garden supply wholesaler, reported cost of goods sold for the year of $80 million. Total assets increased by $55 million, including an increase of $5 million in inventory. Total liabilities increased by $45 million, including an increase of $2 million in accounts payable. The cash paid by the company to its suppliers is most likely closest to:
A. $73 million.
B. $77 million.
C. $83 million.
11. Purple Fleur S.A., a retailer of floral products, reported cost of goods sold for the year of $75 million. Total assets increased by $55 million, but inventory declined by $6 million. Total liabilities increased by $45 million, and accounts payable increased by $2 million. The cash paid by the company to its suppliers is most likely closest to:
A. $67 million.
B. $79 million.
C. $83 million.
12. White Flag, a women’s clothing manufacturer, reported salaries expense of $20 million. The beginning balance of salaries payable was $3 million, and the ending balance of salaries payable was $1 million. How much cash did the company pay in salaries?
A. $18 million
B. $21 million
C. $22 million
13. An analyst gathered the following information from a company’s 2010 financial statements (in $ millions):
| Year Ended 31 December | 2009 | 2010 |
| Net sales | 245.8 | 254.6 |
| Cost of goods sold | 168.3 | 175.9 |
| Accounts receivable | 73.2 | 68.3 |
| Inventory | 39.0 | 47.8 |
| Accounts payable | 20.3 | 22.9 |
Based only on the information given here, the company’s 2010 statement of cash flows in the direct format would include amounts (in $ millions) for cash received from customers and cash paid to suppliers, respectively, that are closest to:
| Cash Received from Customers | Cash Paid to Suppliers | |
| A. | 249.7 | 169.7 |
| B. | 259.5 | 174.5 |
| C. | 259.5 | 182.1 |
14. Golden Cumulus Corp., a commodities trading company, reported interest expense of $19 million and taxes of $6 million. Interest payable increased by $3 million, and taxes payable decreased by $4 million over the period. How much cash did the company pay for interest and taxes?
A. $22 million for interest and $10 million for taxes
B. $16 million for interest and $2 million for taxes
C. $16 million for interest and $10 million for taxes
15. An analyst gathered the following information from a company’s 2010 financial statements (in $ millions):
| Balances as of Year Ended 31 December | 2009 | 2010 |
| Retained earnings | 120 | 145 |
| Accounts receivable | 38 | 43 |
| Inventory | 45 | 48 |
| Accounts payable | 36 | 29 |
In 2010, the company declared and paid cash dividends of $10 million and recorded depreciation expense in the amount of $25 million. The company considers dividends paid a financing activity. The company’s 2010 cash flow from operations (in $ millions) was closest to
A. 25.
B. 45.
C. 75.
16. Silverago Incorporated, an international metals company, reported a loss on the sale of equipment of $2 million in 2010. In addition, the company’s income statement shows depreciation expense of $8 million and the cash flow statement shows capital expenditure of $10 million, all of which was for the purchase of new equipment. Using the following information from the comparative balance sheets, how much cash did the company receive from the equipment sale?
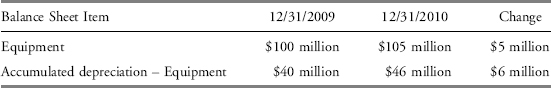
A. $1 million
B. $2 million
C. $3 million
17. Jaderong Plinkett Stores reported net income of $25 million. The company has no outstanding debt. Using the following information from the comparative balance sheets (in millions), what should the company report in the financing section of the statement of cash flows in 2010?
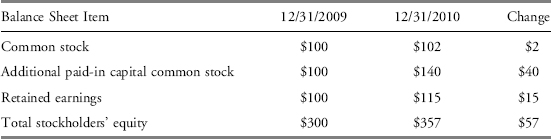
A. Issuance of common stock of $42 million; dividends paid of $10 million
B. Issuance of common stock of $38 million; dividends paid of $10 million
C. Issuance of common stock of $42 million; dividends paid of $40 million
18. Based on the following information for Star Inc., what are the total net adjustments that the company would make to net income in order to derive operating cash flow?
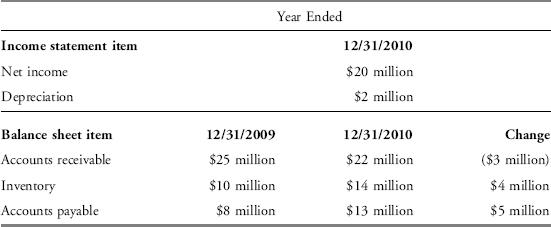
A. Add $2 million
B. Add $6 million
C. Subtract $6 million
19. The first step in cash flow statement analysis should be to
A. evaluate consistency of cash flows.
B. determine operating cash flow drivers.
C. identify the major sources and uses of cash.
20. Which of the following would be valid conclusions from an analysis of the cash flow statement for Telefónica Group presented in Exhibit 6-3 in the text?
A. The primary use of cash is financing activities.
B. The primary source of cash is operating activities.
C. Telefónica classifies interest received as an operating activity.
21. Which is an appropriate method of preparing a common-size cash flow statement?
A. Show each item of revenue and expense as a percentage of net revenue.
B. Show each line item on the cash flow statement as a percentage of net revenue.
C. Show each line item on the cash flow statement as a percentage of total cash outflows.
22. Which of the following is an appropriate method of computing free cash flow to the firm?
A. Add operating cash flows to capital expenditures and deduct after-tax interest payments.
B. Add operating cash flows to after-tax interest payments and deduct capital expenditures.
C. Deduct both after-tax interest payments and capital expenditures from operating cash flows.
23. An analyst has calculated a ratio using as the numerator the sum of operating cash flow, interest, and taxes and as the denominator the amount of interest. What is this ratio, what does it measure, and what does it indicate?
A. This ratio is an interest coverage ratio, measuring a company’s ability to meet its interest obligations and indicating a company’s solvency.
B. This ratio is an effective tax ratio, measuring the amount of a company’s operating cash flow used for taxes and indicating a company’s efficiency in tax management.
C. This ratio is an operating profitability ratio, measuring the operating cash flow generated accounting for taxes and interest and indicating a company’s liquidity.
1IAS 7 Statement of Cash Flows.
2FASB ASC Topic 230 [Statement of Cash Flows].
3FASB ASC Section 230-10-45 [Statement of Cash Flows–Overall–Other Presentation Matters].
4A Comprehensive Business Reporting Model: Financial Reporting for Investors, CFA Institute Centre for Financial Market Integrity (July 2007), p. 13.
5The cash flow statement presented here includes a reconciliation of net income to cash generated from operations, which Unilever Group reports in Note 28 to the financial statement rather than on the statement itself.
6Unilever NV (Amsterdam: UNA; NYSE: UN) and Unilever PLC (London: ULVR; NYSE: UL) have independent legal structures, but a series of agreements enable the companies to operate as a single economic entity.
7This statement excludes the supplemental cash flow reconciliation provided at the bottom of the original cash flow statement by the company.
8There are other less typical explanations of the differences. For example, if revenue reported using accrual accounting is higher than the cash actually collected, it is possible that it is the result of a decrease in an unearned revenue liability account. If expenses reported using accrual accounting are lower than cash actually paid, it is possible that it is the result of an increase in prepaid expenses, inventory, or another asset account.
9See Pinto et al. (2010) for a detailed discussion of free cash flow computations.