
CHAPTER 16
EVALUATING FINANCIAL REPORTING QUALITY
![]() rem Tuna
rem Tuna
After completing this chapter, you will be able to do the following:
- Contrast cash-basis and accrual-basis accounting, and explain why accounting discretion exists in an accrual accounting system.
- Describe the relation between the level of accruals and the persistence of earnings and the relative multiples that the cash and accrual components of earnings should rationally receive in valuation.
- Explain opportunities and motivations for management to intervene in the external financial reporting process and mechanisms that discipline such intervention.
- Describe earnings quality and measures of earnings quality, and compare the earnings quality of peer companies.
- Explain mean reversion in earnings and how the accruals component of earnings affects the speed of mean reversion.
- Explain potential problems that affect the quality of financial reporting, including revenue recognition, expense recognition, balance sheet issues, and cash flow statement issues, and interpret warning signs of these potential problems.
Financial statement analysis involves taking a systematic approach to using information contained in the financial statements to assist in decision making. The set of decision makers using financial statements is varied. However, one thing they have in common is an interest in assessing a company’s future cash flow generating capability. Equity investors and analysts, credit investors and analysts, rating agencies, customers, employees, tax authorities, and others all have a need to estimate a company’s future cash flows. Although there are many sources of information relevant to such forecasting, one of the principal sources, and our focus in this reading, is the company’s financial statements (inclusive of supplemental information to the main financial statements).
Financial reporting quality relates to the accuracy with which a company’s reported financials reflect its operating performance and to their usefulness for forecasting future cash flows. Our focus in introducing this topic is on the income statement and the discretion (exercise of choice) embedded in the recording of various revenues and expenses—this affects net income, which is simply net revenue less total expense. Simple measures that capture the aggregate discretion reflected in reported net income are a very effective way to measure financial reporting quality. Companies exercising more (less) discretion can usually be classified as having weaker (stronger) financial reporting quality. This separation is especially useful in identifying companies who will have weaker (stronger) future cash flow generating capability.
The discussion in this reading extends the material introduced in the reading on financial statement analysis techniques. We begin with some fundamentals to highlight the extent of discretion that is embedded in financial statements. This discretion is a necessary part of financial reporting, but it brings with it unintended consequences. Discretion necessitates preparers of financial statements to make numerous “estimates” that suffer from neutral errors as well as strategic manipulation. We will walk through many examples of how discretion in the financial reporting system manifests itself in the form of systematic biases, which analysts would be foolhardy to ignore given the ever-increasing role that accounting numbers play in contracts and asset pricing. Our discussion will be broad, and will be generally from the perspective of an equity or credit analyst. However, much of the material covered is also relevant to the corporate financial analyst for evaluating acquisitions, restructurings, and other investments, and for calculating the value generated by strategic scenarios.
The remainder of this reading is organized as follows: Section 2 introduces discretion in accounting systems, comparing accrual and cash bases of accounting. Understanding this basic, yet often subtle, difference is crucial to all of the material in the reading, as it defines the scope for discretion that resides in the financial statements. Section 3 lays out the general context for financial reporting quality and introduces simple measures of financial reporting quality. Section 4 provides a structure for computing, analyzing, and interpreting various indicators and measures of financial reporting and earnings quality. Section 5 briefly discusses the implications for financial reporting quality of the trend towards fair value accounting. A summary of the key points and practice problems in the CFA Institute multiple-choice format conclude the reading.
2. DISCRETION IN ACCOUNTING SYSTEMS
To understand the issues in evaluating the quality of financial reporting, the analyst should be familiar with the context in which managerial discretion in accounting is exercised and with the principles and objectives of accrual accounting. The following sections provide that background.
2.1. Distinguishing Cash Basis from Accrual Basis Accounting
Our focus on external financial statements centers on the three primary financial statements: the balance sheet, income statement, and statement of cash flows. The balance sheet is a snapshot of the various asset, liability, and equity accounts. It reflects the financial status of the entity at a point in time. The income statement reports revenues less expenses, and the statement of cash flows which, when reported using the indirect method (which starts with net income), articulates how the change in cash observed on the balance sheet can reconcile to reported income.
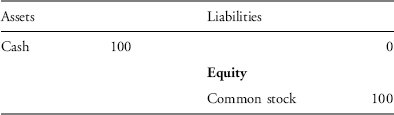
To help put these statements in context and clarify the importance of accrual accounting, consider a bicycle repair shop, Cadence Cycling. At the start of the current year the owner contributes $100 cash into the business. The opening balance sheet would look as follows:
Cadence Cycling Balance Sheet (Cash-Basis Accounting) as of 1 January 2007
During 2007, Cadence Cycling attracted two customers who brought their bikes to the store for service. The first customer pays $20 up front for the bike service and repairs. The second customer does not pay for the service up front; the estimated price for the service is $25. By the end of 2007, Cadence has completed work for the second customer but has not started the work for the first customer (we are ignoring the associated inventory parts to keep the example simple).
Under pure cash basis accounting, the only relevant transactions for the financial statements are those that involve cash. Thus, the balance sheet needed for this example includes only cash and cash equivalents, and the income statement (and statement of cash flows) is simply the change in cash and cash equivalents not attributable to external capital providers. The income statement and balance sheet under the cash basis would be as follows:
Cadence Cycling Income Statement (Cash-Basis Accounting) for the Year Ended 31 December 2007
| Revenues | |
| Cash collected from Customer #1 | 20 |
| Expenses | 0 |
| Net income | 20 |
Cadence Cycling Balance Sheet (Cash-Basis Accounting) as of 31 December 2007
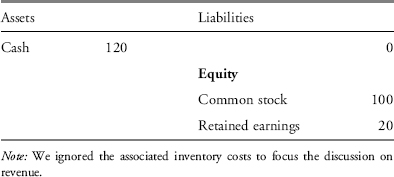
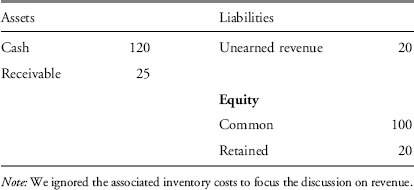
Obviously, we do not see such financial statements in practice for publicly traded companies (although we will see how financial statements can be recast to compute a pure cash basis of earnings, which can be used to benchmark accrued earnings). Instead, we see an accrual accounting system. In contrast to cash basis accounting, under accrual basis of accounting it is not the cash flow that defines when revenues and expenses are recorded in the financial statements; rather, there is an earnings process that triggers the recognition of revenues and expenses. Revenues are increases in net assets that result from the principal income-generating activity of the company, and expenses are reductions in net assets associated with the creation of those revenues. Thus, for example, accrual accounting records revenue not when cash is collected, but when a good or service has been provided to the customer. The income statement and balance sheet under the accrual basis for Cadence Cycling would be as follows:
Cadence Cycling Income Statement (Accrual-Basis Accounting) for the Year Ended 31 December 2007
| Revenues | |
| Bike services for Customer #2 | 25 |
| Expenses | 0 |
| Net income | 25 |
Cadence Cycling Balance Sheet (Accrual-Basis Accounting) as of 31 December 2007
There is a striking difference in the summary performance measure across the two sets of financial statements. Under the cash basis, Cadence Cycling reports return on average total assets (ROA) of $20/[($100+$120)/2] = 18.2%, whereas under the accrual basis the ROA is $25/[($100+$145)/2] = 20.4%. There is good reason to focus on the accrual-based earnings measure of performance, as it gives a better indication of the “true” value-creating activities during the year. The differences between ROA on a cash basis and on an accrual basis of accounting are even greater if we consider investment activities in noncurrent assets (assets that have long useful lives). Under cash basis accounting, if these noncurrent investments, such as the purchase of property, plant, and equipment (PP&E), are paid for with cash, the cash outflow would constitute a reduction to income in the year of the investment, whereas under the accrual basis of accounting that amount initially gets capitalized as an asset and is then periodically depreciated over the useful life of the asset. In the year of the investment, an ROA measure from the cash basis will be substantially lower than under the accrual basis. Conversely, in later periods, if the company makes fewer such investments in PP&E, then ROA will be higher under the cash basis in those future periods as the depreciation charge will continue to flow through the income statement under the accrual basis of accounting. This example naturally leads to the question: What are the relative merits of cash basis and accrual earnings?
One of the main objectives of external financial statements is to provide information that is useful to investors. Accrual accounting has emerged as the accepted method of achieving this objective. Accrual accounting centers on the identification and measurement of assets and liabilities, with accruals representing changes in noncash assets and liabilities. The financial analyst should be able to analyze whether a company’s use of discretion in implementing accruals facilitates or hampers investor decision making. The potential usefulness of the accrual system can be seen with the accruals and deferrals related to revenue recognition. For a company that sells a lot of its goods and services on credit terms, waiting until cash is received will not result in timely indication of the future cash flow generating ability of that enterprise. Instead, the company accrues revenues as the good is delivered or the service is provided. This is a desirable property of the accrual accounting system: It provides more timely and relevant information for decision making purposes. For example, if Cadence Cycling sold a bike during 2007 to a customer on credit, then under the cash basis of accounting that sale will not appear in the calculation of income for 2007. Instead, it will be recorded as revenue when the cash is collected in a future period. Under the accrual basis that sale will be recorded as revenue during 2007, with an adjustment for doubtful accounts (i.e., the full amount of the credit sale will be reduced based on an expectation of amounts that are not likely to be collected). The accrual basis of accounting therefore produces a net income figure that is more timely in communicating profit-generating activity to users of financial statements.
It is important to note that these same accruals bring with them discretion in estimating the amount of revenues that get allocated between fiscal periods. A number of questions must be answered before a number for revenue can be assigned to a given time period. For example, were the goods actually delivered? Were the services provided? Do the customers have recourse to return the merchandise? Do the customers have the ability, or credit-worthiness, to pay the receivable when it falls due? The answers to these questions are often subjective and create opportunities for strategic use of accrual accounting. By “strategic use” we mean that accounting numbers such as net income are important in a variety of contractual settings such as executive compensation. The economic incentives created by such contracts create an opportunity for management to be “strategic” or “opportunistic” when making determinations such as when a good has been provided, or how large a provision for doubtful accounts should be. We describe some of these incentives in more detail in Section 2.3.
Considerable research has examined whether cash basis or accrual basis performance measures are superior indicators of future cash flows and stock returns. The broad takeaway from the relevant literature is that accrual accounting earnings are superior to cash accounting earnings at summarizing company performance.1 However, accrual accounting aggregates numerous estimations with respect to the deferral and accrual of various revenue and expenses. For example, choices on useful life and residual value for the purposes of estimating periodic depreciation, choices on provisioning for doubtful accounts, choices on assumptions for computing postretirement obligations, etc., are all relevant in determining periodic net income. A simple way to isolate these aggregate accruals is to decompose accrued earnings into a cash flow and accrual component (we cover measurement of the components in Section 3.2). Extensive research has examined the benefits from this decomposition.2 There is clear evidence that the accrual component of earnings is less persistent (i.e., more transitory) than the cash component of earnings. (To explain persistence further, a completely persistent earnings stream is one for which a euro of earnings today implies a euro of earnings for all future periods.) The implication is that while accrual accounting is superior to cash accounting, the accrual component of earnings should receive a lower weighting than the cash component of earnings in evaluating company performance. This lower persistence is at least partly attributable to the greater subjectivity involved in the estimation of accruals.
The lower persistence of earnings resulting from high levels of accruals does not have to be a direct result of earnings management activity (i.e., deliberate activity aimed at influencing reporting earnings numbers, often with a goal of placing management in a favorable light). The nature of accrual accounting is to accrue and defer past, current, and anticipated future cash receipts and disbursements. The accrual process involves a significant amount of estimation of future cash receipts and payments, and a subjective allocation of past cash receipts and payments. In doing so, the accrual process creates accounts of varying reliability. For example, recording the net realizable value of receivables involves estimation of default risk across a portfolio of debtors. Other examples include estimating recoverable amounts of inventories, depreciating and amortizing long-lived assets, and estimating postretirement benefit obligations. Estimation errors (either intentional or unintentional) for the various asset, liability, and associated revenue and expense accounts will all lead to lower persistence in earnings. Collectively, these estimations manifest themselves in the magnitude of reported accruals. We will examine detailed examples related to these accounting distortions later in the reading. Specifically, we will introduce some broad measures of accruals that are useful from an investment perspective. To the extent that investors do not assign a lower weighting to accruals (because they are unable to fully comprehend the greater subjectivity involved in the estimation of accruals), securities become mispriced with respect to that information. A good analyst should not make this error: The accrual component of earnings should rationally receive a lower multiple in valuation than the cash component.
2.2. Placing Accounting Discretion in Context
In this section we outline some of the key areas of discretion embedded in the financial statements and identify why this discretion could be used strategically by management. Financial statements prepared under generally accepted accounting principles are riddled with estimates. These estimates lower the reliability of reported earnings as a result of both neutral estimation errors and the opportunistic use of discretion. For example, when estimating the allowance for doubtful accounts on credit sales and the related provision for bad debts, an estimate of 3 percent of sales may be made; but the actual rate of default could turn out to be 5 percent. The 2 percent understatement of expense in the year the provision was created may simply be an error in estimation or it could be the result of management intervention to report a lower expense. Disentangling whether the estimation error is neutral or strategic can be difficult, but the net result is the same for the financial analyst. If you see choices made that tend to over-(under-) state current income, then on average future cash flows will be lower (higher) respectively.
Examples of sources of accounting discretion include the following:
- Revenue recognition: Provisions for doubtful accounts, warranty provisions, returns and allowances, channel stuffing (forcing more products through a sales distribution channel than the channel can sell), timing of service or provision of goods, etc.
- Depreciation choices: Estimation of useful lives, residual value, method choice
- Inventory choices: Cost flow assumptions, obsolescence estimation, etc.
- Choices related to goodwill and other noncurrent assets: Periodic impairment tests
- Choices related to taxes: Valuation allowances
- Pension choices: Estimated return on plan assets, discount rates, wage growth, employee turnover, etc.
- Financial asset/liability valuation: Recent accounting pronouncements (e.g., SFAS 157 on Fair Value Measurement in the United States)3 focus on fair value as the basis for recording financial assets and liabilities. For certain types of financial assets and liabilities that rarely trade, there is considerable discretion in specifying the model inputs that would be used to assign a fair value.
- Stock option expense estimates: Volatility estimates, discount rates, etc.
This is only a partial list. Everything other than cash (excluding fraudulently reported cash) is the result of choice. We want to understand this choice and learn how to utilize disclosures in financial statements to quantify the extent that these choices are driving reported earnings.
It is important to keep in mind that the accounting discretion we discuss in this reading is part of a broader set of management decisions and interactions with financial markets that affect investor expectations. For example, the strategic use of accounting discretion can be combined with real business decisions such as the cutting of research and development activity or timing inventory purchases under LIFO accounting (permitted under U.S. GAAP but not IFRS), which also have a direct impact on financial statements. Management also can communicate directly with capital markets via their investor relations departments, conference calls, and conference presentations. There is a large industry set up to facilitate these communications, which are used by companies to explain company performance and help set expectations for future performance.
2.3. Manipulation Incentives
Financial statement information is used in a variety of settings that can create the incentive for the preparers of those statements to be opportunistic when reporting results. In particular, preparers may hope to influence capital markets and/or measured performance under various contracts. We examine these incentives in more detail in the following sections.
2.3.1 Capital Markets
When financial information is reported to capital markets, security prices move. This creates a clear incentive for management to report financial performance that meets or exceeds current expectations and to manage expectations going forward.
Research has focused on the propensity for companies to report earnings that meet various thresholds (e.g., beat historical earnings and beat consensus analyst forecasts). The exhibits following neatly summarize this phenomenon. Exhibit 16-1 reports the relative frequency of return on the market value equity (defined as net income divided by the market value of equity). The sample included is all U.S. Security and Exchange Commission (SEC) registrants from 1988–2003 (this is effectively all companies with securities that were publicly traded in the United States in that period). The horizontal axis groups companies into “NI (net income) class” buckets. These buckets are formed by cross-sectional ranking all companies into groups based on the magnitude of net income scaled by market capitalization. Each bar corresponds to a 50 basis point interval. For example, the bolded vertical bars correspond to firm-years where net income scaled by market capitalization is between 0 and 0.005 for the first bar, and between 0.005 and 0.01 for the second bolded bar. There is a clear “kink” in this distribution where more companies than expected report small profits (the bolded bars) compared to small losses. Some have claimed this kink is at least partly attributable to financial reporting manipulation.
EXHIBIT 16-1 Distribution of Net Income Deflated by Market Value of Equity
Source: Dechow, Richardson, and Tuna (2003).
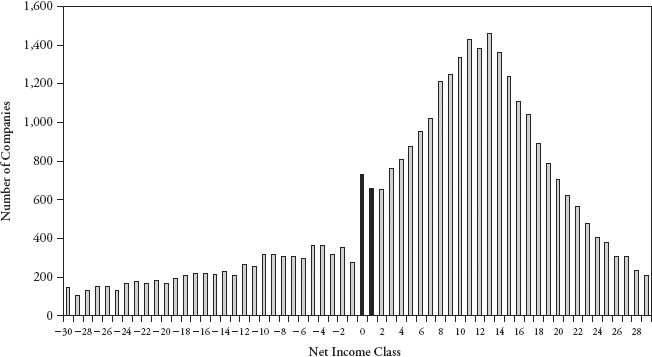
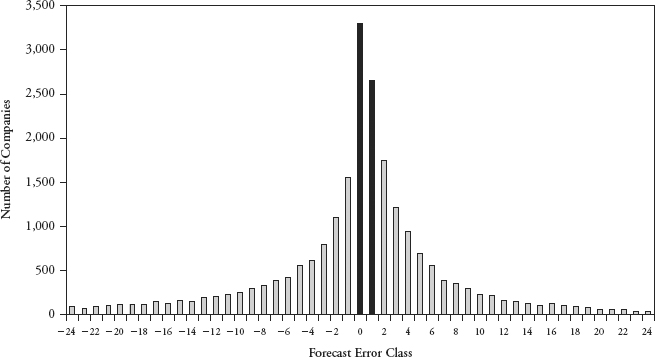
Exhibit 16-2 reports the distribution of forecast errors for the same sample of companies. A forecast error is defined as the difference between reported earnings and the most recent consensus analyst earnings forecast prior to the earnings announcement. There is a clear incidence of an asymmetry around the “zero” forecast error (i.e., where more companies report earnings that slightly exceed sell-side analyst forecasts than companies that report earnings that just miss these forecasts). (Sell-side analysts work at firms that sell trading and related services.) This pattern appears to illustrate a combination of earnings management (i.e., opportunistic use of accruals) and earnings expectations management (i.e., encouraging analysts to forecast a slightly lower number than they would otherwise).
The target that the company is trying to achieve is a moving benchmark: the consensus sell-side forecast. Using strategic communications with the investment community, management is able to move this benchmark. Likewise, the reported earnings number is a moving target attributable to the discretion afforded to management. The focus on reporting earnings that meet consensus estimates has often been referred to as the earnings game. Indeed, there is evidence that this “game” is related to capital market pressures facing a company. If one looks at the pattern of forecast errors throughout the fiscal year, initial forecasts tend to be optimistic relative to reported earnings (i.e., analysts are forecasting a number early in the year that is greater than what the company ends up reporting), and the later forecasts tend to be pessimistic (i.e., analysts are forecasting a number later in the year that is less than what the company ends up reporting). This switch from early optimism to late pessimism leads to a positive earnings surprise when earnings are finally announced. Exhibit 16-3 summarizes this pattern for the same sample of companies, and it is clear that this pattern has become increasingly common in more recent years. Furthermore, this pattern is stronger for companies that are subsequently issuing equity, or where insiders are, on average, selling their equity stake.
Besides capital markets, a variety of contracts can provide manipulation incentives, as discussed in the next section.
2.3.2. Contracts
Accounting information is used in a variety of contracts, including managerial contracts and contracts related to financial securities. Both types of contracts can provide the incentive for management to use accounting discretion opportunistically.
For example, managerial compensation is typically set as a function of reported earnings numbers (either in absolute terms or relative to a benchmark) as well as linked to stock price information, which in turn is a function of reported earnings. As an example, Textron Inc. reports in its 2006 proxy statement that the performance criteria used for its short-term and long-term incentive plans includes various financial statement based measures including return on assets, and various profit margin and turnover measures. Financial statement information is regularly used as a basis for the determination of executive compensation. These contracts provide a very direct incentive for management to be opportunistic in their use of accounting discretion.

There are other contracts where accounting information also is used, such as debt contracts. Companies with outstanding debt are parties to one or more debt covenants (agreements between the company as borrower and its creditors) that typically have a variety of restrictions (e.g., the company must maintain a minimum interest coverage ratio to avoid technical default and potentially costly debt renegotiation) and possibly performance pricing grids where interest costs are explicitly tied to financial performance. Collectively, these contracts provide very clear incentives for management to strategically use the accounting discretion afforded to them.
2.4. Mechanisms Disciplining Management
The discussion thus far points to many opportunities for management to manipulate reported financial results. Should we therefore place very little value on the output of this system? No. Financial statements provide very useful information in part due to the standard set of rules according to which they are prepared despite the discretion allowed by the standards. There are many mechanisms curtailing abuse of that discretion. Some examples of the mechanisms ensuring truthful reporting include:
- External auditors. Every public company is required to have their financial statements audited by a registered auditor. This process provides independent verification of the statements. Specifically, the external auditor’s responsibility is to express an opinion on the truthfulness of consolidated financial statements, an opinion on management’s assessment of internal controls, and an opinion on the effectiveness of internal financial reporting controls. Auditors’ opinions that are other than “unqualified” reflect a disagreement about the treatment or disclosure of information in the financial statements.
- Internal auditors, audit committee, and the board. The board of directors, through its committees and oversight of internal auditors, has the capacity to act as a check on management.
- Management certification. For companies subject to the U.S. Sarbanes–Oxley Act of 2002, the CEO and CFO must now certify the financial statements increasing their litigation risk, so they have more personal risk than formerly in manipulating reported financial results.
- Lawyers. Class action lawsuits are a potentially effective way to mitigate incentives to game the financial reporting system.
- Regulators. Regulatory actions, up to criminal prosecution for certain misdeeds, can make managers think twice about their actions.
- General market scrutiny. Financial journalists, short sellers, activist institutions, employee unions, analysts, etc. are constantly studying financial statements in an effort to identify financial shenanigans.
3. FINANCIAL REPORTING QUALITY: DEFINITIONS, ISSUES, AND AGGREGATE MEASURES
In this section we lay out a broad framework for financial reporting quality, focusing on earnings quality. Earnings quality is typically defined in terms of persistence and sustainability. For example, analysts often claim that earnings are considered to be of high quality when they are sustainable or when they “expect the reported level of earnings to be sustained or continued.” These approaches have at their core a view on forecasting future cash flows or earnings that is central to valuation. A summary performance measure that better forecasts future cash flows or earnings is arguably of higher quality than one that is a less effective forecaster, as it better serves that valuation purpose. Other discussions of earnings quality look at the extent of aggressive or conservative choices that have been made in the financial statements of the companies under examination. For example, companies that have used an accelerated depreciation method, have high allowances for inventory obsolescence and doubtful accounts, or have large unearned revenue balances could be considered to have employed conservative accounting choices. This is because earnings have been depressed in the current period. However, given the range of potential earnings outcomes, simply equating choices that lower reported earnings with high earnings quality provides at best a marginal indicator of financial reporting quality as defined in the introduction of this reading. Reporting earnings that are too high or too low results in an inferior earnings measure for the purpose of forecasting future company performance. Accruals are not independent over time. Rather, accruals have a natural self-correcting property. For example, an aggressive accounting choice in the past that capitalized an excess amount of cost into a noncurrent asset will lead to larger write-downs of that asset in future periods. Thus, the earlier aggressive choice (avoiding expensing at the time of capitalization) is associated with a later conservative action (expensing). Focusing on changes in balance sheet accounts, or equivalently the multitude of accruals and deferrals embedded in net income, is an efficient and effective way to capture cross-sectional variation in earnings quality. These accrual-based measures capture both aggressive and conservative accounting choices that impair the ability of accrued earnings to forecast future company performance.
3.1. Mean Reversion in Earnings
Our focus on accruals and deferrals for earnings quality has valuation at its core. Our aim is to identify companies that have earnings that are more persistent or sustainable than their peers. In that context, the analyst should be aware of the empirically observed tendency of earnings at extreme levels to revert back to normal levels (mean reversion in earnings). The phenomenon has an economic explanation. Competitive markets (including the market for corporate control) tend to lead to correction of strategic or managerial problems causing poor performance; poorly performing businesses and segments tend to be abandoned. Subject to barriers to entry, capital migrates toward more profitable businesses and segments, increasing competition and reducing returns. The net effect of these competitive forces is to move earnings back to a “normal” level. Data analyzed by Nissim and Penman (2001) show that this pattern of mean reversion in earnings is very pervasive. Exhibit 16-4 summarizes the mean reverting behavior in return on net operating assets (RNOA) for a large sample of SEC registrants. Every year companies are sorted into ten equal groups and the average RNOAs for these ten portfolios are tracked over the next six years. There is a clear reversion back to a range between 8 and 20 percent by the end of six years.
EXHIBIT 16-4 Mean Reversion in Accounting Rates of Return (Return on Net Operating Assets)
Source: Reprinted from Review of Accounting Studies 6, no. 1, by Doron Nissim and Stephen Penman (March 2001), with kind permission of Springer Science and Business Media.
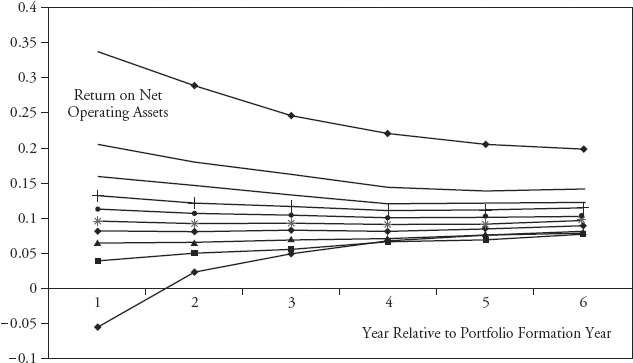
Understanding this reverting property of earnings is of fundamental importance for financial statement analysis. To build a meaningful forecast of future cash flows one should recognize that very low and very high earnings are not expected to continue into the future. Using information in accruals we can improve these forecasts of future cash flow further. As mentioned earlier, earnings have a cash flow and an accrual component. Algebraically, earnings are equal to cash flows plus accruals. When earnings are largely comprised of accruals, the evidence referenced in Section 2.1 suggests that future accounting rates of return and future cash flows would be lower. This is equivalent to saying that earnings will revert back to a normal level even quicker when earnings are largely comprised of accruals as opposed to cash flows. This is not surprising: The accrual component of earnings is where the accounting distortions are greatest and for which we expect there to be lower persistence.
In summary, earnings that are more persistent are viewed as higher quality. This decomposition of earnings into its accrual and cash flow components creates a superior forecast for future earnings and cash flows; furthermore, as already mentioned, earnings components that are less persistent should rationally receive a lower multiple in valuation. In a later section, we will walk through many examples of transactions that give rise to low quality earnings streams. One thing that is common to all of the examples of low earnings quality is the fact that current earnings are temporarily distorted relative to “true” earnings, due to various accounting choices, but cash flows are unaffected.
3.2. Measures of the Accrual Component of Earnings and Earnings Quality
In this section we lay out the framework for measuring the cash and accrual components of earnings using standardized financial statements. We explain various measures of the accrual component of earnings (the cash component being the remainder after subtracting the accrual component from reported earnings). Finally, we present scaled measures of accrual components as simple measures of earnings quality that working analysts can readily compute and use.
Exhibit 16-5 presents the three primary financial statements in standardized formats. The format selected is based on the one used by Compustat in processing the reported financials of companies trading in the United States, with simplifications.4 Using a standardized format has advantages in facilitating cross-sectional comparisons across companies.5 Note that “income before extraordinary items” is possible under U.S. Generally Accepted Accounting Principles (U.S. GAAP) but not under International Financial Reporting Standards (IFRS), and “minority interest” must appear in the equity section under IFRS but can be placed in liabilities, in the equity section, or in between according to U.S. GAAP (Compustat places it in liabilities).6 Making adjustments for such differences where required is part and parcel of analysts’ work.
EXHIBIT 16-5 Financial Statements (in a Standardized Format)
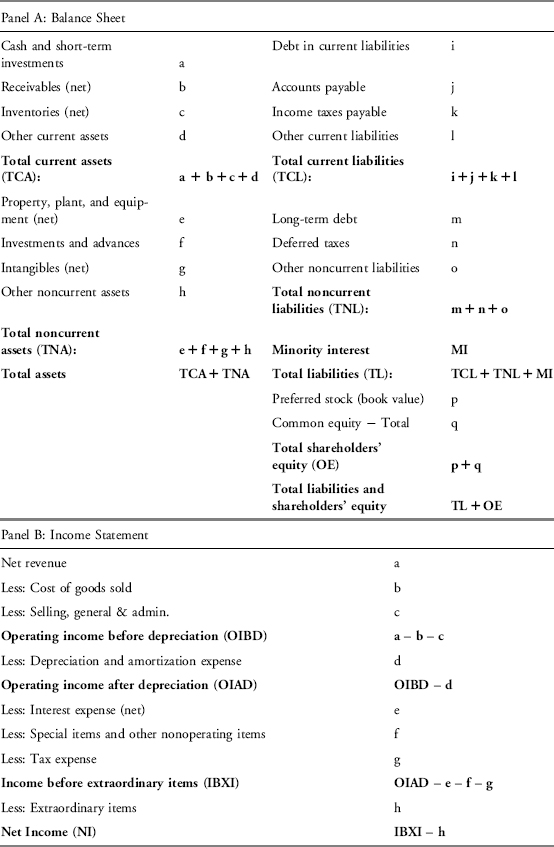
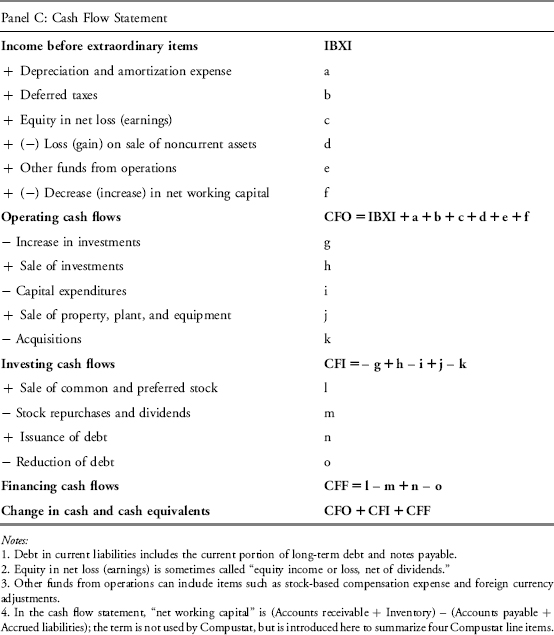
The financial statements presented earlier are based on an accrual accounting system. Other than cash, every line item in the balance sheet is the result of subjective choices surrounding recognition and valuation rules. For example: (1) Receivables are reported on a net basis after making a determination that a sale was made and those credit sales are to customers with sufficient capacity to make good on the amounts they owe; (2) Inventories are also reported on a net basis assuming that there is sufficient future sales demand to be able to sell these items at an amount greater than their historical cost. Similar explanations can be made for every other line item in the balance sheet. Considerable discretion resides throughout the accrual-based financial statements.
In contrast, financial statements based on a pure cash basis are devoid of this discretion: “cash is cash.” Absent fraud, there is no disputing ownership and the valuation of cash. Contrasting financial statements prepared on a cash basis with those prepared on an accrual basis is therefore a natural way to identify the extent of discretion embedded in the reported financial statements. Effectively, this amounts to comparing a pure change in cash measure of earnings with the reported earnings under the relevant set of accrual accounting principles (e.g., U.S. GAAP or IFRS). The difference is aggregate accruals or the accrual component of earnings:
There are several ways that we can decompose reported accrual earnings into a cash flow and accrual component. We can focus on information in the balance sheet, or we can focus on information in the statement of cash flows. We prefer the latter approach because it generates a cleaner measure that is free from the effects of noncash acquisitions and foreign currency translation adjustment effects. We now outline the two approaches to this decomposition of accruals and the definition of a quantity (“accrual ratio”) for comparing accruals across companies or for one company over time.
First, using balance sheet data, we can measure the net change across all noncash accounts to compute the aggregate accruals for that fiscal period. With the sample balance sheet reported earlier, aggregate accruals are simply the change in net assets (net of the cash and debt-related accounts) from the start to the end of the period. We first define net operating assets (NOA) as the difference between operating assets (total assets less cash) and operating liabilities (total liabilities less total debt):
We exclude cash (shorthand here for “cash and short-term investments”) and debt from our measure as these accounts are essentially discretion free. (This is not entirely true as there are some accounting accruals/deferrals embedded in debt, e.g., amortization of discounts/premium, but these can be ignored for our purposes here.)
From a balance sheet perspective, we measure aggregate accruals for period t as the change in NOA over the period:
We can call the measure presented in Equation 16.3 balance-sheet-based aggregate accruals. To adapt the measure as an indicator of earnings quality, it must be made comparable across companies by adjusting for differences in company size. An easy way to do the adjustment is to deflate (i.e., scale) the aggregate accrual measure by the average value of NOA. If one just used the opening or ending value of NOA as the scaling quantity, the ratio would be distorted by companies that have experienced significant growth or contractions during the fiscal period. The scaled measure (which we can call the balance-sheet-based accruals ratio) is our first measure of financial reporting quality and given by
The accruals measures defined in Equations 16.3 and 16.4 involve the summation of all of the line items of the balance sheet. If you are interested in subcomponents of accrual activity, then simply focus on the relevant line item from the balance sheet. For example, looking at the change in net receivables over a fiscal period deflated by average NOA will give you a sense of the magnitude of accrued revenue attributable to net credit sales.
We can also look at the statement of cash flows. For this approach we are looking at the difference between reported accrual earnings and the cash flows attributable to operating and investing activities. From a cash flow statement perspective, a measure of aggregate accruals can be defined as follows:7
We can call this cash-flow-statement-based aggregate accruals. The corresponding scaled measure (cash-flow-statement-based accruals ratio) is our second simple measure of financial reporting quality:
The measures in Equations 16.5 and 16.6 aggregate all of the operating and investing activities and their impact on cash flows relative to accrued earnings. The result is a cash-flow-statement-based measure of aggregate accruals. The inclusion of the cash flow from investing activities (CFIt) in Equations 16.5 and 16.6 may require explanation. From a valuation perspective, there are essentially only two sides to the company: the operating side (broadly conceived) and the financing side. However, the cash flow statement splits the operating side into “operating” and “investing” pieces (roughly, current and noncurrent operating pieces). When calculating a broad accruals ratio, the appropriate treatment is to include both cash flow pieces (CFO and CFI). In applying Equations 16.5 and 16.6, the analyst should make any needed adjustments for differences in the cash flow statement treatment of interest and dividends across companies being examined.8 These adjustments ensure consistency in the treatment of operating and financing activities. For example, if Company A treats interest paid as an operating cash outflow (under U.S. GAAP) and Company B treats interest paid as a financing cash flow (under IFRS), the systematic differences in leverage across the two companies could create significant differences in a computed aggregate accrual measure. Treating interest paid consistently across the companies (e.g., as a financing cash outflow) will mitigate this problem.
Example 16-1 illustrates the calculation of the ratios for an actual company.
EXAMPLE 16-1 The Coca-Cola Company: An Illustration of Accrual Analysis
Recent financial statements for the Coca-Cola Company (NYSE: KO) have been put in the format of Exhibit 16-5.9
The Coca-Cola Company Financial Statements in Standardized Format Year Ended 31 December (Amounts in $Millions)
| Panel A: Balance Sheet | 2006 | 2005 |
| Cash and short-term investments | 2,590 | 4,767 |
| Receivables (net) | 2,587 | 2,281 |
| Inventories (net) | 1,641 | 1,424 |
| Other current assets | 1,623 | 1,778 |
| Total current assets | 8,441 | 10,250 |
| Property, plant, and equipment (net) | 6,903 | 5,786 |
| Investments and advances | 6,783 | 6,922 |
| Intangibles (net) | 5,135 | 3,821 |
| Other noncurrent assets | 2,701 | 2,648 |
| Total noncurrent assets | 21,522 | 19,177 |
| Total assets | 29,963 | 29,427 |
| Debt in current liabilities | 3,268 | 4,546 |
| Accounts payable | 929 | 2,315 |
| Income taxes payable | 567 | 797 |
| Other current liabilities | 4,126 | 2,178 |
| Total current liabilities | 8,890 | 9,836 |
| Long-term debt | 1,314 | 1,154 |
| Deferred taxes | 608 | 352 |
| Other noncurrent liabilities | 2,231 | 1,730 |
| Total noncurrent liabilities | 4,153 | 3,236 |
| Minority interest | 0 | 0 |
| Total liabilities | 13,043 | 13,072 |
| Preferred stock (book value) | 0 | 0 |
| Common equity − Total | 16,920 | 16,355 |
| Total shareholders’ equity | 16,920 | 16,355 |
| Total liabilities and shareholders’ equity | 29,963 | 29,427 |
| Panel B: Income Statement | 2006 | |
| Net revenue | 24,088 | |
| Less: Cost of goods sold | 7,358 | |
| Less: Selling, general & admin. expenses | 9,195 | |
| Operating income before depreciation | 7,535 | |
| Less: Depreciation and amortization expense | 938 | |
| Operating income after depreciation | 6,597 | |
| Less: Interest expense (net) | 220 | |
| Plus: Special items and other nonoperating items | 201 | |
| Less: Tax expense | 1,498 | |
| Income before extraordinary items | 5,080 | |
| Less: Extraordinary items | 0 | |
| Net income | 5,080 | |
| Panel C: Statement of Cash Flows | 2006 | |
| Income before extraordinary items | 5,080 | |
| + Depreciation and amortization expense | 938 | |
| + Deferred taxes | −35 | |
| + Equity in net loss (earnings) | 124 | |
| + (−) Loss (gain) on sale of noncurrent assets | −303 | |
| + Other funds from operations | 768 | |
| + (−) Decrease (increase) in net working capital | −615 | |
| Operating cash flows | 5,957 | |
| − Increase in investments | 1,045 | |
| + Sale of investments | 640 | |
| − Capital expenditures | 1,407 | |
| + Sale of property, plant, and equipment | 112 | |
| − Acquisitions | 0 | |
| Investing cash flows | −1,700 | |
| + Sale of common stock | 148 | |
| − Stock repurchases and dividends | 5,327 | |
| + Issuance of debt | 617 | |
| − Reduction of debt | 2,021 | |
| Financing cash flows | −6,583 | |
| Less: Exchange rate effects | 65 | |
| Change in cash and cash equivalents | −2,261 |
Based on the information given, address the following problems:
1. Calculate net operating assets for Coca-Cola for 2006 and 2005.
2. Calculate balance-sheet-based aggregate accruals for Coca-Cola for 2006.
3. Calculate the balance-sheet-based accruals ratio for Coca-Cola for 2006.
4. Calculate cash-flow-statement-based aggregate accruals for Coca-Cola for 2006.
5. Calculate the cash-flow-statement-based accruals ratio for Coca-Cola for 2006.
6. State and explain which of the measures calculated in Problems 1 through 5 would be appropriate to use in evaluating relative financial reporting quality of a group of companies.
Solutions to 1, 2, and 3: These are given in the worksheet here.
Balance Sheet Computation of Aggregate Accruals
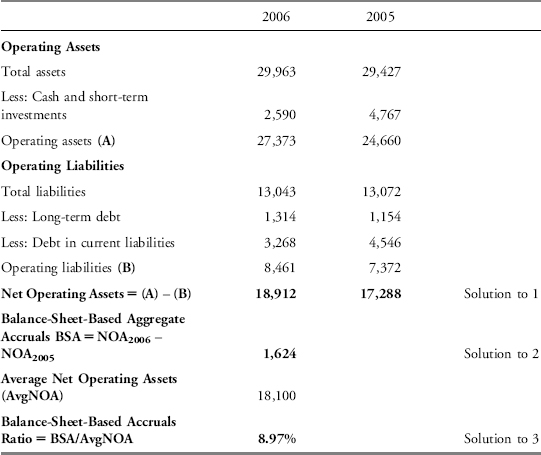
Problem 1: The amount of net operating assets is found as the difference between operating assets (total assets minus cash and short-term investments) and operating liabilities (total liabilities minus total debt). For 2005 and 2006, net operating assets amount to $17,288 million and $18,912 million, respectively.
Problem 2: The amount of balance-sheet-based aggregate accruals for 2006 is found as the change in net operating assets from 2005 to 2006. This amount is $1,624 million.
Problem 3: The balance-sheet-based accruals ratio for 2006 is found by dividing balance-sheet-based aggregate accruals for 2006, $1,624 million, by average net operating assets, (18,912+17,288)/2 = $18,100 million. This ratio is equal to 1,624/18,100 = 8.97 percent.
Solutions to 4 and 5: These are given in the worksheet here.
Cash Flow Statement Computation of Aggregate Accruals
| 2006 | ||
| Income before Extraordinary Items | 5,080 | |
| Less: Operating Cash Flows | 5,957 | |
| Less: Investing Cash Flows | −1,700 | |
| Cash-Flow-Statement-Based Aggregate Accruals (A) | 823 | Solution to 4 |
| Cash-Flow-Statement-Based Accruals Ratio = (A)/AvgNOA | 4.55% | Solution to 5 |
Note: AvgNOA is 18,100 (see previous worksheet).
Solution to 6: Among the measures presented in Problems 2 through 5, only the size-scaled measures calculated in Problems 3 and 5 are appropriate for cross-company comparisons. The unscaled measures in Problems 2 and 4 would be affected by differences in company size.
Consistent with the earlier discussion on the balance sheet approach to measuring accruals, we also could focus on current versus noncurrent accruals by looking only at the difference between reported income and operating cash flows for current accruals. It is important to note that while the two approaches (balance sheet and statement of cash flows) are conceptually equivalent, they will not generate the exact same numbers due to a combination of noncash acquisitions, currency translation, and inconsistent classification across the balance sheet and statement of cash flows. These differences, however, are typically small and can be ignored for our purpose. The typical correlation between a broad accrual measure based on balance sheet data with one based on statement of cash flow data is in excess of 0.80. The important thing to remember is to compare companies using the same method. If you prefer to use a balance sheet approach or a statement of cash flow approach, be sure to keep that method constant across companies. If you use different methods across companies, this will distort your comparison. But using one approach systematically will give a very similar rank ordering of companies as using the other approach systematically.
3.3. Applying the Simple Measures of Earnings Quality
The simple measures of earnings quality defined by Equations 16.4 and 16.6 are an effective way to partition companies into low and high earnings quality groups. Given the broad discretion afforded to management, it can be difficult to identify specifically which accrual or deferral was manipulated in a given fiscal period. Rather than attempt to measure discretion embedded within each accrual, an effective alternative is to focus on the aggregate. This aggregate measure will reflect the portfolio of discretion and its impact on income for a given fiscal period. In this section we give further examples to illustrate the measures. Example 16-2 compares two companies. In contrast to Example 16-1, the original account labels have been retained in the example.
EXAMPLE 16-2 A Quality-of-Earnings Comparison of Two Companies
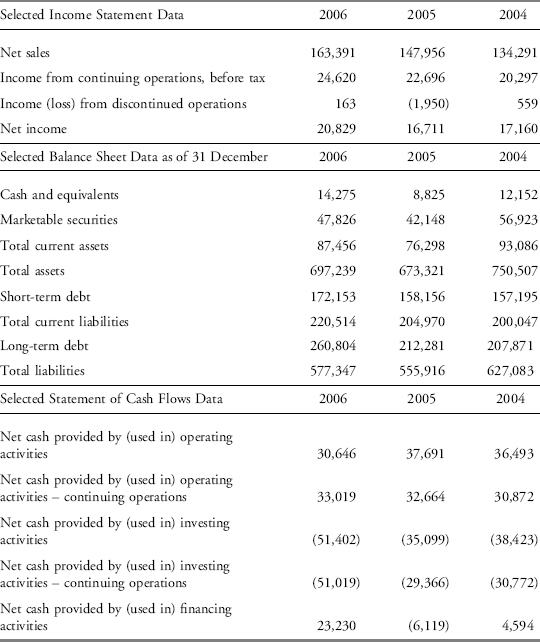
Siemens, AG is a global electronics and electrical engineering company headquartered in Munich, Germany. Selected data (in € millions) from Siemens’ financial statements for the years ended 30 September 2006, 2005, and 2004 are presented here.
Siemens, AG Fiscal Years Ended 30 September (€ in millions)
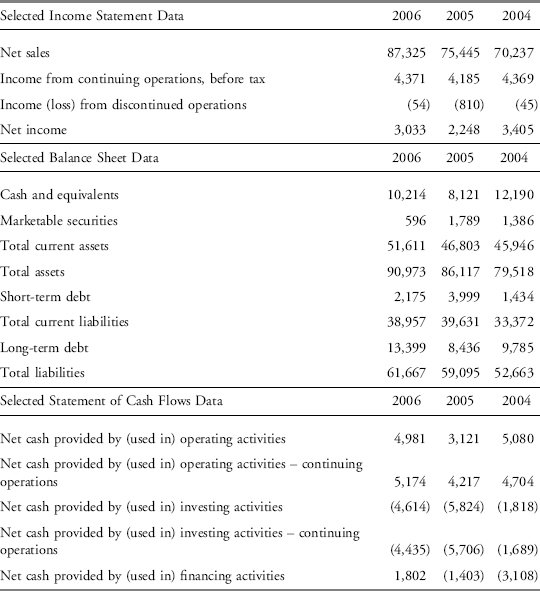
General Electric is a diversified global industrial corporation headquartered in Fairfield, Connecticut, USA. Selected data (in $ millions) from GE’s financial statements for the years ended 31 December 2006, 2005, and 2004 are presented here.
General Electric Company and Consolidated Affiliates, Years Ended 31 December (in Millions of $)
Based on the information given, address the following:
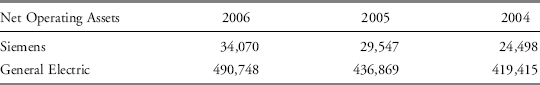
1. Calculate net operating assets for Siemens and GE for each year presented.
2. Calculate aggregate accruals using both the balance sheet and cash flow statement methods for Siemens and GE for each year presented.
3. Calculate the balance-sheet-based and cash-flow-statement-based accruals ratios for Siemens and GE for each year presented.
4. A. State and explain which company had higher earnings quality in 2005 and 2006.
B. Identify any trends in earnings quality for each company.
5. Would the results of question 4 be different if the accruals ratios were calculated based only on continuing operations?
6. General Electric recorded net financing receivables of $334,232 in 2006 and $292,639 in 2005. It describes these receivables in the notes to its financial statements as largely relating to direct financing leases. Evaluate this disclosure with respect to GE’s earnings quality.
Solution to 1: Net operating assets is defined as (total assets − cash and marketable securities) − (total liabilities − total debt). For example, in 2006 Siemens reported total assets of 90,973 and cash and marketable securities of 10,214+596 = 10,810. Total liabilities were 61,667 and total debt was 2,175+13,399 = 15,574. (90,973 − 10,810) − (61,667 − 15,574) = 80,163 − 46,093 = 34,070. The values for each firm are summarized on the following page.
Solution to 2: Balance sheet aggregate accruals are defined as the change in net operating assets. As such, only two years’ worth of accruals can be calculated from the data given. For example, for Siemens, using the answers to Problem 1, balance sheet aggregate accruals for 2006 equal €34,070 − €29,547 = €4,523.
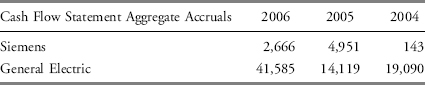
| Balance Sheet Aggregate Accruals | 2006 | 2005 |
| Siemens | 4,523 | 5,049 |
| General Electric | 53,879 | 17,454 |
Cash flow statement aggregate accruals are defined as net income − (cash flows from operating activity+cash flows from investing activity). For example, for Siemens in 2006, cash flow statement aggregate accruals are found as NI of €3,033 minus [CFO of €4,981+(CFI of −€4,614)] = €3,033 minus €367 = €2,666.
Solution to 3: The accrual ratio is defined as aggregate accruals divided by average net operating assets. Because the denominator requires an average of two years’ data, only two years of accrual ratios can be calculated. For example, for Siemens, average net operating assets for 2006 were (€34,070+€29,547)/2 = €31,808.5. With aggregate accruals for 2006 of €4,523 and €2,666 by the balance sheet and cash flow statement methods, respectively, the corresponding accrual ratios were €4,523/€31,808.5 = 14.2 percent and €2,666/€31,808.5 = 8.4 percent.
| Balance-Sheet-Based Accrual Ratio | 2006 (%) | 2005 (%) |
| Siemens | 14.2 | 18.7 |
| General Electric | 11.6 | 4.1 |
| Cash-Flow-Statement-Based Accrual Ratio | 2006 (%) | 2005 (%) |
| Siemens | 8.4 | 18.3 |
| General Electric | 9.0 | 3.3 |
Solution to 4:
A. Using the balance-sheet-based accrual ratio, General Electric has higher earnings quality (i.e., lower accruals ratio) in both years. Using the cash-flow-statement-based measure, GE actually shows lower earnings quality than Siemens only in 2006.
B. Using either earnings quality measure, Siemens shows improving earnings quality from 2005 to 2006, while GE shows deteriorating earnings quality.
Solution to 5: Subtracting the results of discontinued operations from net income and using the cash flow data from continuing operations, the results of the calculations are:
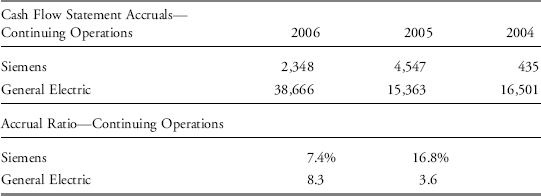
Using continuing operations does not significantly alter either the level or trends in accruals for these companies.
Solution to 6: The $41,593 million change in financing receivables accounts for a large portion of GE’s $53,879 million change in net operating assets. Compared to treating the leases as operating leases (see the reading on long-term liabilities), accounting for leases as direct financing leases increases net income in the early years of a lease but the same total net income is recognized over the lease life. Under direct financing lease accounting, operating cash flow is lower, but investing cash flows are higher. When considering the cash versus accrual portions of earnings, this disclosure allows us to conclude that GE’s 2006 earnings are likely less persistent (of lower quality) than its 2005 earnings.
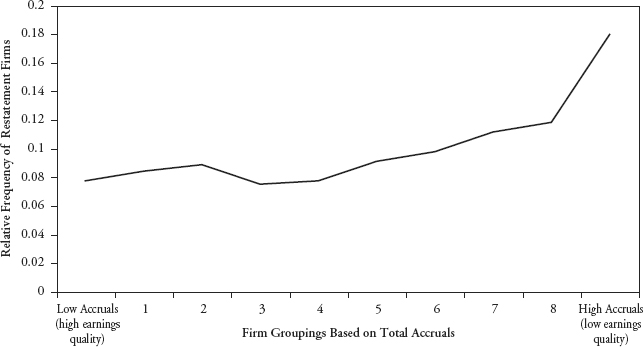
Broad measures of aggregate accruals are quite effective in identifying companies with financial reporting quality issues. Using a broad sample of earnings restatements from 1979 through 2002, Richardson, Tuna, and Wu (2002) found strong evidence that these restatements are concentrated in companies reporting the highest level of total accruals. Exhibit 16-6 summarizes these findings. Every year, SEC registrants are sorted into ten equal-sized groups based on the magnitude of total accruals, using the statement of cash flow definition (Equation 16.6). Exhibit 16-6 reports the relative frequency of earnings restatements across these ten equal-sized groups. The upward sloping line is quite telling: Of the 440 earnings restatements examined, there is a concentration in the highest accrual group (low earnings quality). Specifically, for the lowest accrual group (high earnings quality) only 7.5 percent of the 440 restatements are to be found, but in the highest accrual group we see 18 percent of the 440 restatement companies.
EXHIBIT 16-6 Relative Frequency of Earnings Restatements as a Function of Aggregate Accruals
Source: Richardson, Tuna, and Wu (2002).
This ability to discriminate restatement companies from nonrestatement companies is beneficial to analysts looking to avoid significant “torpedoes” in their portfolios. This clearly can be seen in Exhibit 16-7. In this exhibit we plot the cumulative equity returns for the 440 earnings restatement companies examined previous. We cumulate stock returns for 120 trading days either side of the first press release describing the earnings announcement (i.e., the “0” point on the horizontal axis corresponds to the announcement date). There is a marked decrease in market value around this announcement. For the average company in that group, the loss of market value in the few days surrounding the announcement of the restatement is around 10 percent. Having information ahead of time as to the likelihood of a restatement is clearly of value to the equity investor. The earlier analysis demonstrates just that: Broad accrual measures are effective in identifying egregious accounting irregularities of the type that precipitate earnings restatements. Importantly, these measures identify such companies well ahead of the restatement announcement. For the 440 restatement companies examined, the announcement date is (on average) more than one year after the fiscal year during which the alleged manipulation occurred.
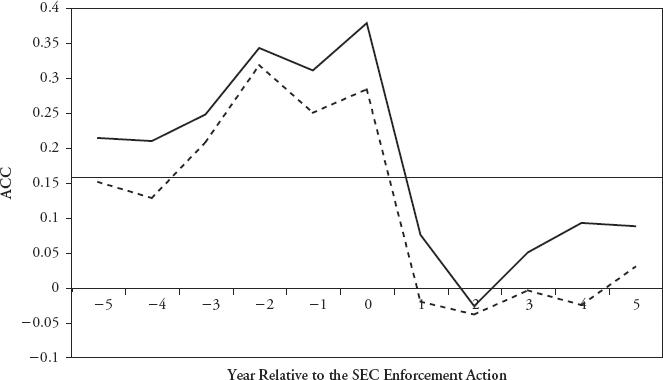
To make this point even more clear, research also has shown that broad measures of accruals are also leading indicators of SEC enforcement actions. Exhibit 16-8 reports aggregate accruals for companies subject to SEC enforcement actions. (The measure used [ACC] is the same as what we have called the balance-sheet-based accruals ratio in this reading.) Aggregate accruals are tracked for five years on either side of the period of alleged manipulation giving rise to the enforcement action. The bold (hatched) line reports the average (median) aggregate accruals for the SEC enforcement action sample. For comparison purposes the horizontal line shows the aggregate accruals for the average listed company (a little over 15 percent). Note the clear pattern for companies subject to enforcement actions from the SEC: The accrual measure peaks at between 30 and 35 percent in the two years prior to the SEC enforcement action.
EXHIBIT 16-7 Cumulative Abnormal Returns around Earnings Restatements
Source: Richardson, Tuna, and Wu (2002).
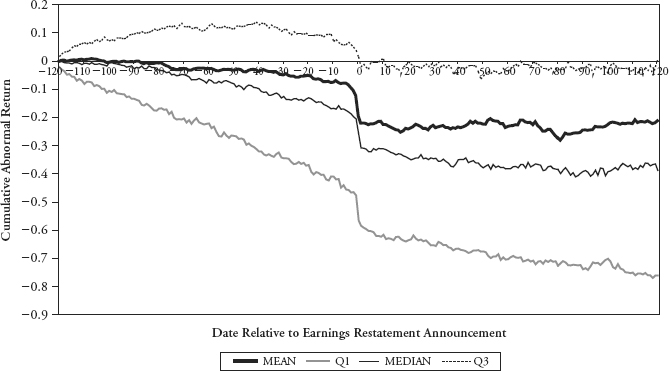
EXHIBIT 16-8 Aggregate Accruals (ACC) around SEC Enforcement Action
Source: Richardson, Sloan, Soliman, and Tuna (2006).
It is important to note that while this broad approach does not tell us which accruals were used as part of that manipulation, it is effective at summarizing all sources of accruals that were used to achieve an earnings target. More detailed analysis focusing on components of total accruals that are particularly germane to a given sector is likely to generate even more effective discriminatory power to identify earnings restatements. Some examples include focusing on the unearned revenue accounts in the software industry, claim loss development reserves in the insurance industry, loan loss provisions for financial institutions, fair value adjustments for complicated derivative instruments held by financial institutions, inventory adjustments for manufacturing companies, etc.
In the next section we focus on the various component accruals (e.g., provision for doubtful accounts, depreciation choices, unearned revenue, inventory obsolescence, etc.) that drive the aggregate accrual measures we have discussed so far.
4. A FRAMEWORK FOR IDENTIFYING LOW-QUALITY FINANCIAL REPORTING
This section focuses on specific approaches and measures used to quantify financial reporting quality. This framework builds on a sound understanding of the key risk and success factors facing the company. As with any quantitative analysis, the quality of the output depends on the quality of inputs and on a structured analysis of those inputs. Furthermore, the relevance of the reporting quality measures we will discuss (1) varies across companies and (2) can vary through time for a given company. As examples of Point 1, measures related to inventory are particularly relevant for retail and manufacturing companies, measures relating to depreciation choices are particularly relevant for capital intensive companies, and measures relating to off-balance sheet financing vehicles are especially relevant for financial institutions or entities with linked financial subsidiaries. As an example of Point 2, it is often easier for management of a company to “hide” their use of discretion in periods of growth. Consequently, the most effective way to utilize the quantitative measures discussed later is through a combination of peer group comparison and year-over-year changes. Sector neutralizing measures of financial reporting quality—by subtracting the mean or median ratio for a given sector group from a given company’s ratio—are particularly useful in identifying companies with extreme good or poor quality. However, the degree of homogeneity within a sector or industry group may vary, so supplementing this kind of analysis with information on how the company itself has changed through time can help mitigate any heterogeneity. The company may change through time via divestitures, acquisitions, and changes in strategy. Such changes need to be kept in mind so you have a comparison that is as close to “apples to apples” as possible. Finally, as with any ratio analysis, the analyst should work with standardized financial statements so companies of different sizes are comparable. This is easily achieved by dividing a flow measure from the income statement or statement of cash flows by a measure from the balance sheet such as average total assets.
As we work through the various line items of the financial statements following, it is important to keep in mind the link between the primary financial statements. If there is an issue to be measured in the context of revenues or expenses, there will be an associated implication on the net assets reported in the balance sheet. To keep the sections manageable, we have focused on revenue and expense quality issues. We could easily have included a complete asset and liability section as well, but this would be the flip side of a combination of the revenue and expense items. For example, discussion on the unearned revenue account, which typically appears as part of other current liabilities on the balance sheet, is subsumed by the discussion of revenue recognition. Therefore, instead of repeating our discussion, we highlight the relevant asset and liability accounts associated with the respective revenue and expense accounts.
4.1. Revenue Recognition Issues
Misstating current revenue, recognizing revenue early, or classifying nonoperating income or gains as resulting from operating activities can make current operating performance appear better than it actually is—generally impairing the persistence or sustainability of reported earnings. The following sections highlight the major types of revenue recognition issues.
4.1.1. Revenue Misstatement
This section focuses on the discretion available when reporting revenue. Revenue can be over- or understated for a given period. Examples of overstatement include recording smaller provisions for doubtful accounts and warranty provisions. Examples of understatement include recording opportunistic use of unearned revenue. We will discuss these in turn.
4.1.1.1. The Range of Problems
Revenue accounting is one of the simplest, yet most challenging aspects of interpreting financial statements. As described in Section 2, accrual accounting records revenue not when cash is collected, but when a good or service has been provided to the customer. Total revenue reported in a given fiscal period is equal to the cash collected from customers plus the increase in net accounts receivable less the increase in unearned revenue (unearned revenue or deferred revenue is payment received in advance of providing a good or service). Receivables capture credit sales made in the past that as yet have not been collected. While companies have to report these receivables on a net basis by making a best guess as to what will become uncollectible, there is considerable discretion in determining the amount that is expected to be uncollectible. Likewise, unearned revenue contains discretion. The existence of this account typically lowers the reported revenue relative to cash received in the current period. But note that unearned revenues from prior fiscal periods can be used to create revenue in the current fiscal period. For example, if a company collected cash in 2006 for services to be provided over several periods the appropriate treatment is to record that cash collection as a liability in 2006. During future periods a determination has to be made as to whether the services have in fact been provided. Oftentimes there is discretion in deciding when a service has been provided, especially for software companies where the service and licensing agreements are typically bundled together. Related to estimates about credit sales and unearned revenue, companies also must estimate warranty provisions, and sales returns and allowances. The net effect of all of these estimates is the single line item, total revenue, reported at the top of the income statement. Collectively, the discretion embedded in the revenue line item is the culprit for the majority of earnings restatements, fraud cases, and related SEC enforcement actions (Huron Consulting reports that the main driver of earnings restatements in recent years is revenue recognition issues).
4.1.1.2. Warning Signs
To detect quality issues with reported revenues, it is best to focus on the balance sheet accounts associated with revenue (accounts receivable and unearned revenue). Large changes in these accounts should be viewed as “red flag” indicators of revenue quality issues. Specifically, large increases in accounts receivable or large decreases in unearned revenue are indicators of low-quality revenue. Companies reporting earnings where a large portion of the revenue is attributable to growth in receivables or a contraction in unearned revenue, on average report lower accounting rates of return and cash flows in the future, and these earnings reversals are not anticipated in a timely fashion by the stock market.10
We can use the example of Microsoft to illustrate various revenue recognition issues. In Exhibit 16-9 we see the balance sheet for the 30 June 2007 fiscal year for Microsoft.
EXHIBIT 16.9 Microsoft Corporation Balance Sheets, Fiscal Year Ended 30 June 2007 and 30 June 2006 (in $ Millions)
Note: Italics added by authors.
| 30 June | 2007 | 2006 |
| Assets | ||
| Current assets: | ||
| Cash and equivalents | $ 6,111 | $ 6,714 |
| Short-term investments (including securities pledged as collateral of $2,356 and $3,065) | 17,300 | 27,447 |
| Total cash and short-term investments | 23,411 | 34,161 |
| Accounts receivable, net of allowance for doubtful accounts of $117 and $142 | 11,338 | 9,316 |
| Inventories | 1,127 | 1,478 |
| Deferred income taxes | 1,899 | 1,940 |
| Other | 2,393 | 2,115 |
| Total current assets | 40,168 | 49,010 |
| Property and equipment, net | 4,350 | 3,044 |
| Equity and other investments | 10,117 | 9,232 |
| Goodwill | 4,760 | 3,866 |
| Intangible assets, net | 878 | 539 |
| Deferred income taxes | 1,389 | 2,611 |
| Other long-term assets | 1,509 | 1,295 |
| Total assets | $63,171 | $69,597 |
| Liabilities and stockholders’ equity | ||
| Current liabilities: | ||
| Accounts payable | $ 3,247 | $ 2,909 |
| Accrued compensation | 2,325 | 1,938 |
| Income taxes | 1,040 | 1,557 |
| Short-term unearned revenue | 10,779 | 9,138 |
| Securities lending payable | 2,741 | 3,117 |
| Other | 3,622 | 3,783 |
| Total current liabilities | 23,754 | 22,442 |
| Long-term unearned revenue | 1,867 | 1,764 |
| Other long-term liabilities | 6,453 | 5,287 |
| Commitments and contingencies | ||
| Stockholders’ equity: | ||
| Common stock and paid-in capital − shares authorized 24,000; outstanding 9,380 and 10,062 | 60,557 | 59,005 |
| Retained deficit, including accumulated other comprehensive income of $1,654 and $1,229 | (29,460) | (18,901) |
| Total stockholders’ equity | 31,097 | 40,104 |
| Total liabilities and stockholders’ equity | $63,171 | $69,597 |
There is a roughly $1.6 billion increase in the short-term unearned revenue account (the opening balance is $9.138 billion and the closing balance is $10.779 billion, creating a positive change of $1.641 billion), and a roughly $0.1 billion increase in the long-term unearned revenue account (the opening balance is $1.764 billion and the closing balance is $1.867 billion, creating a positive change of $0.103 billion). There is also a roughly $2 billion increase in gross accounts receivable11 (the opening balance is $9.458 billion and the closing balance is $11.455 billion, creating a positive change of $1.997 billion). Write-offs will reduce the gross accounts receivable balance but do not reflect cash collection. In the absence of footnote information, we can infer a $0.025 billion write-off from the decrease in the allowance for doubtful accounts. To place these magnitudes in context, Microsoft reported revenue of $51.122 billion and net income of $14.065 billion for the fiscal period. The difference between revenue and cash collected from customers can be computed by aggregating the changes in accounts receivable and unearned revenue accounts as follows:
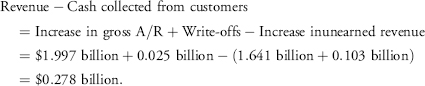
The net effect of the increase in receivables, write-offs, and increase in unearned revenue is to report revenue greater by $0.278 billion relative to cash collected from customers. The magnitude of the absolute changes in these accounts is over $3.5 billion, suggesting that Microsoft has considerable flexibility in reporting revenue in a given fiscal period. For example, the unearned revenue account could be built up in periods of strong growth as customers prepay for services, and tapped into when times are tough. In effect, with the unearned revenue account, Microsoft has flexibility to be strategic as to when it chooses to recognize revenue. Note that few companies disclose unearned revenue separately in the financial statements; however, this information can often be found in supplemental footnote disclosures to the financial statements.
To place the accrual items described earlier (change in accounts receivable and change in unearned revenue) in context, we can express these changes as a fraction of average net operating assets. For the year ended 30 June 2007, Microsoft reports in millions of dollars: opening (closing) total assets of $69,597 ($63,171), opening (closing) cash and short-term investments of $34,161 ($23,411), opening (closing) total liabilities of $29,493 ($32,074), and opening (closing) total debt of $0 ($0). Using the balance-sheet-based accruals ratio described in Equation 16.4, we can compute aggregate accruals as follows:
| 2007 | 2006 | |
| Operating Assets | ||
| Total assets | 63,171 | 69,597 |
| Less: Cash and short-term investments | 23,411 | 34,161 |
| Operating assets (OA) | 39,760 | 35,436 |
| Operating Liabilities | ||
| Total liabilities | 32,074 | 29,493 |
| Less: Long-term debt | 0 | 0 |
| Less: Debt in current liabilities | 0 | 0 |
| Operating liabilities (OL) | 32,074 | 29,493 |
| Net Operating Assets NOA = OA − OL | 7,686 | 5,943 |
| Balance-sheet-based aggregate accruals (= NOA[2007] − NOA[2006]) | 1,743 | |
| Average Net Operating Assets | 6,814.5 | |
| Balance-Sheet-Based Accruals Ratio (= 1,743/6,814.5) | 25.58% |
The revenue-related accruals in accounts receivable and unearned revenue, calculated as the increase in gross accounts receivable plus write-offs minus the increase in unearned revenue, total $278 million, which accounts for about 16 percent of the total accruals ($278 million/$1,743 million) for the 2007 fiscal year. There are other ways to use this information to make statements about earnings quality. For example, measures of days’ sales outstanding (DSO) are useful to inform about revenue quality. DSO is simply the ratio of net accounts receivable divided by total revenue multiplied by 365. This ratio gives a sense for how quickly the company is able to convert its credit sales into cash. Increases in this ratio are a red flag for questionable credit sales that take longer to convert into cash. Of course, in assessing this ratio, one should be careful to see if the company’s credit policy or product mix has changed substantially, or whether the company has securitized or factored its receivables (this leads to a dramatic lowering of DSO, which is not sustainable). If you notice that a company has securitized a large portion of its receivables, then do not treat the accompanying improvement in DSO as a signal of improving earnings quality because it is a one-off occurrence. For example, Federated Stores sold its credit card business in 2005, effectively lowering its DSO ratio to zero.
4.1.2. Accelerating Revenue
In addition to the issues described previously relating to credit sales and unearned revenue, there is also considerable discretion as to when a sale has been made. The issue here is deciding in which fiscal period revenue should be recognized.
4.1.2.1. The Range of Problems
Related to the discussion in Section 4.1.1, revenue is recognized when a good is “delivered” to the customer or a service has been performed. There is considerable discretion as to when the transaction is deemed to have taken place. It is easy to understand the incentives of salespeople who are struggling to meet internal targets toward the end of the fiscal period: To sell as much as possible as the period ends, e.g., by lowering credit standards or by moving sales from the next period to the current fiscal period. This latter option is acceptable as long as the sale has been made, i.e., the good has been delivered and/or the service has been provided. For companies that provide goods or services where it is sometimes difficult to assess the completion of the revenue-generating process (i.e., the delivery of the good or the provision of service), there is the potential for these companies to accelerate the recognition of revenue by reporting revenue in the current period that should be reported in a future period. Companies that provide goods and services as bundled products are a classic example where there may be opportunity for the acceleration of revenues. Consider a company selling computer software licenses with a multiperiod service agreement. The revenue associated with the provision of that service component of the software license should not be recognized at point of sale but at the time the service is provided to the customer. For example, consider a software provider that sells desktop applications in bulk to large corporations on 1 November 2007. This contract comes with built-in options to upgrade and extensive product support for the next two years. A determination needs to be made to allocate the revenue associated with this software sale over the 2007, 2008, and 2009 fiscal periods.
4.1.2.2. Warning Signs
The analyst needs to be particularly skeptical about revenue reporting practices when
- Top management has a significant portion of vested options in the money.
- The company is trying to maintain its track record of successively meeting analyst forecasts.
- The company is looking to raise additional financing.
These are risk factors in the sense of describing circumstances that can provide incentives for accelerating the recognition of revenue.
The warning signs for accelerated revenue are similar to what was described for over-stated revenue: Look for large positive changes in net accounts receivable and large decreases in unearned revenue accounts (to the extent these are separately disclosed). A large increase in accounts receivable could indicate credit sales made late in the fiscal period with associated deteriorations in credit quality. Large decreases in unearned revenue could be indicative of management’s aggressive determination that prior goods and services have been delivered/provided in the current fiscal period. Combining an analysis of the accrual activity in revenue-related accounts with the current market environment (e.g., pressing need to meet analyst forecasts or extensive outstanding vested options for top executives) can be an effective way to identify companies who have the incentive to be aggressive in the timing of revenue recognition and who have utilized accrual accounting choices to deliver revenue growth.
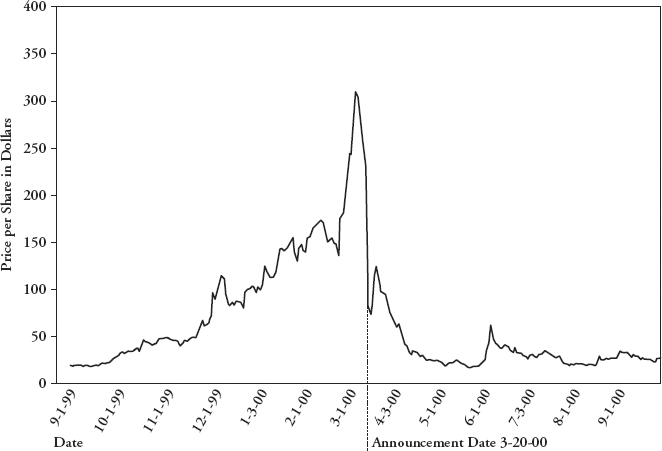
A good example is Microstrategy. Exhibit 16-10 outlines the evolution of Microstrategy’s stock price for the 1999–2000 period. Microstrategy announced that it would be restating its earnings in March 2000. They had accelerated the recognition of revenue by booking legitimate future sales orders in the current fiscal period. At first glance this does not seem particularly egregious: after all, these would have been legitimate sales. But placed in the context of significant capital market pressures, where analysts and investors generally were looking for exponential sales growth to support very lofty stock prices, the front-loading of revenues allowed Microstrategy to report very large revenue increases over the 1998–1999 period, fueling the stock price appreciation during 1999. When investors learned that this revenue growth was the result of front-loading future sales, there was a very quick correction in the market. There are numerous other cases of companies accelerating revenue recognition. A skeptical view on receivable growth and changes in unearned revenue, combined with an assessment of incentives to manipulate earnings, can help identify these companies before the stock price collapses.
EXHIBIT 16-10 Daily Stock Prices for Microstrategy 1 September 1999–29 September 2000
Note: Stock prices have been adjusted to account for the 26 January 2000 2:1 stock split.
Source: GAO (2002), Figure 18, based on the GAO’s analysis of NYSE TAQ data.
One way to detect acceleration of revenue recognition is to analyze the ratio of revenue to cash collected from customers. Cash collected from customers can be computed as revenue+decrease (minus increase) in accounts receivable+increase (minus decrease) in deferred income (or “deferred revenue”). In normal circumstances, the relation between revenue and cash collected from customers should be relatively stable. Large swings in revenue as a percent of cash collected from customers could occur for several reasons including the acceleration of revenue. Reported revenue as a percent of cash collected from customers would be expected to initially increase as the aggressive revenue recognition is adopted. Example 16-3 illustrates one technique of revenue acceleration: bill-and-hold sales.
EXAMPLE 16-3 Revenue Recognition Practices
Diebold, Inc. (NYSE: DBD) is a leading manufacturer of Automated Teller Machines (ATMs) used in banks, as well as electronic voting machines. Certain of Diebold’s financial results for the years ended 31 December 2006, 2005 and 2004 are summarized as follows:
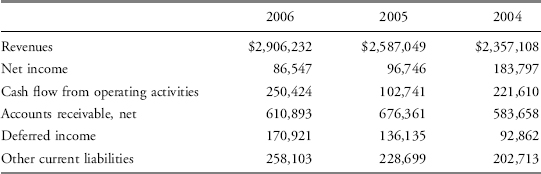
In its 2006 Annual Report, Diebold described its revenue recognition practice as follows:
1. The company considers revenue to be realized or realizable and earned when the following revenue recognition requirements are met: persuasive evidence of an arrangement exists, which is a customer contract; the products or services have been provided to the customer; the sales price is fixed or determinable within the contract; and collectability is probable. (From the Notes to the Financial Statements)
2. Revenue is recognized only after the earnings process is complete. For product sales, the company determines that the earnings process is complete when the customer has assumed risk of loss of the goods sold and all performance requirements are substantially complete. (From the Management Discussion and Analysis)
On 25 July 2007, Diebold announced it would be delaying the release of its earnings for the second quarter due to regulatory questions about the way it reports revenue. The stock had closed on 24 July at $53.71 per share.
On 2 October 2007, Diebold Inc. issued a press release titled “Diebold Provides Update on Revenue Recognition Practice.”
Diebold, Incorporated has been engaged in an ongoing discussion with the Office of the Chief Accountant (OCA) of the Securities and Exchange Commission (SEC) regarding the company’s practice of recognizing certain revenue on a “bill and hold” basis within its North America business segment. As a result of these discussions, Diebold will discontinue the use of bill and hold as a method of revenue recognition in both its North America and international businesses.. . .
The change in the company’s revenue recognition practice, and the potential amendment of prior financial statements, would only affect the timing of recognition of certain revenue. While the percentage of the company’s global bill and hold revenue varied from period to period, it represented 11 percent of Diebold’s total consolidated revenue in 2006. The company does not anticipate that the change in the timing of revenue recognition would impact previously reported cash provided by operating activities or the company’s net cash position.. . .
While the company cannot predict with certainty the length of time it will take to complete this analysis and review, it anticipates the process will take at least 30 days. Upon completing this process, Diebold will be in a position to provide updated revenue and earnings guidance for the full-year 2007.
That day, shares continued a slide that had begun with the announced delay, reaching $44.50. As of late 2007, the stock had fallen more than 20 percent since the initial announcement.
In a document titled “Report Pursuant to Section 704 of the Sarbanes–Oxley Act of 2002,” the U.S. Securities and Exchange Commission noted that:
Improper accounting for bill-and-hold transactions usually involves the recording of revenue from a sale, even though the customer has not taken title of the product and assumed the risks and rewards of ownership of the products specified in the customer’s purchase order or sales agreement. In a typical bill-and-hold transaction, the seller does not ship the product or ships it to a delivery site other than the customer’s site. These transactions may be recognized legitimately under GAAP when special criteria are met, including being done pursuant to the buyer’s request.
Based on the information given, address the following problems:
1. State whether bill-and-hold sales are consistent with the revenue recognition practices described in Diebold’s Annual Report. Explain your response.
2. Describe the incentives for recording revenue on a bill and hold basis.
3. The SEC report notes that bill and hold sales may be appropriate when done at the customer’s request. Explain a circumstance in which a customer may choose to be billed for a product that has not been delivered.
4. Critique the argument in the press release of 2 October 2007 that “the change in the company’s revenue recognition practice, and the potential amendment of prior financial statements, would only affect the timing of recognition of certain revenue.”
5. Describe a warning sign that might alert investors to the presence of improper bill and hold accounting. Illustrate the warning sign for the case of Diebold.
Solution to 1: No, they are not consistent. Diebold says it recognizes revenue only after “the products or services have been provided to a customer.” In a bill and hold transaction, “the seller does not ship the product or ships it to a delivery site other than the customer’s site.”
Solution to 2: Incentives include meeting revenue growth expectations or prior company guidance on revenue growth. Investors may reward positive “surprises” in revenues (revenue in excess of expected revenue) with a higher stock price. Conversely, disappointing news with respect to revenue targets may result in stock price declines. Thus, meeting or exceeding revenue growth expectations can help support the stock price. Furthermore, individual employees may have bonuses that depend in part upon their ability to meet certain sales targets in a given period, creating another incentive to recognize revenue on a bill and hold basis.
In Diebold’s case, it is possible that nearly all of the 12.3 percent growth in revenues was provided by the 11 percent of revenue recorded on a bill-and-hold basis. The accounting for the bill-and-hold transaction was not adequately disclosed in the financial statements, and thus it is no surprise that the practice drew negative attention from regulators.
Solution to 3: Customers may also have incentives to “time” their expenditures. For example, they might have provided their own investors with an indication of how much they planned to invest in new capital and may request that some equipment be provided on a bill-and-hold basis in order to meet that guidance. Alternatively, department heads may want to spend any remaining money in their budget at fiscal year-end to avoid budget cuts the following year, and not be particularly concerned about taking possession at the time of purchase. Another reason could be that the seller offers discounts if the buyer “requests” bill and hold.
Solution to 4: The statement is correct in that the bill and hold revenue recognition involves the timing of revenue recognition. However, the statement is incomplete in not pointing out that the effect of bill and hold sales is to speed up the recognition of revenue and often to distort the revenue growth rate in a manner that is temporarily favorable to the company.
Solution to 5: The first sign could come from comparing revenue to cash collections from customers. For Diebold, the calculations for 2005 and 2006 are as follows:
| 2006 | 2005 | |
| Revenue | $2,906,232 | $2,587,049 |
| Plus decrease (increase) in accounts receivable | 65,468 | (92,703) |
| Plus increase in deferred income | 34,786 | 43,273 |
| Equals cash collected from customers | $3,006,486 | $2,537,619 |
| Revenue/Cash collected from customers | 96.7% | 101.9% |
In normal circumstances, the relationship between revenue and cash collected from customers would be expected to remain relatively stable. In Diebold’s case, there was a 6.1 percent decrease from 2005 to 2006. In particular, the large increase in accounts receivable in 2005 provided a warning sign more than one year in advance of the restatement. As noted earlier, increases in accounts receivable capture aggressive accruals related to revenue recognition.
The net profit margin declined from 7.8 percent in 2004 to 3.7 percent in 2005 and 3.0 percent in 2006. The declining profitability could have been a signal that the company was pricing aggressively for customers willing to accept early billing. At the same time, the deferred income rose by 84 percent between 2004 and 2006 while sales grew just 23 percent.
Taking a more holistic approach to analysis, investors should also have been skeptical of the company’s accounting practices on the basis of past infractions. The SEC lawsuit that led to the change was disclosed in the 10-Q filed in August 2006.
4.1.3. Classification of Nonrecurring or Nonoperating Revenue as Operating Revenue
Investors view operating income numbers as being most informative about the ongoing earnings power of a business. For example, many investors base forward price–earnings ratio estimates on forecasts of operating earnings that exclude nonrecurring items. Broadly, management may have an incentive to include nonrecurring revenues in operating income that might not belong there.
4.1.3.1. The Range of Problems
Capital markets tend to focus on operating income numbers. This is important, because items that are outside the core operating activity of the company are not as relevant for assessing the long-term cash flow generating capability of the company. For example, a company operating in the retail sector may have a portfolio of financial assets that is required to be periodically revalued. These revaluations, to the extent the securities are held for trading purposes, will be included in net income. But these earnings are not reflective of the core operating activity of the company. Likewise, gains or losses associated with the divestiture of noncurrent assets typically fall outside the core operating activities of most companies; yet these transactions will affect net income. The challenge for the analyst is in separating operating from nonoperating activities. Companies do this as evidenced by the operating, investing, and financing sections of the statement of cash flows and the pro forma earnings numbers that are the focal point of earnings announcements and conference calls. However, there is discretion in making this distinction. Consequently, there is room in defining what is core or operating earnings. One of the advantages of this earnings game for management is the absence of an ex post settling up mechanism: For this type of earnings management, there is no accrual or deferral reversal in future periods.
Note that the opportunistic classification of items into operating income as opposed to a nonrecurring item is not about net income reported under generally accepted accounting principles. Rather, the issue relates to the earnings number generally provided to the capital markets. This has been described cynically by some as “earnings before bad stuff.” Pro forma earnings numbers fall outside of the domain of U.S. GAAP and as such no uniform methodology exists for calculating them.12
4.1.3.2 Warning Signs
One red flag for the opportunistic classification of nonrecurring items into operating income is to look at the temporal inconsistency with respect to the included revenues and expenses in a company’s definition of operating income. For example, if a company excludes different items from its computation of pro forma earnings across quarters, this is a good indication that the company is opportunistically using its discretion to classify items as recurring or nonrecurring. This information can be gleaned from the press releases associated with earnings announcements, and the greater disclosure required currently makes this easier to do.
4.2. Expense Recognition Issues
Having discussed revenue recognition as it relates to financial reporting quality issues, we will now focus on expense recognition, the other chief area of earnings discretion. Expense issues include
- Understating expenses.
- Deferring expenses.
- Classifying ordinary expenses as nonrecurring or nonoperating.
We address these in order.
4.2.1. Understating Expenses
Income can be increased by both overstating revenue and understating expenses. In this section, we focus on the improper capitalization of costs.
4.2.1.1 The Range of Problems
Our focus in discussing expense recognition will be selling, general, and administrative (SG&A) expenses and the cost of goods sold (COGS).
The classic expense account with considerable discretion is depreciation and amortization, which is typically reported as part of SG&A or COGS on the income statement. Companies are required to determine the capital costs associated with noncurrent assets and then depreciate the depreciable amount (the difference between the capitalized costs and an estimate of the salvage value) over an estimated useful life. Reported depreciation expense is the result of many choices—which costs to capitalize, residual value assumptions, useful life assumptions—as well as an allocation method (e.g., straight line, accelerated, or some other method).
Another primary expense account that contains considerable discretion is cost of goods sold (COGS). Accrual accounting only expenses costs associated with inventory when that inventory is sold. For companies with large inventory balances, there is considerable discretion as to the costs that are capitalized into inventory as well as how to value that inventory at the end of the fiscal period. Obsolescence must be accounted for and inventory, as with other assets, cannot be reported on the balance sheet at greater than fair value. Identification of obsolete inventory and valuation at the end of the fiscal period is subjective. As with receivables, care should be taken to monitor significant changes in inventory balances.
4.2.1.2. Warning Signs
Financial statements contain ample disclosures related to depreciation and amortization. Companies must disclose their method (straight line or otherwise) along with broad summaries of useful lives. Ratios of depreciation rates relative to the gross value of property, plant, and equipment or ratios of changes in depreciation rates relative to contemporaneous sales, can easily be computed and compared to other companies to assess conservative or aggressive depreciation rates.
Financial statement information also can be combined with additional disclosure that companies make at earnings announcements or via conference calls. Companies typically give more detailed information than what you see in the 10-Q or 10-K filing, especially for segment information. A good example of the information contained in conference calls is Ford Motor Company. For the quarter ended 30 September 2004, Ford reported net income of $266 million compared to a net loss of $25 million for the quarter ended 30 September 2003. A key driver of this improved profitability is the financial services arm of Ford. That unit reported an increase of net income from $1.031 billion for Q3, 2003 to $1.425 billion for Q3, 2004. Revenues fell marginally from $6.499 billion for the financial services arm to $6.198 billion, but this was coupled with a significant reduction in depreciation from $2.072 billion to $1.570 billion. Conference call participants were quick to pick this up, and noticed that the bulk of the improvement in the financial services profitability was attributable to growth in Ford Motor Credit, with over half of the improvement coming from lease residual value improvements (i.e., the company reassessed the residual value of its fleet based on recent auctions, increasing residual values and consequently lowering periodic depreciation charges). This choice as to residual value affected the depreciation accrual. The net effect allowed Ford to report a profit for Q3, 2004 as opposed to a loss. This example also illustrates that the information used to identify financial reporting quality issues need not be limited to the financial statements themselves. Conference calls and other company communications provide additional information for the interpretation of reported financial statements. In the case of Ford, it was detailed segment disclosure in the conference call that alerted conference call participants to the reasons Ford moved to a profit in Q3, 2004.
NetFlix is a good example of low-quality financial reporting attributable to depreciation-related choices. NetFlix has a simple business model: It maintains an extensive DVD warehouse with an online distribution channel. This business model was very effective, primarily due to a first mover advantage in implementing the strategy. Part of the financial performance of NetFlix is attributable to the amortization method for its rental library. NetFlix uses an accelerated amortization method known as “sum of the months.”13 Prior to 2004, NetFlix used this accelerated method with a one-year useful life assumption. Post 2004, NetFlix switched to a three-year useful life assumption for back catalogue DVDs. This had the effect of slowing the expensing of back catalogue DVDs. Going into 2005, the back catalogue DVDs that would have been expensed from the acquisitions during 2004 would be spread out over the next three years. The change in amortization method at NetFlix had the consequence of increasing reported earnings in the year following the change by slowing the expense rate of back catalogue DVDs. Blockbuster is an interesting counterexample. They employ a similar accelerated depreciation method over one year for all DVDs, and have kept this method constant.
Reporting quality issues with inventory can be tracked by monitoring large changes in the inventory balance. Inventory buildup will be explained by companies as necessary to support future product demand. On average, however, an inventory buildup is a good indication that the company has problems with managing its inventory levels and/or has not been sufficiently aggressive in writing down the value of that inventory as the turnover slows. As with the days’ sales outstanding ratio discussed for revenue issues, a similar days’ inventory outstanding ratio can be looked at to identify inventory quality issues. This ratio is equal to net inventory divided by cost of goods sold multiplied by 365. This ratio gives a sense for how quickly the company is able to convert inventory into revenue. Increases in this ratio may indicate potential problems related to earnings quality. But be careful in treating all increases and decreases equally. Companies can shift their inventory management systems leading to significant periodic changes in this ratio. For example, companies expecting some instability in inventory supply chains from overseas locations may rationally build up additional inventory to act as a buffer from potential disruptions. But companies will always try to explain away unfavorable movements in key ratios. The right question to ask of management in this scenario is “Why were supply chains set up with such political risk in the first place?” Finally, for companies utilizing the LIFO cost flow assumption to value their inventories, check the footnotes carefully to see the extent to which LIFO liquidations have contributed to profit in a given fiscal period. If you see a LIFO liquidation has contributed to an improvement in profitability as COGS are lower by “dipping” into the older inventory cost layers, this one time advantage should be removed from current earnings to give a better indication of long-term profitability.
4.2.2. Deferring Expenses
In addition to simply understating expenses, companies are able to shift the recording of expenses across fiscal periods under the accrual accounting system. In this section we look at some of these deferral choices in detail.
4.2.2.1. The Range of Problems
One of the largest areas of accounting abuse is the practice of capitalizing costs that should have been expensed. Given the significant discretion in capitalizing costs for various noncurrent assets such as property, plant, and equipment and intangibles, some companies abuse this discretion and include costs in the noncurrent portion of the balance sheet that should have been expensed.
4.2.2.2. Warning Signs
The simplest way to get a sense for inappropriate capitalization is to track growth in net noncurrent assets: capitalization activity is what we are interested in. The broad measures of accruals described in Section 2 will flag companies that have experienced significant growth in their net operating assets. On average, this growth in net operating assets is associated with lower future company performance. This is due to a combination of over-investment tendencies from these companies and diminishing marginal returns to investment activity. However, not all companies that grow will perform poorly. Identifying, ex ante, which companies are growing at a rate that is not likely to lead to lower future performance is a challenging task. The approach is to place the asset growth in context relative to sales growth, expected future sales growth both for the company itself and sector group which it belongs to. If a company is growing its asset base in an environment where capacity utilization is very tight and margins are quite attractive, this asset growth is less likely to be indicative of poor future performance as compared to a company that is growing its asset base and has excess capacity and deteriorating margins. But note that this is a challenging task: It is very difficult to separate good asset growth from bad asset growth. Your presumption should be to treat all asset growth as bad and impose a tough standard to reject that hypothesis.
The following example touches on the issue of capitalization of software development costs. It also illustrates the care that must be taken in selecting valuation metrics when costs that might be included in operating expenses are capitalized.
EXAMPLE 16-4 Expense Recognition for an Information Service Provider
Thomson Corporation, based in Canada, is one of the world’s leading information services providers. The software industry is an interesting sector to examine because it allows considerable discretion with respect to capitalization decisions. Software providers are allowed to capitalize costs associated with software development and then amortize these costs over a period in which the product is expected to be sold. Thomson’s income statement for the year ended 31 December 2006, along with selected notes related to its treatment of software development costs, is presented here.
The Thomson Corporation Consolidated Statement of Earnings (Millions of U.S. Dollars, except per Common Share Amounts)
| Year Ended 31 December | ||
| 2006 | 2005 | |
| Revenues | 6,641 | 6,173 |
| Cost of sales, selling, marketing, general and administrative expenses | (4,702) | (4,351) |
| Depreciation (notes 11 and 12) | (439) | (414) |
| Amortization (note 13) | (242) | (236) |
| Operating profit | 1,258 | 1,172 |
| Net other income (expense) (note 4) | 1 | (28) |
| Net interest expense and other financing costs (note 5) | (221) | (221) |
| Income taxes (note 6) | (119) | (261) |
| Earnings from continuing operations | 919 | 662 |
| Earnings from discontinued operations, net of tax (note 7) | 201 | 272 |
| Net earnings | 1,120 | 934 |
| Dividends declared on preference shares (note 16) | (5) | (4) |
| Earnings attributable to common shares | 1,115 | 930 |
| Earnings per common share (note 8): | ||
| Basic and diluted earnings per common share: | ||
| From continuing operations | $1.41 | $1.00 |
| From discontinued operations | 0.32 | 0.42 |
| Basic and diluted earnings per common share | $1.73 | $1.42 |
Note 1: Summary of Significant Accounting Policies
Computer software
Capitalized software for internal use
Certain costs incurred in connection with the development of software to be used internally are capitalized once a project has progressed beyond a conceptual, preliminary stage to that of application development. Costs that qualify for capitalization include both internal and external costs, but are limited to those that are directly related to the specific project. The capitalized amounts, net of accumulated amortization, are included in “Computer software, net” in the consolidated balance sheet. These costs are amortized over their expected useful lives, which range from three to ten years. The amortization expense is included in “Depreciation” in the consolidated statement of earnings.
Capitalized software to be marketed
In connection with the development of software that is intended to be marketed to customers, certain costs are capitalized once technological feasibility of the product is established and a market for the product has been identified. The capitalized amounts, net of accumulated amortization, are also included in “Computer software, net” in the consolidated balance sheet. The capitalized amounts are amortized over the expected period of benefit, not to exceed three years, and this amortization expense is included in “Cost of sales, selling, marketing, general and administrative expenses” in the consolidated statement of earnings.
Note 12: Computer Software
Computer software consists of the following:
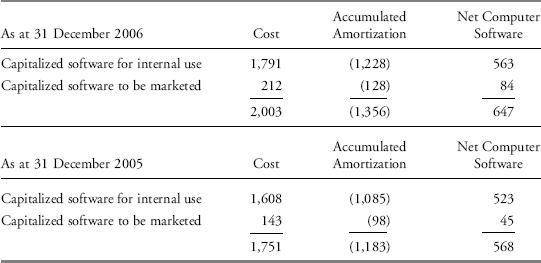
The amortization charge for internal use computer software in 2006 was $241 million (2005 — $224 million) and is included in “Depreciation” in the consolidated statement of earnings. The amortization charge for software intended to be marketed was $25 million (2005 — $21 million) and is included in “Cost of sales, selling, marketing, general and administrative expenses” in the consolidated statement of earnings.
Based on the information given, address the following problems:
1. Contrast Thomson’s recognition of software related costs in 2006 with the actual cash spent acquiring and developing the software.
2. Estimate Thomson’s 2006 operating profit and earnings from continuing operations assuming Thomson expensed all software related costs when the related cash flows occurred.
3. Contrast the implications for the cash flow statement from expensing software development costs rather than capitalizing and amortizing them.
4. Many analysts use EV/EBITDA (enterprise value divided by earnings before interest, taxes, depreciation, and amortization) as a valuation measure for software companies. Enterprise value is simply the sum of the market capitalization and the book value of outstanding debt. Critique the use of this measure when software related costs are being capitalized.
Solution to 1: The total balance for capitalized computer software increased from $568 in 2005 to $647 in 2006, a total of $79. This is the amount by which computer software costs exceeded the amount recognized as an expense on the income statement.
Solution to 2: Operating profit would have been $1,258 − 79 = $1,179. The effective tax rate for 2006 is 11.5% [ = 119/(1,258+1 − 221)]. Net income would be reduced by $79 adjusted for tax, or $79(1 − 0.115) = $70, so the adjusted earnings from continuing operations is $919 − 70 = $849. Earnings from continuing operations were effectively overstated by 8.2 percent (= 70/849) relative to cash costs.
Solution to 3: Software development costs would typically be expensed as part of research and development, or in Thomson’s case as part of cost of sales. With such treatment, software development costs affect (reduce) cash flow from operating activities. By contrast, capitalized software costs are amortized to expense over time. The initial expenditure is recorded as a cash flow from investing activities. Amortization of the capitalized amount is added back to net income when calculating cash flow from operating activities. In effect, capitalizing software costs reclassifies them from an operating cash flow to an investing cash flow, and then allocates that amount to amortization expense over time.
Solution to 4: EBITDA ignores the costs related to software development by adding amortization back to operating income. Unless either the initial capitalized amount or the subsequent amortization is deducted, investors are effectively ignoring a software company’s software development costs altogether in evaluating the company. Because software companies must develop software in order to stay in business, valuing the companies on the basis of EBITDA potentially ignores a critical component of expense, akin to ignoring a retailer’s inventory costs. In the case of Thomson, the amortization of software to be marketed is included in SG&A expenses, so it is captured in the computation of EBITDA. However, most of Thomson’s software costs are related to software for internal use and were not included in SG&A. Thus using EBITDA in this case would result in ignoring most software costs.
4.2.3. Classification of Ordinary Expenses as Nonrecurring or Nonoperating
The final set of expense issues that we will touch on relate to a possible way to mask a decline in operating performance by reclassifying operating expenses.
4.2.3.1. The Range of Problems
There is an incentive for management at companies with deteriorating core income to reclassify some recurring or operating expenses as nonoperating. The issue here is the inappropriate classification of a recurring item that would normally be recorded as part of SG&A or COGS. These costs are then classified as a nonrecurring or special charge and are reported as a separate line item on the income statement. This is easiest for companies that have experienced a genuine special item such as a restructuring. Recurring costs can then be “piggy-backed” onto these nonrecurring items.
4.2.3.2. Warning Signs
McVay (2006) examines this issue in detail and identifies one way to track this behavior based on the core operating margin, defined as (Sales − COGS − SGA)/Sales. This ratio represents the pretax return on a money unit (e.g., euro) of sales resulting from the company’s operating activities. To use it, analysts should compute year-over-year changes in the core operating margin and look for spikes in the incidence of negative special items for companies that have experienced an increase in this margin. Observing an increase in core operating margins coincident with a negative special item is consistent with opportunistic classification of a recurring expense as a nonrecurring expense. More sophisticated approaches would include building models of expected core operating margin in year t rather than focusing on a simple change in core operating margin. Examples of these sophisticated approaches include building regression-based models that forecast next period’s core operating margin using the prior period’s core operating margin in addition to other variables such as expected growth rates, macroeconomic conditions, sector affiliation, etc. The goal is the same: To build an expected core operating margin to compare against the realized core operating margin. If you see a large positive unexpected increase in core operating margin and the company contemporaneously reports a negative special item or nonrecurring charge, this may indicate a reclassification of a recurring item as a nonrecurring item. Absent this opportunistic reclassification, the company would not have reported an increase in its core operating margin. Furthermore, this reclassification tendency is stronger for companies that do not regularly report special items, and the expense classification shifting is more pervasive when incentives are greatest (e.g., the desire to meet/beat analyst forecasts). McVay (2006) notes Borden Inc. as a good example of this type of behavior. The SEC determined that Borden had inappropriately classified $192 million of marketing expenses, which should have been included in standard selling, general, and administrative expenses, as part of a 1992 restructuring charge.
EXAMPLE 16-5 Core Operating Margin Warning Sign
Based in Canada, NOVA Chemicals Corporation, together with its subsidiaries, engages in the production and marketing of plastics and chemicals. The company operates in three business units: Olefins/Polyolefins, Performance Styrenics, and STYRENIX. NOVA’s income statements and an associated note are presented here.
Consolidated Statements of Income (Loss) and Reinvested Earnings (Deficit) (Millions of U.S. Dollars, except Number of Shares and per Share Amounts)
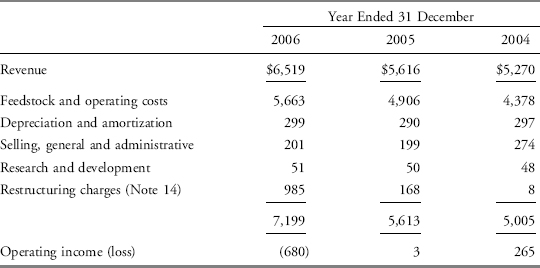
14. Restructuring Charges
During the past three years, NOVA Chemicals has undertaken several restructuring steps to reduce costs. As a result of these actions, the Company estimates it will reduce costs by about $100 million per year beginning in 2007. In addition to this, depreciation will be reduced by about $80 million per year in the three reportable segments within the STYRENIX business unit.
In 2006, NOVA Chemicals recorded a restructuring charge of $985 million before-tax ($861 million after-tax) related to the following:
The Company recorded an impairment charge of $860 million related to the STYRENIX business unit assets. The STYRENIX business unit includes the Styrene Monomer, North American Solid Polystyrene and NOVA Innovene European joint venture segments. The STYRENIX business unit has not been profitable due to poor market conditions, and in recent years both NOVA Chemicals and the NOVA Innovene joint venture have reduced production capacity through plant closures. In July 2006, NOVA Chemicals announced it would investigate various alternatives for the STYRENIX business unit, including sale, formation of a joint venture with other producers, or spin out. NOVA Chemicals has assessed the recoverability of the STYRENIX assets and determined that the carrying value exceeded the estimated future cash flows from these assets. Based on this analysis, the fair market value of these STYRENIX facilities was determined to be $242 million.
NOVA Innovene permanently closed its Carrington, UK solid polystyrene facility in October 2006. The Company recorded a restructuring charge of $57 million related primarily to noncash asset write-downs of the plant including $8 million related to total expected severance and other departure costs. As of December 31, 2006, $5 million of the severance costs was paid to employees.
During 2006, NOVA Chemicals restructured its North American operations to better align resources and reduce costs. As a result, the Company recorded a $53 million restructuring charge related to severance, pension and other employee-related costs. Of this amount, $10 million related to one-time pension curtailment and special termination benefits. Of the remaining $43 million, $22 million has been paid to employees by the end of 2006 with the majority of the remainder to be paid in 2007.
A $15 million charge was recorded related to the accrual of total expected severance costs for the Chesapeake, Virginia polystyrene plant, which was closed in 2006. To date, $3 million has been paid to employees.
NOVA’s property, plant, and equipment balance declined from $3,626 in 2005 to $2,719 in 2006. Net operating assets were $3,088 in 2005 and $2,349 in 2006.
Based on the information given, address the following problems:
1. What was NOVA’s core operating margin in each of the three years ended 31 December 2006, 2005, and 2004?
2. What was NOVA’s balance-sheet-based accruals ratio in 2006?
3. Are there any warning signs related to NOVA’s earnings quality based on the information presented?
Solution to 1: Core operating margins, when calculated as (Sales − Cost of sales − SGA)/Sales, for NOVA were 10.0 percent, 9.1 percent, and 11.7 percent in 2006, 2005, and 2004, respectively (feedstock and operating costs being used as the most representative of cost of sales). When calculated using all operating items other than the restructuring charge, core operating margins were 4.7 percent, 3.0 percent, and 5.2 percent, which is directionally similar.
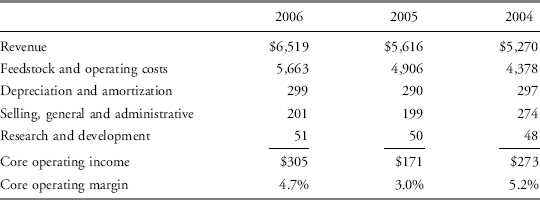
Solution to 2: The balance-sheet-based accruals ratio is equal to the Change in NOA/Average NOA. In NOVA’s case, (2,349 − 3,088)/[0.5 × (2,349+3,088)] = −739/2,718.5 = −27.2%.
Solution to 3: Yes. The large accrual ratio suggests that a significant portion of NOVA’s net income was due to discretionary items. The increase in core operating margin from 2005 to 2006, combined with a large special item in 2006, fits McVay’s warning sign that the company may be classifying ordinary operating expenses as nonoperating or nonrecurring. This is an indication of opportunistic use of expense classification. The reported numbers for NOVA should be viewed skeptically.
EXAMPLE 16-6 The Classification of Expenses
Matsushita Electric Industrial Co., Ltd., best known for its Panasonic brand name, is one of the world’s leading manufacturers of electronic and electric products for a wide range of consumer, business, and industrial uses, as well as a wide variety of components. Excerpted here are Matsushita’s income statements for the years ended 31 March.
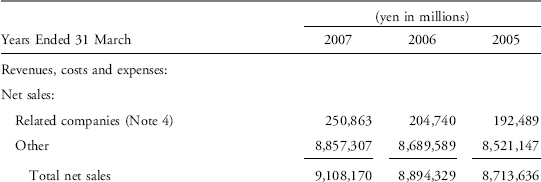
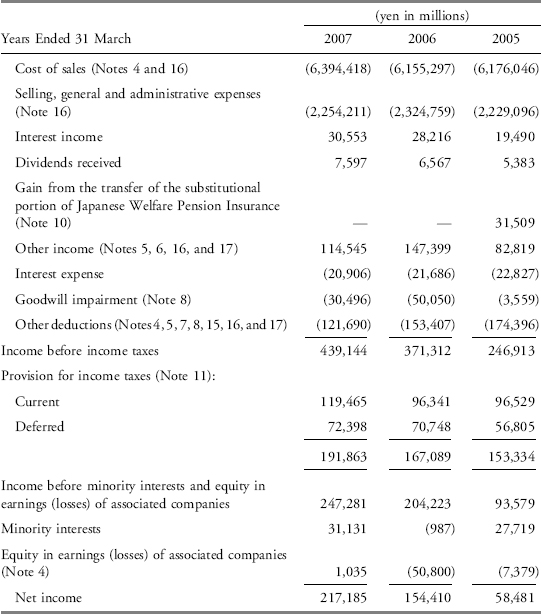
As shown, Matsushita includes a line “other deductions,” which would be understood to be nonoperating items because it appears below such items as “other income” and “interest expense.” Without further examination, analysts may be inclined to treat this item as nonoperating or nonrecurring. However, the deductions amount to a high percentage of pretax income (as high as 70 percent in 2005) and revenue (2 percent in 2005.) Clearly the distinction is worth further analysis. Consider the associated notes, which are excerpted here.
(4) Investments in and Advances to, and Transactions with Associated Companies
During the years ended March 31, 2006 and 2005, the Company incurred a write-down of 30,681 million yen and 2,833 million yen, respectively, for other-than-temporary impairment of investments and advances in associated companies.
(5) Investments in Securities
During the years ended March 31, 2007, 2006, and 2005, the Company incurred a write down of 939 million yen, 458 million yen and 2,661 million yen, respectively, for other-than-temporary impairment of available-for-sale securities, mainly reflecting the aggravated market condition of certain industries in Japan.
(7) Long-Lived Assets
The Company periodically reviews the recorded value of its long-lived assets to determine if the future cash flows to be derived from these assets will be sufficient to recover the remaining recorded asset values.. . .
(8) Goodwill and Other Intangible Assets
The Company recognized an impairment loss of 27,299 million yen during fiscal 2007 related to goodwill of a mobile communication subsidiary. This impairment is due to a decrease in the estimated fair value of the reporting unit caused by decreased profit expectation and the intensification of competition in a domestic market that was unforeseeable in the prior year.
The Company recognized an impairment loss of 3,197 million yen during fiscal 2007 related to goodwill of JVC due primarily to profit performance in JVC’s consumer electronics business being lower than the Company’s expectation.
The Company recognized an impairment loss of 50,050 million yen during fiscal 2006 related to goodwill of a mobile communication subsidiary. This impairment is due to a decrease in the estimated fair value of the reporting unit caused by decreased profit expectation and the closure of certain businesses in Europe and Asia.
(15) Restructuring Charges
The Company has provided early retirement programs to those employees voluntarily leaving the Company. The accrued early retirement programs are recognized when the employees accept the offer and the amount can be reasonably estimated. Expenses associated with the closure and integration of locations include amounts such as moving expense of facilities and costs to terminate leasing contracts incurred at domestic and overseas manufacturing plants and sales offices. An analysis of the accrued restructuring charges for the years ended March 31, 2007, 2006, and 2005 is as follows:
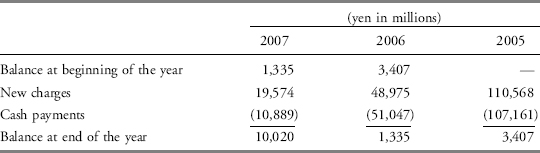
(16) Supplementary Information to the Statements of Income and Cash Flows
Foreign exchange gains and losses included in other deductions for the years ended March 31, 2007, 2006 and 2005 are losses of 18,950 million yen, 13,475 million yen and 7,542 million yen, respectively.
Included in other deductions for the year ended March 31, 2006 are claim expenses of 34,340 million yen.
Based on the information given, address the following problems:
1. Based on the description in the notes for each item, comment on whether it is appropriate to treat the following charges as nonoperating or nonrecurring:
A. Investments in and Advances to, and Transactions with Associated Companies
B. Investments in Securities
C. Long-Lived Assets
D. Goodwill and Other Intangible Assets
E. Restructuring Charges
F. Supplementary Information to the Statements of Income and Cash Flows
2. How would analyzing balance-sheet-based or cash-flow-statement-based accruals ratios help in assessing the impact of movements in the accounts cited earlier? (No calculations are needed.)
Solutions to 1: Discretion is required in analyzing many items. When in doubt, analysts may wish to prepare separate sets of financial statements to understand the effect of treating individual items in different manners.
A. Classifying changes in the value of the investments as nonoperating is appropriate for a nonfinancial company such as Matsushita.
B. Securities held available for sale are typically used as alternatives to investing in low-yielding cash. Treating losses on such securities as nonoperating is appropriate. Again, however, persistent losses raise the question of whether management is capable of selecting worthwhile alternative investments.
C. The value of long-lived assets is typically charged to expense over time as depreciation, which is considered to be an operating item. The impairment charges shift future depreciation expense into the current year, which reduces the future depreciation and also suggests that past depreciation charges were too low. Analysts should reclassify the impairment expense to treat it on par with normal depreciation.
D. Accounting principles call for periodic testing of goodwill for impairment. No amortization expense is otherwise charged. Because the impairment does not offset a normal operating expense, it can be appropriate to classify it as nonoperating, as Matsushita does. However, analysts should pay attention to goodwill impairment. Large impairments can appear conservative at the time they are announced, but the need for them can result from previous aggressive accounting (aggressive at least from an after-the-fact perspective). In the case of Matsushita, it appears that management overpaid for its past investments.
E. Early retirement programs and expenses associated with the closure and integration of locations include amounts such as moving expense of facilities and costs to terminate leasing contracts. Given that these expenses would be incurred from time to time as part of normal business operations, they should be reclassified as operating expenses.
F. Matsushita is an international operation and should thus be expected to incur foreign currency gains and losses as part of normal operations, although they are typically considered outside management’s control. Foreign exchange gains are typically treated as adjustments to net financing costs and are treated as nonoperating.
Solution to 2: Marketable securities (if treated as short-term investments) and equity investments would not be included in either net operating assets or cash flow from operating activities, so the accruals ratios would provide the correct interpretation of these items. Foreign currency and goodwill may appear in a balance-sheet-driven accruals ratio, but not in the ratio based on the cash flow statement. These were also items of questionable operating significance, so the mixed treatment in an accruals ratio reflects the ambiguity. The charges to long-lived assets and for restructuring would deservedly be reflected in the accruals ratios.
4.3. Balance Sheet Issues
The focus of our discussion has been quality of earnings issues as contained in various revenue and expense accounts. There are additional sources of information related to the balance sheet that pertain to our discussion of earnings quality. We will introduce this topic with brief discussion of two balance sheet issues, off-balance sheet debt and goodwill.
4.3.1. Off-Balance Sheet Liabilities
Off-balance sheet debt includes items not reported in the body of the balance sheet but that might be associated with an obligation for future payments. Information contained here is related to our discussion of earnings quality, as the net assets that are acquired from this off-balance sheet financing are a form of growth that an on-balance sheet measure of accruals would fail to capture.
4.3.1.1. The Range of Problems
Current accounting standards allow for a significant portion of assets and liabilities to avoid recognition in the primary financial statements. A consequence of this is that companies will appear to have less leverage than they actually do when leverage is measured using only on-balance sheet information. The classic example is leases. U.S. GAAP recognizes two types of leases (operating and capital) and provides different accounting rules for each. The distinction between the two types of leases rests primarily on a consideration of the present value of minimum lease payments relative to the fair value of the asset leased (greater than 90 percent constitutes a capital lease under U.S. GAAP), and a consideration of whether the life of the lease is greater than 75 percent of the useful life of the leased asset (greater than 75 percent constitutes a capital lease under U.S. GAAP). There are other issues to consider such as the existence of a bargain purchase option, but they typically are less relevant for the determination of whether a lease is operating or not. The treatment of operating leases relative to capital leases is dramatically different. An operating lease treats the cash outflow associated with the lease as a rental expense that will flow through the income statement over the life of the lease. With a capital lease, the fair value of the asset is recognized as both an asset and liability at inception of the lease, and subsequently amortized over the life of the lease. Companies have a strong preference for operating lease classification, as this keeps the lease obligation off the balance sheet. With the current rules under U.S. GAAP, there is significant discretion in structuring the terms of the lease contract so as not to trigger one of the thresholds described earlier.
Currently there are few companies reporting capital leases: Operating leases have become the norm, largely attributable to their preferred accounting treatment. Estimates range to over $1 trillion dollars for the amount of undiscounted future cash flow obligations associated with operating leases for SEC registrants. This is clearly a nontrivial issue. The use of operating leases is pervasive in the retail sector with companies such as Walgreen, Wal-Mart, CVS, and others having very large off-balance sheet operating lease obligations. The consequence of bringing these leases onto the balance sheet will be to increase leverage ratios; and depending on how these companies amortize the value of the leased asset, there could also be significant impacts on reported income directly.
4.3.1.2. Warning Signs
While the FASB has governed the determination of operating and capital leases and the appropriate accounting treatment, SEC disclosures have improved in recent years with the addition of tabular presentation of future cash flow obligations associated with debt, operating leases, and other commitments in the 10-K. From these disclosures it is now possible to identify future cash flow obligations from many contractual obligations including current operating leases. These numbers can be discounted to their present value to get a rough estimate of the off-balance sheet obligations, which in turn can be brought on to the balance sheet and amortized using the companies’ reported depreciation schedule for other noncurrent assets. Furthermore, tracking year-over-year changes in these off-balance sheet leases can highlight less transparent financing activities for these companies, which are arguably as important as on-balance sheet financing activities for forecasting future company performance.
The following example explores the use of off-balance sheet debt of a major U.S. retailer.
EXAMPLE 16-7 Off-Balance Sheet Debt
In its 10-K for the year ended 31 January 2007, Wal-Mart’s (NYSE: WMT) balance sheet included total obligations under capital leases of $3,798 million, of which $285 million was due within one year and the remainder was long-term. The notes to the financial statements also broke out the following information regarding long-term contractual obligations:
Contractual Obligations and Other Commercial Commitments
The following table sets forth certain information concerning our obligations and commitments to make contractual future payments, such as debt and lease agreements, and contingent commitments:
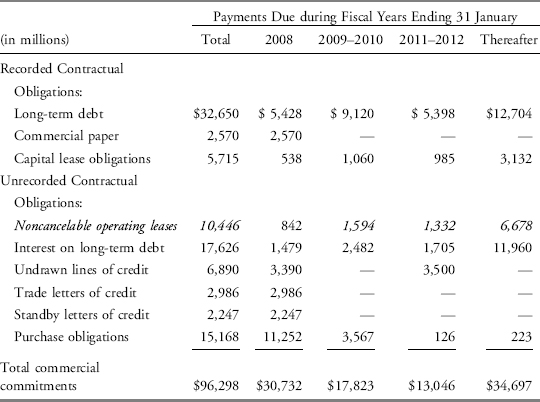
Based on the information given, address the following problems:
1. Contrast the relative importance of on- and off-balance sheet treatment of contractual obligations for Wal-Mart.
2. Determine the relative importance of Wal-Mart’s off-balance sheet obligations, given that Wal-Mart’s 2007 cost of sales was $264 billion.
3. Estimate the impact on Wal-Mart’s financial statements if operating leases were treated as though they were capital leases.
Solution to 1: Wal-Mart lists $40.9 billion of recorded contractual obligations ($32,650+$2,570+$5,715), and $55.4 ($10,446+$17,626+$6,890+$2,986+$2,247+$15,168) billion of future obligations that are not recorded on the balance sheet.
Solution to 2: Noncancelable operating leases are similar in nature to capital leases, or assets financed with debt. They should be treated as though they were capital leases. The interest on long-term debt is the total future sum, and represents a financing cost rather than an actual liability. Analysis of interest coverage ratios should be adequate, with no adjustments to financial statements required. Undrawn lines of credit represent credit available, not currently in use. It is a potential obligation rather than an actual one. Letters of credit and purchase obligations are normal parts of business, and the related amounts ($20.4 billion) are small relative to Wal-Mart’s operations. Wal-Mart’s 2007 cost of sales was $264 billion—so the $15 billion in purchase obligations (which will eventually flow through cost of sales) amounts to less than three weeks’ worth of the actual purchases by Wal-Mart.
Solution to 3: The present value of Wal-Mart’s operating leases can be estimated by comparing them to its capital leases. Ideally, an analyst would discount the future capital lease payments, $5,715, to their carrying value of $3,798 to determine the implicit interest rate (an internal rate of return), then discount the operating lease obligations at the same rate. However, the disclosures give only broad ranges of when the payments are due, so analysts must estimate the timing. A shortcut approach is to simply apply the same overall discount to each type of lease. So, if the present value of capital leases is $3,798/$5,715 = 66.5% of the future payments, the present value of operating leases would be estimated at $10,446 × 0.665 = $6,942. To capitalize the operating leases, the analyst would add $6,942 to property, plant, and equipment and also to long-term liabilities. Leverage ratios, asset turnover, and other ratios involving assets and liabilities would be affected. In addition, the existing lease payments would ideally be allocated to depreciation and interest components rather than the current classification as rent. This would also impact interest coverage ratios and operating margins. The precise impact would depend on the amortization assumptions made. Note: Operating lease obligations of $10.4 billion are 1.83 times larger than the $5.7 billion in capital leases. The operating leases are slightly longer duration, as evidenced by the fact that 64 percent ($6,678/$10,446) of the payments are due in more than five years, compared with 55 percent ($3,132/$5,715) of the capital lease payments. Because the payments are due over a longer time horizon, their discounted value is lower, and the $6.9 billion estimated value is somewhat high (though considerably more accurate than the current balance sheet valuation of zero).
4.3.2. Goodwill
Goodwill is an intangible asset, subject to an annual impairment test, that is typically paid for in a business combination when the consideration paid to acquire the target exceeds the fair value of the target’s net assets. For a company with many past acquisitions, the impairment of goodwill can have a major effect on reported financials.
4.3.2.1. The Range of Problems
When a company acquires another company and records part of the acquisition price as goodwill, the goodwill is capitalized as an asset and no periodic amortization charges are taken against it. Instead, companies evaluate goodwill and other acquired intangible assets for impairment annually or whenever events or changes in circumstances indicate that the value of such an asset is impaired. This assessment requires estimates of the future cash flows associated with continued use of the asset, growth rates, and general market conditions. There is considerable discretion in conducting this impairment test, and this is one of the key risks associated with the external audit function: Auditors typically hire external appraisers to help with their assessment of fair value of goodwill and other intangibles.
4.3.2.2. Warning Signs
Disclosures for goodwill can be found in the supplemental information to the primary financial statements. Typically, a company will provide tabular disclosure for year-over-year changes in reported goodwill. Given the inherent subjectivity in how this account is valued, analysts should look carefully at changes (or the absence of an impairment given overall economic conditions) in reported goodwill. Companies that continue to report goodwill on their balance sheets, but that have market capitalization less than the book value of equity, are certainly worthy of detailed examination to understand why an impairment was not taken. Karthik and Watts (2007) provide an interesting illustration of this situation for Orthodontic Centers of America (OCA). For the fiscal year ended 31 December 2003, OCA had reported book value of equity in excess of the market value of equity, yet continued to report a sizeable goodwill on its balance sheet ($87 million out of its $660 million total assets were attributable to goodwill). OCA was subsequently delisted from the stock exchange and in 2006 filed for bankruptcy.
4.4. Cash Flow Statement Issues
The material discussed in the preceding sections has highlighted many problems with earnings measures as predictors of a company’s ability to generate future free cash flows. In this section, we outline a few caveats related to blindly following cash-flow-based measures. We will discuss three key items: (1) classification issues in the cash flow statement, (2) omitted investing and financing activities, and (3) real earnings management activity.
4.4.1. Classification Issues
Accounting standards define cash and cash equivalents to include only very short-term highly liquid investments. This narrow definition leads to the possibility that companies’ investment of cash in liquid assets may appear in the investing as well as the operating section of the statement of cash flows.14
Many firms carry large cash balances that are invested in a portfolio of reasonable liquid investments. These cash balances are kept for various reasons. For example, Microsoft Corporation holds very large cash balances in part to help finance new investment opportunities when they arise, eliminating the need to obtain costly external financing. The cash that companies like Microsoft hold is not always invested in highly liquid short-term investments such as Treasury bills because companies can often obtain higher expected rates of return by investing elsewhere. To the extent that cash is invested in marketable securities such as equity and other fixed-income products, these investments are not strictly “cash equivalents” under most accounting standards. This allows companies to classify them as longer-term investments. The result is that some liquid investments end up appearing in the investing section of the statement of cash flows. If the analyst focuses solely on an operating cash flow number, these “investing” cash flows will be missed. An easy solution to this problem is to take a holistic view to cash flows, and include operating and investing cash flows when assessing financial reporting quality. The aggregate accrual measures described in this reading do this for you by capturing the net cash flow generated from both operating and investing activities.
4.4.2. Omitted Investing and Financing Activities
The aggregate accrual measures outlined in this reading are based solely on investing and financing activity that is reported in the primary financial statements. There are certain types of investing and financing activity that are (1) not reported in either the balance sheet or statement of cash flows, or (2) not reported in the financial statements at all. An example of the first category is common-stock-based acquisition activity. Such activity will be picked up via the balance sheet measure of aggregate accruals, and the net assets acquired through the acquisition will be reported in the balance sheet postacquisition for the new entity. It is important for the analyst to utilize both a balance-sheet-based and cash-flow-statement-based measure of aggregate accruals so as not to miss capturing the effects of such activity. An example of the second category is operating leases. This was described in detail back in section 4.3.1. The recommended approach is to capitalize the operating lease and adjust the balance sheet to reflect this off-balance sheet source of asset growth. What the analyst should pay attention to is not the existence of operating leases per se, but growth in operating lease activity. A good example is JetBlue Airways Corporation (NASDAQ: JBLU). Like most airline operators JetBlue makes extensive use of operating leases in its business model. From the perspective of 2007, over the last three years JetBlue has expanded extensively in part by increasing the use of operating leases related to terminal usage and flight equipment. The three panels in Exhibit 16-11 are extracted from the annual reports filed by JetBlue for the fiscal years ended 31 December 2004 through 31 December 2006.
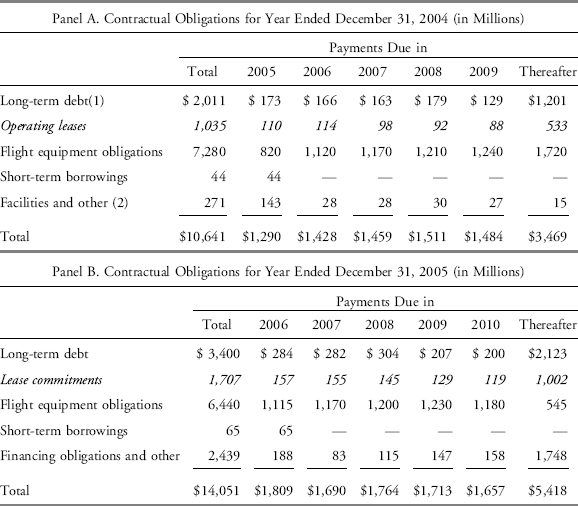
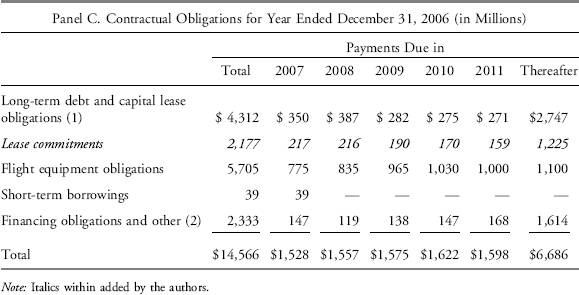
There is a clear increase in the extent of operating lease activity for JetBlue over the three years from 2004 through 2006. To the extent that the growth in operating lease activity is not associated with asset growth that is recorded on the balance sheet, this lease activity represents an investing activity that is missing from the primary financial statements—limiting the potential usefulness of the statement of cash flow or balance-sheet-based measures of aggregate accruals. A recommended approach is to capitalize the future cash flow obligations reported in the contractual obligation tables that companies are required to disclose (at least in the United States). As described in Section 4.3.1, simple assumptions with respect to discount rates and treatment of the cash flows that extend beyond five years are sufficient for our purposes. This capitalized amount then gets added to the asset and liability side of the balance sheet. Given that our measures focus on net operating asset growth, this growth in operating lease activity will lead to a direct change in our aggregate accrual measures as the liability side of this transaction is a financing activity.
4.4.3. Real Earnings Management Activity
Our focus on financial reporting quality has concentrated on the embedded discretion in the accrual-based accounting system. We have ignored real operating decisions that management may take to meet the same capital market and contracting pressures described in Section 2.3. For example, management may cut the budget for research and development activity toward the end of the fiscal period when it becomes clear they are struggling to meet earnings-based targets. Note that under U.S. GAAP research and development expenditures are expensed in the year that they are incurred and not capitalized for expensing over future periods. Such myopic behavior is not uncommon for management. The longer-term implications from these real operating decisions are to sacrifice future free cash flows at the expense of meeting short-term earnings targets.
4.5. A Summary of Financial Reporting Quality Warning Signs
In the course of this reading we have presented some key indicators of possibly low-quality financial reporting. In Exhibit 16-12 we indicate some key red flags to look for across the various revenue, expense, and balance sheet issues. We include the main warning signs discussed in the text as well as a selection of other warning signs that the reader may find helpful for further study. The expanded list is only a selection, of course.
EXHIBIT 16.12 Accounting Warning Signs (Selection)
Notes: Points not discussed in the text have been italicized in the table.
| Category | Observation | Potential Interpretation |
| Revenues and gains | Large increases in accounts receivable or large decreases in unearned revenue | Financial statement indicator of potential for revenue quality issues |
| Large swings in the ratio of revenue to cash collected from customers | Financial statement indicator of potential revenue acceleration issues | |
| Recognizing revenue early; for example: - Bill-and-hold sales - Lessor use of capital lease classification - Recording sales of equipment or software prior to installation and acceptance by customer |
Acceleration in the recognition of revenue boosts reported income masking a decline in operating performance | |
| Classification of nonoperating income or gains as part of operations | Income or gains may be nonrecurring and may not relate to true operating performance. May mask a decline in operating performance | |
| Recognizing revenue from barter transactions | Value of transaction may be overstated. Both parties may be striving to report revenues where no cash flow occurs. Revenues and expenses may be overstated | |
| Growth in revenues out of line with industry, peers, inventory growth, receivables growth, or cash flow from operations | May indicate aggressive reporting of sales. If receivables are growing more rapidly than sales, may indicate that credit standards have been lowered or that shipments have been accelerated. If inventories are growing more rapidly than sales, may indicate a slowdown in demand for the company’s products | |
| Large proportion of revenue occurs in the last quarter of the year for a nonseasonal business | May indicate aggressive reporting of sales or acceleration of shipments at year-end | |
| Expenses and losses | Inconsistency over time in the items included in operating revenues and operating expenses | May indicate opportunistic use of discretion to boost reported operating income |
| Classification of ordinary expenses as nonrecurring or nonoperating | May reflect an attempt to mask a decline in operating performance | |
| Increases in the core operating margin (Sales − COGS − SGA)/Sales accompanied by spikes in negative special items | May indicate opportunistic classification of recurring expenses as nonrecurring | |
| Use of nonconservative depreciation and amortization estimates, assumptions, or methods; for example, long depreciable lives | May indicate actions taken to boost current reported income. Changes in assumptions may indicate an attempt to mask problems with underlying performance in the current period | |
| Buildup of high inventory levels relative to sales or decrease in inventory turnover ratios | May indicate obsolete inventory or failure to take needed inventory write-downs | |
| Deferral of expenses by capitalizing expenditures as an asset; for example: – Customer acquisition costs – Product development costs |
May boost current income at the expense of future income. May mask problems with underlying business performance | |
| Lessee use of operating leases | May result in higher net income in early years under an operating lease, not reflecting depreciation expense and interest expense. Leased asset and associated liability not reflected on balance sheet | |
| Use of reserves, such as – Restructuring or impairment charges reversed in a subsequent period – Use of high or low level of bad debt reserves relative to peers |
May allow company to “save” profits in one period to be used when needed in a later period. May be used to smooth earnings and mask underlying earnings variability | |
| Balance sheet issues (may also impact earnings) | Lessee preference for operating lease classification | Tends to reduce leverage ratios based only on on-balance sheet items |
| Market value less than book value for companies with substantial reported goodwill | May indicate that appropriate goodwill impairments have not been taken | |
| Use of aggressive acquisition accounting, such as write-off of purchased in-process research and development costs15 | May indicate that assets and liabilities are not recorded at economic cost to the entity and that earnings may be overstated in future years relative to peers | |
| Use of special purpose vehicles (SPVs)16 | Assets and/or liabilities may not be properly reflected on the balance sheet. Income may also be overstated by sales to the special purpose entity or a decline in the value of assets transferred to the SPE | |
| Large changes in deferred tax assets and liabilities | May have near-term cash flow consequences. Particularly investigate the reason for the existence of deferred tax asset valuation allowances | |
| Sales of receivables with recourse | The use of debt may not be fully reflected on the balance sheet and the risks of noncollection may not be reflected for receivables | |
| Use of unconsolidated joint ventures or equity method investees when substantial ownership (near 50 percent) exists | May reflect off-balance sheet liabilities. Profitability ratios may be overstated due to share on income reported in income statement but related sales or assets are not reflected in parent financial statements |
Source: Adapted from Stowe, Robinson, Pinto, and McLeavey (2002), Chapter 1, Table 1-1, with additions and deletions.
5. THE IMPLICATIONS OF FAIR VALUE REPORTING FOR FINANCIAL REPORTING QUALITY: A BRIEF DISCUSSION
As a final point of discussion before concluding, it is worth noting how the recent push from the FASB and the IASB to bring greater relevance to the financial statements has the ironic side effect of increasing accounting discretion. The IASB and FASB recently have made serious efforts to embrace fair value accounting as a basis for financial reporting. The general theme is that the balance sheet should reflect fair values of assets and liabilities. While for some assets, such as equity investments in companies listed on the New York Stock Exchange, the fair value is readily determinable and easily audited (just pick up a copy of the Wall Street Journal on the last day of the fiscal period and multiply the number of shares held by the quoted market price), it is not as clear for some other assets. For example, how should one value a large block of equity or bonds in another public entity? Should a discount from the current market value be recorded from the market impact cost associated with selling such a large position? What about investments in private entities where there is no observable market (even for over-the-counter corporate bond trading in the United States, it is difficult to get an accurate price). This is not to mention the more common problem of valuing assets whose economic lives are quite long and may be quite specific to the entity—for example, specialized manufacturing equipment. The turmoil in credit markets over the summer of 2007, stemming from concerns about the collateral quality for many securitized asset-backed securities, illustrates the difficulty in identifying reliable estimates of fair value for many assets (even financial assets) that reside on company balance sheets. Of course, the FASB and IASB have very detailed guidelines defining approaches one can take to place a fair value on such items. But ultimately, fair value accounting opens the door for considerable discretion to be placed on balance sheet valuations.
What is an analyst to do when faced with this increasing uncertainty about balance sheet valuations? First, remember that financial statements should be used as an anchor for your valuation. Keep in mind that there is considerable discretion in the financial statements; appreciate where it is and be skeptical of the numbers presented to you. Second, search for disclosures relating to how the values of assets and liabilities reported in the balance sheet are determined. Financial statements should not be read in isolation from the detailed footnotes accompanying them. There is often useful detail in those footnotes that greatly assists in understanding the choices made by a company in a given fiscal period. With sufficient disclosure about the choices a company has made, it is possible to reverse engineer and place companies back on an equal footing with respect to that choice set.
We have touched on major themes in financial reporting quality. This is a broad area with considerable academic and practitioner research. Indeed, many of the techniques described here are used by analysts to make security recommendations and by asset managers in making portfolio allocation decisions. The interested reader would be well served by exploring this topic in greater detail. Among the points the reading has made are the following:
- Financial reporting quality relates to the accuracy with which a company’s reported financial statements reflect its operating performance and to their usefulness for forecasting future cash flows. Understanding the properties of accruals is critical for understanding and evaluating financial reporting quality.
- The application of accrual accounting makes necessary use of judgment and discretion. On average, accrual accounting provides a superior picture to a cash basis accounting for forecasting future cash flows.
- Earnings can be decomposed into cash and accrual components. The accrual component has been found to have less persistence than the cash component and therefore (1) earnings with higher accrual components are less persistent than earnings with smaller accrual components, all else equal, and (2) the cash component of earnings should receive a higher weighting in evaluating company performance.
- Aggregate accruals = Accrual earnings − Cash earnings
- Defining net operating assets as NOAt = [(Total assetst − Casht) − (Total liabilitiest − Total debtt)] one can derive the following balance-sheet-based and cash-flow-statement-based measures of aggregate accruals/the accruals component of earnings:
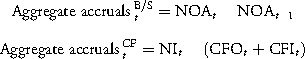
With corresponding scaled measures that can be used as simple measures of financial reporting quality:
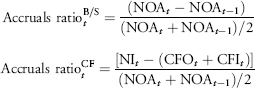
- Aggregate accruals ratios are useful to rank companies for the purpose of evaluating earnings quality. Companies with high (low) accruals ratios are companies with low (high) earnings quality. Companies with low (high) earnings quality tend to experience lower (higher) accounting rates of return and relatively lower excess stock returns in future periods.
- Sources of accounting discretion include choices related to revenue recognition, depreciation choices, inventory choices, choices related to goodwill and other noncurrent assets, choices related to taxes, pension choices, financial asset/liability valuation, and stock option expense estimates.
- A framework for detecting financial reporting problems includes examining reported financials for revenue recognition issues and expense recognition issues.
- Revenue recognition issues include overstatement of revenue, acceleration of revenue, and classification of nonrecurring or nonoperating items as operating revenue.
- Expense recognition issues include understating expenses, deferring expenses, and the classification of ordinary expenses as nonrecurring or nonoperating expenses.
- Discretion related to off-balance sheet liabilities (e.g., in the accounting for leases) and the impairment of goodwill also can affect financial reporting quality.
1. Which of the following mechanisms is least likely to discourage management manipulation of earnings?
A. Debt covenants.
B. Securities regulators.
C. Class action lawsuits.
2. High earnings quality is most likely to:
A. result in steady earnings growth.
B. improve the ability to predict future earnings.
C. be based on conservative accounting choices.
3. The best justification for using accrual-based accounting is that it:
A. reflects the company’s underlying cash flows.
B. reflects the economic nature of a company’s transactions.
C. limits management’s discretion in reporting financial results.
4. The best justification for using cash-based accounting is that it:
A. is more conservative.
B. limits management’s discretion in reporting financial results.
C. matches the timing of revenue recognition with that of associated expenses.
5. Which of the following is not a measure of aggregate accruals?
A. The change in net operating assets.
B. The difference between operating income and net operating assets.
C. The difference between net income and operating and investing cash flows.
6. Consider the following balance sheet information for Profile, Inc.:
| Year Ended 31 December | 2007 | 2006 |
| Cash and short-term investments | 14,000 | 13,200 |
| Total current assets | 21,000 | 20,500 |
| Total assets | 97,250 | 88,000 |
| Current liabilities | 31,000 | 29,000 |
| Total debt | 50,000 | 45,000 |
| Total liabilities | 87,000 | 79,000 |
Profile’s balance-sheet-based accruals ratio in 2007 was closest to:
A. 12.5%.
B. 13.0%.
C. 16.2%.
7. Rodrigue SA reported the following financial statement data for the year ended 2007:
| Average net operating assets | 39,000 |
| Net income | 14,000 |
| Cash flow from operating activity | 17,300 |
| Cash flow from investing activity | (12,400) |
Rodrigue’s cash-flow-based accruals ratio in 2007 was closest to:
A. −8.5%.
B. −19.1%.
C. 23.3%.
8. Cash collected from customers is least likely to differ from sales due to changes in:
A. inventory.
B. deferred revenue.
C. accounts receivable.
9. Reported revenue is most likely to have been reduced by management’s discretionary estimate of:
A. warranty provisions.
B. inventory damage and theft.
C. interest to be earned on credit sales.
10. Zimt AG reports 2007 revenue of €14.3 billion. During 2007, its accounts receivable rose by €0.7 billion, accounts payable increased by €1.1 billion, and unearned revenue increased by €0.5 billion. Its cash collections from customers in 2007 were closest to:
A. €14.1 billion.
B. €14.5 billion.
C. €15.2 billion.
11. Cinnamon Corp. began the year with $12 million in accounts receivable and $31 million in deferred revenue. It ended the year with $15 million in accounts receivable and $27 million in deferred revenue. Based on this information, the accrual-basis earnings included in total revenue were closest to:
A. $1 million.
B. $7 million.
C. $12 million.
12. Which of the following is least likely to be a warning sign of low-quality revenue?
A. A large decrease in deferred revenue.
B. A large increase in accounts receivable.
C. A large increase in the allowance for doubtful accounts.
13. An unexpectedly large reduction in the unearned revenue account is most likely a sign that the company:
A. accelerated revenue recognition.
B. overstated revenue in prior periods.
C. adopted more conservative revenue recognition practices.
14. Canelle SA reported 2007 revenue of €137 million. Its accounts receivable balance began the year at €11 million and ended the year at €16 million. At year-end, €2 million of receivables had been securitized. Canelle’s cash collections from customers (in € millions) in 2007 were closest to:
A. €130.
B. €132.
C. €134.
15. In order to identify possible understatement of expenses with regard to noncurrent assets, an analyst would most likely beware management’s discretion to:
A. accelerate depreciation.
B. increase the residual value.
C. reduce the expected useful life.
16. A sudden rise in inventory balances is least likely to be a warning sign of:
A. understated expenses.
B. accelerated revenue recognition.
C. inefficient working capital management.
17. A warning sign that a company may be deferring expenses is sales revenue growing at a slower rate than:
A. unearned revenue.
B. noncurrent liabilities.
C. property, plant, and equipment.
18. An asset write-down is least likely to indicate understatement of expenses in:
A. prior years.
B. future years.
C. the current year.
19. Ranieri Corp. reported the following 2007 income statement:
| Sales | 93,000 |
| Cost of sales | 24,500 |
| SG&A | 32,400 |
| Interest expense | 800 |
| Other income | 1,400 |
| Income taxes | 14,680 |
| Net income | 22,020 |
Ranieri’s core operating margin in 2007 was closest to:
A. 23.7%.
B. 38.8%.
C. 73.7%.
20. Sebastiani AG reported the following financial results for the years ended 31 December:
| 2007 | 2006 | |
| Sales | 46,574 | 42,340 |
| Cost of sales | 14,000 | 13,000 |
| SGA | 13,720 | 12,200 |
| Operating income | 18,854 | 17,140 |
| Income taxes | 6,410 | 5,656 |
| Net income | 12,444 | 11,484 |
Compared to core operating margin in 2006, Sebastiani’s core operating margin in 2007 was:
A. lower.
B. higher.
C. unchanged.
21. A warning sign that ordinary expenses are now being classified as nonrecurring or nonoperating expenses is:
A. falling core operating margin followed by a spike in positive special items.
B. a spike in positive special items followed by falling core operating margin.
C. falling core operating margin followed by a spike in negative special items.
22. Which of the following obligations must be reported on a company’s balance sheet?
A. Capital leases.
B. Operating leases.
C. Purchase commitments.
23. The most accurate estimate for off-balance sheet financing related to operating leases consists of the sum of:
A. future payments.
B. future payments less a discount to reflect the related interest component.
C. future payments plus a premium to reflect the related interest component.
24. The intangible asset goodwill represents the value of an acquired company that cannot be attached to other tangible assets. This noncurrent asset account is charged to an expense:
A. as amortization.
B. when it becomes impaired.
C. at the time of the acquisition.
25. Total accruals measured using the balance sheet is most likely to differ from total accruals measured using the statement of cash flows when the company has made acquisitions:
A. financed by debt.
B. in exchange for cash.
C. in exchange for stock.
1See, for example, Dechow (1994).
2See, for example, Sloan (1996).
3The content of SFAS 157 is included in FASB ASC Topic 820 [Fair Value Measurements and Disclosures].
4The simplifications include using one line for items that are usually broken down into multiple lines. As examples, “cash and short-term investments” in actual financial statements is often presented in two lines as “cash and cash equivalents” and “short-term investments,” and “Common equity–Total” is analyzed into multiple components (Compustat gives seven lines) including “common stock,” “capital surplus,” “retained earnings,” “accumulated other comprehensive income,” etc.
5A good example of the usefulness of a standardized format relates to the disclosure of depreciation and amortization. Most companies include this charge as part of selling, general, and administrative (SG&A) expenses or cost of goods sold in their regulatory filings. But analysts are able to identify these data from supplemental footnote disclosures, which the data providers capture and then treat systematically.
6Effective after 15 December 2008, U.S. GAAP require noncontrolling (minority) interest to be reported separately from the parent’s equity but within total equity. This is an example of U.S. GAAP and IFRS converging.
7In applying Equations 16.5 and 16.6 for companies reporting under U.S. GAAP, where comparison with non–U.S. GAAP reporting companies is not an issue, analysts may prefer to use IBXIt rather than NIt.
8In particular, IFRS allows operating or financing cash flow treatment of interest paid and dividends paid, whereas U.S. GAAP currently specifies operating cash flow treatment of interest paid and financing cash flow treatment of dividends paid.
9In Panel A, the balance sheet, “deferred taxes” refers to accumulated deferred taxes. In Panel B, the statement of cash flows, “deferred taxes” refers to deferred tax expense related to the single period being reported, 2006. Note also that the concise balance sheet pools cash and cash equivalents and short-term investments into one line so the change in cash and cash equivalents of −2,261 shown in the statement of cash flows cannot be confirmed directly. However, the more detailed balance sheet in the Form 10-K disclosure for Coca-Cola shows that cash and cash equivalents in 2005 to 2006 were $4,701 and $2,440, respectively; as $2,440 − 4,701 = −$2,261, this confirms the value shown in the statement of cash flows.
10See, for example, Sloan (1996).
11Using the indirect method to arrive at cash flow from operating activities, it is appropriate to use net accounts receivable. This implicitly includes the necessary adjustments for bad debt expense and write-offs. Using the direct method, where cash collected from customers is shown as a separate item, gross accounts receivable and actual write-offs are used to adjust revenue to a cash basis.
12Note that the SEC cracked down on abuses of reporting pro forma results back in 2001 with Release Nos. 33-8039, 34-45124, FR-59.
13Using one year as the useful life and a “sum of the months” digit method, the sum of the months over one year totals 78 (1+2+3+···+12 = 78). 12/78 of the amortizable amount would be charged to the first month, 11/78 to the second month, 10/78 to the third month, and so forth.
14Note that the IASB in its 2007 revision to IAS 1 Presentation of Financial Statements has decided to make “cash” rather than “cash and cash equivalents” the basis for presenting the statement of cash flows. See the document FSP-0710b08a-obs at www.iasb.org for more information.
15Purchased in-process research and development costs are the costs of research and development in progress at an acquired company; often part of an acquired company’s purchase price is allocated to such costs.
16A special purpose vehicle is a nonoperating entity created to carry out a specified purpose, such as leasing assets or securitizing receivables. The use of SPVs is frequently related to off-balance sheet financing (financing that does not currently appear on the balance sheet).