CHAPTER 10
LONG-LIVED ASSETS
After completing this reading, you will be able to do the following:
- Distinguish between costs that are capitalized and costs that are expensed in the period in which they are incurred.
- Compare the financial reporting of the following classifications of intangible assets: purchased, internally developed, acquired in a business combination.
- Explain and evaluate the effects on financial statements and ratios of capitalizing versus expensing costs in the period in which they are incurred.
- Describe the different depreciation methods for property, plant, and equipment and the effects of the choice of depreciation method and the assumptions concerning useful life and residual value on depreciation expense, financial statements, and ratios.
- Calculate depreciation expense.
- Describe the different amortization methods for intangible assets with finite lives and the effects of the choice of amortization method and the assumptions concerning useful life and residual value on amortization expense, financial statements, and ratios.
- Calculate amortization expense.
- Describe the revaluation model.
- Describe the impairment of property, plant, and equipment and intangible assets.
- Describe the derecognition of property, plant, and equipment and intangible assets.
- Explain and evaluate the effects on financial statements and ratios of impairment, revaluation, and derecognition of property, plant, and equipment and intangible assets.
- Describe the financial statement presentation of and disclosures relating to property, plant, and equipment and intangible assets.
- Analyze and interpret the financial statement disclosures regarding property, plant, and equipment and intangible assets.
- Compare the financial reporting of investment property with that of property, plant, and equipment.
- Explain and evaluate the effects on financial statements and ratios of leasing assets instead of purchasing them.
- Explain and evaluate the effects on financial statements and ratios of finance leases and operating leases from the perspective of both the lessor and the lessee.
Long-lived assets, also referred to as noncurrent assets or long-term assets, are assets that are expected to provide economic benefits over a future period of time, typically greater than one year.1 Long-lived assets may be tangible, intangible, or financial assets. Examples of long-lived tangible assets, typically referred to as property, plant, and equipment and sometimes as fixed assets, include land, buildings, furniture and fixtures, machinery and equipment, and vehicles; examples of long-lived intangible assets (assets lacking physical substance) include patents and trademarks; and examples of long-lived financial assets include investments in equity or debt securities issued by other companies. The scope of this reading is limited to long-lived tangible and intangible assets (hereafter, referred to for simplicity as long-lived assets).
The first issue in accounting for a long-lived asset is determining its cost at acquisition. The second issue is how to allocate the cost to expense over time. The costs of most long-lived assets are capitalized and then allocated as expenses in the profit or loss (income) statement over the period of time during which they are expected to provide economic benefits. The two main types of long-lived assets with costs that are typically not allocated over time are land, which is not depreciated, and those intangible assets with indefinite useful lives. Additional issues that arise are the treatment of subsequent costs incurred related to the asset, the use of the cost model versus the revaluation model, unexpected declines in the value of the asset, classification of the asset with respect to intent (for example, held for use or held for sale), and the derecognition of the asset.
This reading is organized as follows. Section 2 describes and illustrates accounting for the acquisition of long-lived assets, with particular attention to the impact of capitalizing versus expensing expenditures. Section 3 describes the allocation of the costs of long-lived assets over their useful lives. Section 4 discusses the revaluation model that is based on changes in the fair value of an asset. Section 5 covers the concepts of impairment (unexpected decline in the value of an asset). Section 6 describes accounting for the derecognition of long-lived assets. Section 7 describes financial statement presentation, disclosures, and analysis of long-lived assets. Section 8 discusses differences in financial reporting of investment property compared with property, plant, and equipment. Section 9 describes accounting for leases. A summary is followed by practice problems.
2. ACQUISITION OF LONG-LIVED ASSETS
Upon acquisition, property, plant, and equipment (tangible assets with an economic life of longer than one year and intended to be held for the company’s own use) are recorded on the balance sheet at cost, which is typically the same as their fair value.2 Accounting for an intangible asset depends on how the asset is acquired. If several assets are acquired as part of a group, the purchase price is allocated to each asset on the basis of its fair value. An asset’s cost potentially includes expenditures additional to the purchase price.
A key concept in accounting for expenditures related to long-lived assets is whether and when such expenditures are capitalized (i.e., included in the asset shown on the balance sheet) versus expensed (i.e., treated as an expense of the period on the income statement). After examining the specific treatment of certain expenditures, we will consider the general financial statement impact of capitalizing versus expensing and two analytical issues related to the decision—namely, the effects on an individual company’s trend analysis and on comparability across companies.
2.1. Property, Plant, and Equipment
This section primarily discusses the accounting treatment for the acquisition of long-lived tangible assets (property, plant, and equipment) through purchase. Assets can be acquired by methods other than purchase.3 When an asset is exchanged for another asset, the asset acquired is recorded at fair value if reliable measures of fair value exist. Fair value is the fair value of the asset given up unless the fair value of the asset acquired is more clearly evident. If there is no reliable measure of fair value, the acquired asset is measured at the carrying amount of the asset given up. In this case, the carrying amount of the assets is unchanged, and no gain or loss is reported.
Typically, accounting for the exchange involves removing the carrying amount of the asset given up, adding a fair value for the asset acquired, and reporting any difference between the carrying amount and the fair value as a gain or loss. A gain would be reported when the fair value used for the newly acquired asset exceeds the carrying amount of the asset given up. A loss would be reported when the fair value used for the newly acquired asset is less than the carrying amount of the asset given up.
When property, plant, or equipment is purchased, the buyer records the asset at cost. In addition to the purchase price, the buyer also includes, as part of the cost of an asset, all the expenditures necessary to get the asset ready for its intended use. For example, freight costs borne by the purchaser to get the asset to the purchaser’s place of business and special installation and testing costs required to make the asset usable are included in the total cost of the asset.
Subsequent expenditures related to long-lived assets are included as part of the recorded value of the assets on the balance sheet (i.e., capitalized) if they are expected to provide benefits beyond one year in the future and are expensed if they are not expected to provide benefits in future periods. Expenditures that extend the original life of the asset are typically capitalized. Example 10-1 illustrates the difference between costs that are capitalized and costs that are expensed in a period.
EXAMPLE 10-1 Acquisition of PPE
Assume a (hypothetical) company, Trofferini S. A., incurred the following expenditures to purchase a towel and tissue roll machine: €10,900 purchase price including taxes, €200 for delivery of the machine, €300 for installation and testing of the machine, and €100 to train staff on maintaining the machine. In addition, the company paid a construction team €350 to reinforce the factory floor and ceiling joists to accommodate the machine’s weight. The company also paid €1,500 to repair the factory roof (a repair expected to extend the useful life of the factory by five years) and €1,000 to have the exterior of the factory and adjoining offices repainted for maintenance reasons. The repainting neither extends the life of factory and offices nor improves their usability.
1. Which of these expenditures will be capitalized and which will be expensed?
2. How will the treatment of these expenditures affect the company’s financial statements?
Solution to 1: The company will capitalize as part of the cost of the machine all costs that are necessary to get the new machine ready for its intended use: €10,900 purchase price, €200 for delivery, €300 for installation and testing, and €350 to reinforce the factory floor and ceiling joists to accommodate the machine’s weight (which was necessary to use the machine and does not increase the value of the factory). The €100 to train staff is not necessary to get the asset ready for its intended use and will be expensed.
The company will capitalize the expenditure of €1,500 to repair the factory roof because the repair is expected to extend the useful life of the factory. The company will expense the €1,000 to have the exterior of the factory and adjoining offices repainted because the painting does not extend the life or alter the productive capacity of the buildings.
Solution to 2: The costs related to the machine that are capitalized—€10,900 purchase price, €200 for delivery, €300 for installation and testing, and €350 to prepare the factory—will increase the carrying amount of the machine asset as shown on the balance sheet and will be included as investing cash outflows. The item related to the factory that is capitalized—the €1,500 roof repair—will increase the carrying amount of the factory asset as shown on the balance sheet and is an investing cash outflow. The expenditures of €100 to train staff and €1,000 to paint are expensed in the period and will reduce the amount of income reported on the company’s income statement (and thus reduce retained earnings on the balance sheet) and the operating cash flow.
Example 10-1 describes capitalizing versus expensing in the context of purchasing property, plant, and equipment. When a company constructs an asset (or acquires an asset that requires a long period of time to get ready for its intended use), borrowing costs incurred directly related to the construction are generally capitalized. Constructing a building, whether for sale (in which case, the building is classified as inventory) or for the company’s own use (in which case, the building is classified as a long-lived asset), typically requires a substantial amount of time. To finance construction, any borrowing costs incurred prior to the asset being ready for its intended use are capitalized as part of the cost of the asset. The company determines the interest rate to use on the basis of its existing borrowings or, if applicable, on a borrowing specifically incurred for constructing the asset. If a company takes out a loan specifically to construct a building, the interest cost on that loan during the time of construction would be capitalized as part of the building’s cost. Under IFRS, but not under U.S. GAAP, income earned on temporarily investing the borrowed monies decreases the amount of borrowing costs eligible for capitalization.
Thus, a company’s interest costs for a period are included either on the balance sheet (to the extent they are capitalized as part of an asset) or on the income statement (to the extent they are expensed). If the interest expenditure is incurred in connection with constructing an asset for the company’s own use, the capitalized interest appears on the balance sheet as a part of the relevant long-lived asset (i.e., property, plant, and equipment). The capitalized interest is expensed over time as the property is depreciated and is thus part of subsequent years’ depreciation expense rather than interest expense of the current period. If the interest expenditure is incurred in connection with constructing an asset to sell (for example, by a home builder), the capitalized interest appears on the company’s balance sheet as part of inventory. The capitalized interest is expensed as part of the cost of goods sold when the asset is sold. Interest payments made prior to completion of construction that are capitalized are classified as an investing cash outflow. Expensed interest may be classified as an operating or financing cash outflow under IFRS and is classified as an operating cash outflow under U.S. GAAP.
EXAMPLE 10-2 Capitalized Borrowing Costs
BILDA S. A., a hypothetical company, borrows €1,000,000 at an interest rate of 10 percent per year on 1 January 2010 to finance the construction of a factory that will have a useful life of 40 years. Construction is completed after two years, during which time the company earns €20,000 by temporarily investing the loan proceeds.
1. What is the amount of interest that will be capitalized under IFRS, and how would that amount differ from the amount that would be capitalized under U.S. GAAP?
2. Where will the capitalized borrowing cost appear on the company’s financial statements?
Solution to 1: The total amount of interest paid on the loan during construction is €200,000 (= €1,000,000 × 10% × 2 years). Under IFRS, the amount of borrowing cost eligible for capitalization is reduced by the €20,000 interest income from temporarily investing the loan proceeds, so the amount to be capitalized is €180,000. Under U.S. GAAP, the amount to be capitalized is €200,000.
Solution to 2: The capitalized borrowing costs will appear on the company’s balance sheet as a component of property, plant, and equipment. In the years prior to completion of construction, the interest paid will appear on the statement of cash flows as an investment activity. Over time, as the property is depreciated, the capitalized interest component is part of subsequent years’ depreciation expense on the company’s income statement.
2.2. Intangible Assets
Intangible assets are assets lacking physical substance. Intangible assets include items that involve exclusive rights, such as patents, copyrights, trademarks, and franchises. Under IFRS, identifiable intangible assets must meet three definitional criteria. They must be (1) identifiable (either capable of being separated from the entity or arising from contractual or legal rights), (2) under the control of the company, and (3) expected to generate future economic benefits. In addition, two recognition criteria must be met: (1) It is probable that the expected future economic benefits of the asset will flow to the company, and (2) the cost of the asset can be reliably measured. Goodwill, which is not considered an identifiable intangible asset,4 arises when one company purchases another and the acquisition price exceeds the fair value of the identifiable assets (both the tangible assets and the identifiable intangible assets) acquired.
Accounting for an intangible asset depends on how it is acquired. The following sections describe accounting for intangible assets obtained in three ways: purchased in situations other than business combinations, developed internally, and acquired in business combinations.
2.2.1. Intangible Assets Purchased in Situations Other Than Business Combinations
Intangible assets purchased in situations other than business combinations, such as buying a patent, are treated at acquisition the same as long-lived tangible assets; they are recorded at their fair value when acquired, which is assumed to be equivalent to the purchase price. If several intangible assets are acquired as part of a group, the purchase price is allocated to each asset on the basis of its fair value.
In deciding how to treat individual intangible assets for analytical purposes, analysts are particularly aware that companies must use a substantial amount of judgment and numerous assumptions to determine the fair value of individual intangible assets. For analysis, therefore, understanding the types of intangible assets acquired can often be more useful than focusing on the values assigned to the individual assets. In other words, an analyst would typically be more interested in understanding what assets a company acquired (for example, franchise rights and a mailing list) than in the precise portion of the purchase price a company allocated to each asset. Understanding the types of assets a company acquires can offer insights into the company’s strategic direction and future operating potential.
2.2.2. Intangible Assets Developed Internally
In contrast with the treatment of construction costs of tangible assets, the costs to internally develop intangible assets are generally expensed when incurred. There are some situations, however, in which the costs incurred to internally develop an intangible asset are capitalized. The general analytical issues related to the capitalizing-versus-expensing decision apply here—namely, comparability across companies and the effect on an individual company’s trend analysis.
The general requirement that costs to internally develop intangible assets be expensed should be compared with capitalizing the cost of acquiring intangible assets in situations other than business combinations. Because costs associated with internally developing intangible assets are usually expensed, a company that has internally developed such intangible assets as patents, copyrights, or brands through expenditures on R&D or advertizing will recognize a lower amount of assets than a company that has obtained intangible assets through external purchase. In addition, on the statement of cash flows, costs of internally developing intangible assets are classified as operating cash outflows whereas costs of acquiring intangible assets are classified as investing cash outflows. Differences in strategy (developing versus acquiring intangible assets) can thus impact financial ratios.
IFRS require that expenditures on research (or during the research phase of an internal project) be expensed rather than capitalized as an intangible asset.5 Research is defined as “original and planned investigation undertaken with the prospect of gaining new scientific or technical knowledge and understanding.”6 The “research phase of an internal project” refers to the period during which a company cannot demonstrate that an intangible asset is being created—for example, the search for alternative materials or systems to use in a production process. IFRS allow companies to recognize an intangible asset arising from development (or the development phase of an internal project) if certain criteria are met, including a demonstration of the technical feasibility of completing the intangible asset and the intent to use or sell the asset. Development is defined as “the application of research findings or other knowledge to a plan or design for the production of new or substantially improved materials, devices, products, processes, systems or services before the start of commercial production or use.”7
Generally, U.S. GAAP require that both research and development costs be expensed as incurred but require capitalization of certain costs related to software development.8 Costs incurred to develop a software product for sale are expensed until the product’s technological feasibility is established and are capitalized thereafter. Similarly, companies expense costs related to the development of software for internal use until it is probable that the project will be completed and that the software will be used as intended. Thereafter, development costs are capitalized. The probability that the project will be completed is easier to demonstrate than is technological feasibility. The capitalized costs, related directly to developing software for sale or internal use, include the costs of employees who help build and test the software. The treatment of software development costs under U.S. GAAP is similar to the treatment of all costs of internally developed intangible assets under IFRS.
EXAMPLE 10-3 Software Development Costs
Assume REH AG, a hypothetical company, incurs expenditures of €1,000 per month during the fiscal year ended 31 December 2009 to develop software for internal use. Under IFRS, the company must treat the expenditures as an expense until the software meets the criteria for recognition as an intangible asset, after which time the expenditures can be capitalized as an intangible asset.
1. What is the accounting impact of the company being able to demonstrate that the software met the criteria for recognition as an intangible asset on 1 February versus 1 December?
2. How would the treatment of expenditures differ if the company reported under U.S. GAAP and it had established in 2008 that the project was likely to be completed?
Solution to 1: If the company is able to demonstrate that the software met the criteria for recognition as an intangible asset on 1 February, the company would recognize €1,000 of expense (on the income statement) during the fiscal year ended 31 December 2009. The other €11,000 of expenditures would be recognized as an intangible asset (on the balance sheet). Alternatively, if the company is not able to demonstrate that the software met the criteria for recognition as an intangible asset until 1 December, the company would recognize €11,000 of expense during the fiscal year ended 31 December 2009, with the other €1,000 of expenditures recognized as an intangible asset.
Solution to 2: Under U.S. GAAP, the company would capitalize the entire €12,000 spent to develop software for internal use.
2.2.3. Intangible Assets Acquired in a Business Combination
When one company acquires another company, the transaction is accounted for using the acquisition method of accounting.9 Under the acquisition method, the company identified as the acquirer allocates the purchase price to each asset acquired (and each liability assumed) on the basis of its fair value. If the purchase price exceeds the sum of the amounts that can be allocated to individual identifiable assets and liabilities, the excess is recorded as goodwill. Goodwill cannot be identified separately from the business as a whole.
Under IFRS, the acquired individual assets include identifiable intangible assets that meet the definitional and recognition criteria.10 Otherwise, if the item is acquired in a business combination and cannot be recognized as a tangible or identifiable intangible asset, it is recognized as goodwill. Under U.S. GAAP, there are two criteria to judge whether an intangible asset acquired in a business combination should be recognized separately from goodwill: The asset must be either an item arising from contractual or legal rights or an item that can be separated from the acquired company. Examples of intangible assets treated separately from goodwill include the intangible assets previously mentioned that involve exclusive rights (patents, copyrights, franchises, licenses), as well as such items as internet domain names and video and audiovisual materials.
Exhibit 10-1 describes how InBev allocated the €40.3 billion purchase price for its acquisition of Anheuser-Busch. The majority of the identifiable intangible asset valuation (€16.473 billion) relates to brands with indefinite life. Another €256 million or €0.256 billion was for the identifiable intangible assets with definite useful lives—distribution agreements and favorable contracts. These assets are being amortized over the life of the associated contracts. In addition, €24.7 billion of goodwill was recognized.
EXHIBIT 10-1 Acquisition of Intangible Assets through a Business Combination
| Excerpt from the 2008 annual report of AB InBev (BRU: ABI): |
| On 18 November, InBev has completed the acquisition of Anheuser-Busch, following approval from shareholders of both companies.. . . Effective the date of the closing, InBev has changed its name to AB InBev to reflect the heritage and traditions of Anheuser-Busch. Under the terms of the merger agreement, all shares of Anheuser-Busch were acquired for 70 U.S. dollar per share in cash for an aggregate amount of approximately 52.5b U.S. dollar or 40.3b euro. |
| The transaction resulted in 24.7b euro goodwill provisionally allocated primarily to the U.S. business on the basis of expected synergies.. . . The valuation of the property, plant and equipment, intangible assets, investment in associates, interest bearing loans and borrowings and employee benefits is based on the valuation performed by independent valuation specialist. The other assets and liabilities are based on the current best estimates of AB InBev’s management. |
| The majority of the intangible asset valuation relates to brands with indefinite life. The valuation of the brands with indefinite life is based on a series of factors, including the brand history, the operating plan and the countries in which the brands are sold. The brands with indefinite life include the Budweiser family (including Bud and Bud Light), the Michelob brand family, the Busch brand family and the Natural brand family and have been fair valued for a total amount of 16,473m euro. Distribution agreements and favorable contracts have been fair valued for a total amount of 256m euro. These are being amortised over the term of the associated contracts ranging from 3 to 18 years. |
Source: AB InBev 2008 Annual Report, pp. 74–75.
2.3. Capitalizing versus Expensing—Impact on Financial Statements and Ratios
This section discusses the implications for financial statements and ratios of capitalizing versus expensing costs in the period in which they are incurred. We first summarize the general financial statement impact of capitalizing versus expensing and two analytical issues related to the decision—namely the effect on an individual company’s trend analysis and on comparability across companies.
In the period of the expenditure, an expenditure that is capitalized increases the amount of assets on the balance sheet and appears as an investing cash outflow on the statement of cash flows. In subsequent periods, a company allocates the capitalized amount over the asset’s useful life as depreciation or amortization expense (except assets that are not depreciated, i.e., land, or amortized, e.g., intangible assets with indefinite lives). This expense reduces net income on the income statement and reduces the value of the asset on the balance sheet. Depreciation and amortization are noncash expenses and therefore, apart from their effect on taxable income and taxes payable, have no impact on the cash flow statement. In the section of the statement of cash flows that reconciles net income to operating cash flow, depreciation and amortization expenses are added back to net income.
Alternatively, an expenditure that is expensed reduces net income by the after-tax amount of the expenditure in the period it is made. No asset is recorded on the balance sheet and thus no depreciation or amortization occurs in subsequent periods. The lower amount of net income is reflected in lower retained earnings on the balance sheet. An expenditure that is expensed appears as an operating cash outflow in the period it is made. There is no effect on the financial statements of subsequent periods.
Example 10-4 illustrates the impact on the financial statements of capitalizing versus expensing an expenditure.
EXAMPLE 10-4 General Financial Statement Impact of Capitalizing versus Expensing
Assume two identical (hypothetical) companies, CAP Inc. (CAP) and NOW Inc. (NOW), start with €1,000 cash and €1,000 common stock. Each year the companies recognize total revenues of €1,500 cash and make cash expenditures, excluding an equipment purchase, of €500. At the beginning of operations, each company pays €900 to purchase equipment. CAP estimates the equipment will have a useful life of three years and an estimated salvage value of €0 at the end of the three years. NOW estimates a much shorter useful life and expenses the equipment immediately. The companies have no other assets and make no other asset purchases during the three-year period. Assume the companies pay no dividends, earn zero interest on cash balances, have a tax rate of 30 percent, and use the same accounting method for financial and tax purposes.
The left side of Exhibit 10-2 shows CAP’s financial statements; that is, with the expenditure capitalized and depreciated at €300 per year based on the straight-line method of depreciation (€900 cost minus €0 salvage value equals €900, divided by a three-year life equals €300 per year). The right side of the exhibit shows NOW’s financial statements, with the entire €900 expenditure treated as an expense in the first year. All amounts are in euro.
EXHIBIT 10-2 Capitalizing versus Expensing
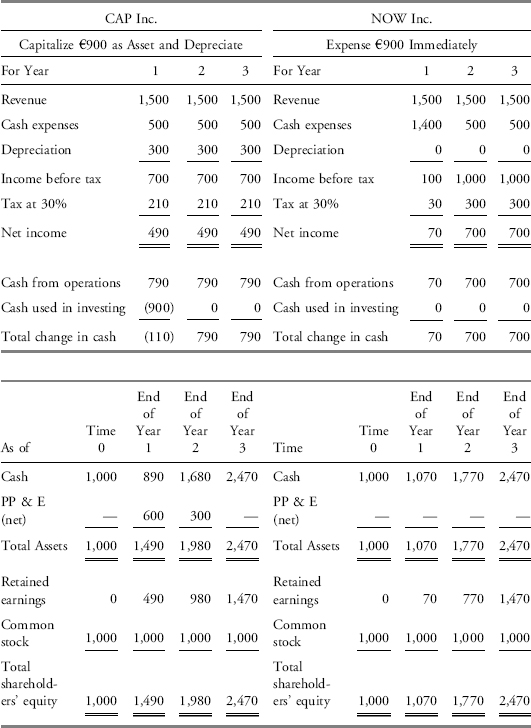
1. Which company reports higher net income over the three years? Total cash flow? Cash from operations?
2. Based on ROE and net profit margin, how does the profitability of the two companies compare?
3. Why does NOW report change in cash of €70 in Year 1, while CAP reports total change in cash of (€110)?
Solution to 1: Neither company reports higher total net income or cash flow over the three years. The sum of net income over the three years is identical (€1,470 total) whether the €900 is capitalized or expensed. Also, the sum of the change in cash (€1,470 total) is identical under either scenario. CAP reports higher cash from operations by an amount of €900 because, under the capitalization scenario, the €900 purchase is treated as an investing cash flow.
Note: Because the companies use the same accounting method for both financial and taxable income, absent the assumption of zero interest on cash balances, expensing the €900 would have resulted in higher income and cash flow for NOW because the lower taxes paid in the first year (€30 versus €210) would have allowed NOW to earn interest income on the tax savings.
Solution to 2: In general, Ending shareholders’ equity = Beginning shareholders’ equity+Net income+Other comprehensive income − Dividends+Net capital contributions from shareholders. Because the companies in this example do not have other comprehensive income, did not pay dividends, and reported no capital contributions from shareholders, Ending retained earnings = Beginning retained earnings+Net income, and Ending shareholders’ equity = Beginning shareholders’ equity+Net income.
ROE is calculated as Net income divided by Average shareholders’ equity, and Net profit margin is calculated as Net income divided by Total revenue. For example, CAP had Year 1 ROE of 39 percent (€490/[(€1,000+€1,490)/2]), and Year 1 net profit margin of 33 percent (€490/€1,500).
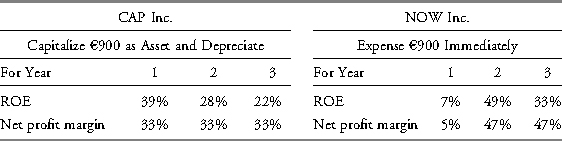
As shown, capitalizing results in higher profitability ratios (ROE and net profit margin) in the first year, and lower profitability ratios in subsequent years. For example, CAP’s Year 1 ROE of 39 percent was higher than NOW’s Year 1 ROE of 7 percent, but in Years 2 and 3, NOW reports superior profitability.
Note also that NOW’s superior growth in net income between Year 1 and Year 2 is not attributable to superior performance compared to CAP but rather to the accounting decision to recognize the expense sooner than CAP. In general, all else equal, accounting decisions that result in recognizing expenses sooner will give the appearance of greater subsequent growth. Comparison of the growth of the two companies’ net incomes without an awareness of the difference in accounting methods would be misleading. As a corollary, NOW’s income and profitability exhibit greater volatility across the three years, not because of more volatile performance but rather because of the different accounting decision.
Solution to 3: NOW reports an increase in cash of €70 in Year 1, while CAP reports a decrease in cash of €110 because NOW’s taxes were €180 lower than CAP’s taxes (€30 versus €210).
Note that this problem assumes the accounting method used by each company for its tax purposes is identical to the accounting method used by the company for its financial reporting. In many countries, companies are allowed to use different depreciation methods for financial reporting and taxes, which may give rise to deferred taxes.
As shown, discretion regarding whether to expense or capitalize expenditures can impede comparability across companies. Example 10-4 assumes the companies purchase a single asset in one year. Because the sum of net income over the three-year period is identical whether the asset is capitalized or expensed, it illustrates that although capitalizing results in higher profitability compared to expensing in the first year, it results in lower profitability ratios in the subsequent years. Conversely, expensing results in lower profitability in the first year but higher profitability in later years, indicating a favorable trend.
Similarly, shareholders’ equity for a company that capitalizes the expenditure will be higher in the early years because the initially higher profits result in initially higher retained earnings. Example 10-4 assumes the companies purchase a single asset in one year and report identical amounts of total net income over the three-year period, so shareholders’ equity (and retained earnings) for the firm that expenses will be identical to shareholders’ equity (and retained earnings) for the capitalizing firm at the end of the three-year period.
Although Example 10-4 shows companies purchasing an asset only in the first year, if a company continues to purchase similar or increasing amounts of assets each year, the profitability-enhancing effect of capitalizing continues if the amount of the expenditures in a period continues to be more than the depreciation expense. Example 10-5 illustrates this point.
EXAMPLE 10-5 Impact of Capitalizing versus Expensing for Ongoing Purchases
A company buys a £300 computer in Year 1 and capitalizes the expenditure. The computer has a useful life of three years and an expected salvage value of £0, so the annual depreciation expense using the straight-line method is £100 per year. Compared to expensing the entire £300 immediately, the company’s pretax profit in Year 1 is £200 greater.
1. Assume that the company continues to buy an identical computer each year at the same price. If the company uses the same accounting treatment for each of the computers, when does the profit-enhancing effect of capitalizing versus expensing end?
2. If the company buys another identical computer in Year 4, using the same accounting treatment as the prior years, what is the effect on Year 4 profits of capitalizing versus expensing these expenditures?
Solution to 1: The profit-enhancing effect of capitalizing versus expensing would end in Year 3. In Year 3, the depreciation expense on each of the three computers bought in Years 1, 2, and 3 would total £300 (£100+£100+£100). Therefore, the total depreciation expense for Year 3 will be exactly equal to the capital expenditure in Year 3. The expense in Year 3 would be £300, regardless of whether the company capitalized or expensed the annual computer purchases.
Solution to 2: There is no impact on Year 4 profits. As in the previous year, the depreciation expense on each of the three computers bought in Years 2, 3, and 4 would total £300 (£100+£100+£100). Therefore, the total depreciation expense for Year 4 will be exactly equal to the capital expenditure in Year 4. Pretax profits would be reduced by £300, regardless of whether the company capitalized or expensed the annual computer purchases.
Compared to expensing an expenditure, capitalizing the expenditure typically results in greater amounts reported as cash from operations. Capitalized expenditures are typically treated as an investment cash outflow whereas expenses reduce operating cash flows. Because cash flow from operating activities is an important consideration in some valuation models, companies may try to maximize reported cash flow from operations by capitalizing expenditures that should be expensed. Valuation models that use free cash flow will consider not only operating cash flows but also investing cash flows. Analysts should be alert to evidence of companies manipulating reported cash flow from operations by capitalizing expenditures that should be expensed.
In summary, holding all else constant, capitalizing an expenditure enhances current profitability and increases reported cash flow from operations. The profitability-enhancing effect of capitalizing continues so long as capital expenditures exceed the depreciation expense. Profitability-enhancing motivations for decisions to capitalize should be considered when analyzing performance. For example, a company may choose to capitalize more expenditures (within the allowable bounds of accounting standards) to achieve earnings targets for a given period. Expensing a cost in the period reduces current period profits but enhances future profitability and thus enhances the profit trend. Profit trend-enhancing motivations should also be considered when analyzing performance. If the company is in a reporting environment which requires identical accounting methods for financial reporting and taxes (unlike the United States, which permits companies to use depreciation methods for reporting purposes that differ from the depreciation method required by tax purposes), then expensing will have a more favorable cash flow impact because paying lower taxes in an earlier period creates an opportunity to earn interest income on the cash saved.
In contrast with the relatively simple examples given previously, it is generally neither possible nor desirable to identify individual instances involving discretion about whether to capitalize or expense expenditures. An analyst can, however, typically identify significant items of expenditure treated differently across companies. The items of expenditure giving rise to the most relevant differences across companies will vary by industry. This cross-industry variation is apparent in the following discussion of the capitalization of expenditures.
2.4. Capitalization of Interest Costs
As noted earlier, companies generally must capitalize interest costs associated with acquiring or constructing an asset that requires a long period of time to get ready for its intended use.11 As a consequence of this accounting treatment, a company’s interest costs for a period can appear either on the balance sheet (to the extent they are capitalized) or on the income statement (to the extent they are expensed).
If the interest expenditure is incurred in connection with constructing an asset for the company’s own use, the capitalized interest appears on the balance sheet as a part of the relevant long-lived asset. The capitalized interest is expensed over time as the property is depreciated—and is thus part of depreciation expense rather than interest expense. If the interest expenditure is incurred in connection with constructing an asset to sell, for example by a real estate construction company, the capitalized interest appears on the company’s balance sheet as part of inventory. The capitalized interest is then expensed as part of the cost of sales when the asset is sold.
The treatment of capitalized interest poses certain issues that analysts should consider. First, capitalized interest appears as part of investing cash outflows, whereas expensed interest reduces operating cash flow. Although the treatment is consistent with accounting standards, an analyst may want to examine the impact on reported cash flows. Second, interest coverage ratios are solvency indicators measuring the extent to which a company’s earnings (or cash flow) in a period covered its interest costs. To provide a true picture of a company’s interest coverage, the entire amount of interest expenditure, both the capitalized portion and the expensed portion, should be used in calculating interest coverage ratios. Additionally, if a company is depreciating interest that it capitalized in a previous period, income should be adjusted to eliminate the effect of that depreciation. Example 10-6 illustrates the calculation.
EXAMPLE 10-6 Effect of Capitalized Interest Costs on Coverage Ratios and Cash Flow
MTR Gaming Group, Inc. (NasdaqGS: MNTG) disclosed the following information in one of the footnotes to its financial statements: “Interest is allocated and capitalized to construction in progress by applying our cost of borrowing rate to qualifying assets. Interest capitalized in 2007 and 2006 was $2.2 million and $6.0 million, respectively. There was no interest capitalized during 2008.”(Form 10-K filed 13 March 2009).
EXHIBIT 10-3 MTR Gaming Group Selected Data, as Reported (dollars in thousands)
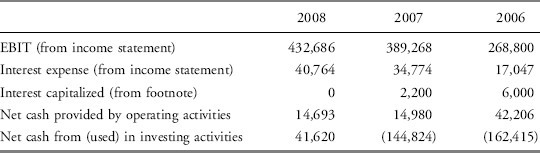
1. Calculate and interpret MTR’s interest coverage ratio with and without capitalized interest. Assume that capitalized interest increases depreciation expense by $475 thousand in 2008 and 2007, and by $365 thousand in 2006.
2. Calculate MTR’s percentage change in operating cash flow from 2006 to 2007 and from 2007 to 2008. Assuming the financial reporting does not affect reporting for income taxes, what were the effects of capitalized interest on operating and investing cash flows?
Solution to 1: MTR did not capitalize any interest during 2008, so the interest coverage ratio for this year is affected only by depreciation expense related to previously capitalized interest. The interest coverage ratio, measured as earnings before interest and taxes (EBIT) divided by interest expense, was as follows for 2008:
10.61 ($432,686 ÷ $40,764) for 2008 without adjusting for capitalized interest
10.63 [($432,686+ $475)÷ $40,764] including an adjustment to EBIT for depreciation of previously capitalized interest
For the years 2007 and 2006, interest coverage ratios with and without capitalized interest were as follows:
For 2007
11.19 ($389,268÷ $34,774) without adjusting for capitalized interest; and
10.54 [($389,268+$475) ÷($34,774+$2,200)] including an adjustment to EBIT for depreciation of previously capitalized interest and an adjustment to interest expense for the amount of interest capitalized in 2007.
For 2006
15.77 ($268,800÷ $17,047) without adjusting for capitalized interest; and
11.68 [($268,800+$365) ÷ ($17,047+$6,000)] including an adjustment to EBIT for depreciation of previously capitalized interest and an adjustment to interest expense for the amount of interest capitalized in 2006.
Because MTR capitalizes interest in previous years, EBIT is adjusted by adding in depreciation expense due to capitalized interest costs.
The earlier calculations indicate that MTR’s interest coverage deteriorated over the three-year period from 2006 to 2008, even with no adjustments for capitalized interest. In both 2006 and 2007, the coverage ratio is lower when adjusted for capitalized interest. For 2006, the interest coverage ratio of 11.68 that includes capitalized interest is substantially lower than the ratio without capitalized interest.
Solution to 2: If the interest had been expensed rather than capitalized, operating cash flows would have been substantially lower in 2006, slightly lower in 2007, but unchanged in 2008. If the interest had been expensed rather than capitalized, the trend—at least in the last two years—would have been more favorable; operating cash flows would have increased rather than decreased over the 2007 to 2008 period. On an unadjusted basis, for 2008 compared with 2007, MTR’s operating cash flow declined by 1.9 percent [($14,693÷ $14,980) − 1]. If the $2,200 of interest had been expensed rather than capitalized in 2007, the change in operating cash flow would have been positive, 15.0 percent {[$14,693 ÷ ($14,980 − $2,200)] − 1}.
If interest had been expensed rather than capitalized, the amount of cash outflow for investing activities would have been lower in 2006 and 2007 but unaffected in 2008. The percentage decline in cash outflows for investing activities from 2006 to 2007 would have been slightly smaller excluding capitalized interest from investing activities, 8.8 percent {[($144,824 − $2,200) ÷ ($162,415 − $6,000)] − 1}.
The treatment of capitalized interest raises issues for consideration by an analyst. First, capitalized interest appears as part of investing cash outflows, whereas expensed interest reduces operating or financing cash flow under IFRS and operating cash flow under U.S. GAAP. An analyst may want to examine the impact on reported cash flows of interest expenditures when comparing companies. Second, interest coverage ratios are solvency indicators measuring the extent to which a company’s earnings (or cash flow) in a period covered its interest costs. To provide a true picture of a company’s interest coverage, the entire amount of interest, both the capitalized portion and the expensed portion, should be used in calculating interest coverage ratios.
Generally, including capitalized interest in the calculation of interest coverage ratios provides a better assessment of a company’s solvency. In assigning credit ratings, rating agencies include capitalized interest in coverage ratios. For example, Standard & Poor’s calculates the EBIT interest coverage ratio as EBIT divided by gross interest (defined as interest prior to deductions for capitalized interest or interest income).
Maintaining a minimum interest coverage ratio is a financial covenant often included in lending agreements, for example, bank loans and bond indentures. The definition of the coverage ratio can be found in the company’s credit agreement. The definition is relevant because treatment of capitalized interest in calculating coverage ratios would affect an assessment of how close a company’s actual ratios are to the levels specified by its financial covenants and thus the probability of breaching those covenants.
2.5. Capitalization of Internal Development Costs
As noted previously, accounting standards require companies to capitalize software development costs after a product’s feasibility is established. Despite this requirement, judgment in determining feasibility means that companies’ capitalization practices may differ. For example, as illustrated in Exhibit 10-4, Microsoft judges product feasibility to be established very shortly before manufacturing begins and, therefore, effectively expenses—rather than capitalizes—research and development costs.
EXHIBIT 10-4 Disclosure on Software Development Costs
| Excerpt from Management’s Discussion and Analysis (MD&A) of Microsoft Corporation (NasdaqGS: MSFT), Application of Critical Accounting Policies, Research and Development Costs: |
| SFAS No.86 specifies that costs incurred internally in researching and developing a computer software product should be charged to expense until technological feasibility has been established for the product. Once technological feasibility is established, all software costs should be capitalized until the product is available for general release to customers. Judgment is required in determining when technological feasibility of a product is established. We have determined that technological feasibility for our software products is reached after all high-risk development issues have been resolved through coding and testing. Generally, this occurs shortly before the products are released to manufacturing. The amortization of these costs is included in cost of revenue over the estimated life of the products. |
Source: Microsoft Corporation Annual Report 2009, p. 36.
Expensing rather than capitalizing development costs results in lower net income in the current period. Expensing rather than capitalizing will continue to result in lower net income so long as the amount of the current-period development expenses is higher than the amortization expense that would have resulted from amortizing prior periods’ capitalized development costs—the typical situation when a company’s development costs are increasing. On the statement of cash flows, expensing rather than capitalizing development costs results in lower net operating cash flows and higher net investing cash flows. This is because the development costs are reflected as operating cash outflows rather than investing cash outflows.
In comparing the financial performance of a company that expenses most or all software development costs, such as Microsoft, with another company that capitalizes software development costs, adjustments can be made to make the two comparable. For the company that capitalizes software development costs, an analyst can adjust (a) the income statement to include software development costs as an expense and to exclude amortization of prior years’ software development costs; (b) the balance sheet to exclude capitalized software (decrease assets and equity); and (c) the statement of cash flows to decrease operating cash flows and decrease cash used in investing by the amount of the current period development costs. Any ratios that include income, long-lived assets, or cash flow from operations—such as return on equity—will also be affected.
EXAMPLE 10-7 Software Development Costs
You are working on a project involving the analysis of JHH Software, a (hypothetical) software development company that established technical feasibility for its first product in 2007. Part of your analysis involves computing certain market-based ratios, which you will use to compare JHH to another company that expenses all of its software development expenditures. Relevant data and excerpts from the company’s annual report are included in Exhibit 10-5.
EXHIBIT 10-5 JHH SOFTWARE (dollars in thousands, except per-share amounts)
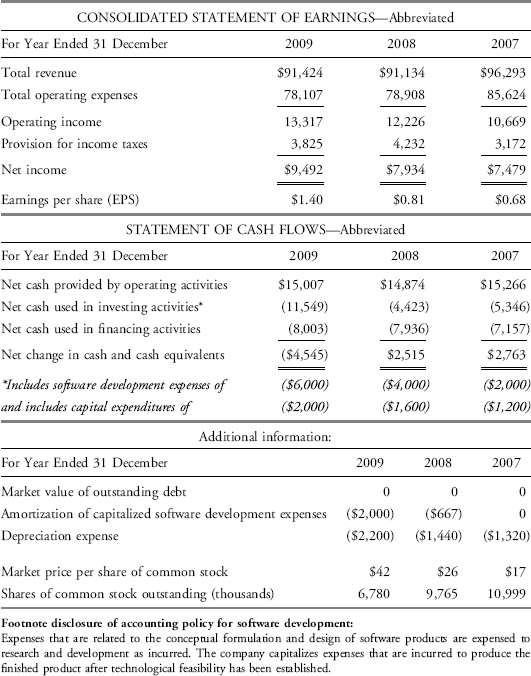
1. Compute the following ratios for JHH based on the reported financial statements for fiscal year ended 31 December 2009, with no adjustments. Next, determine the approximate impact on these ratios if the company had expensed rather than capitalized its investments in software. (Assume the financial reporting does not affect reporting for income taxes. There would be no change in the effective tax rate.)
A. P/E: Price/Earnings per share
B. P/CFO: Price/Operating cash flow per share
C. EV/EBITDA: Enterprise value/EBITDA, where enterprise value is defined as the total market value of all sources of a company’s financing, including equity and debt, and EBITDA is earnings before interest, taxes, depreciation, and amortization.
2. Interpret the changes in the ratios.
Solution to 1: (Dollars are in thousands, except per-share amounts.) JHH’s 2009 ratios are presented in the following table:
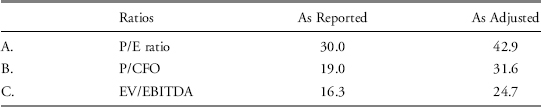
A. Based on the information as reported, the P/E ratio was 30.0 ($42 ÷ $1.40). Based on EPS adjusted to expense software development costs, the P/E ratio was 42.9 ($42 ÷ $0.98).
- Price: Assuming that the market value of the company’s equity is based on its fundamentals, the price per share is $42, regardless of a difference in accounting.
- EPS: As reported, EPS was $1.40. Adjusted EPS was $0.98. Expensing software development costs would have reduced JHH’s 2009 operating income by $6,000, but the company would have reported no amortization of prior years’ software costs, which would have increased operating income by $2,000. The net change of $4,000 would have reduced operating income from the reported $13,317 to $9,317. The effective tax rate for 2009 ($3,825 ÷ $13,317) is 28.72%, and using this effective tax rate would give an adjusted net income of $6,641 [$9,317 × (1 − 0.2872)], compared to $9,492 before the adjustment. The EPS would therefore be reduced from the reported $1.40 to $0.98 (adjusted net income of $6,641 divided by 6,780 shares).
B. Based on information as reported, the P/CFO was 19.0 ($42 ÷ $2.21). Based on CFO adjusted to expense software development costs, the P/CFO was 31.6 ($42 ÷ $1.33).
- Price: Assuming that the market value of the company’s equity is based on its fundamentals, the price per share is $42, regardless of a difference in accounting.
- CFO per share, as reported, was $2.21 (total operating cash flows $15,007 ÷y 6,780 shares).
- CFO per share, as adjusted, was $1.33. The company’s $6,000 expenditure on software development costs was reported as a cash outflow from investing activities, so expensing those costs would reduce cash from operating activities by $6,000, from the reported $15,007 to $9,007. Dividing adjusted total operating cash flow of $9,007 by 6,780 shares results in cash flow per share of $1.33.
C. Based on information as reported, the EV/EBITDA was 16.3 ($284,760 ÷ $17,517). Based on EBITDA adjusted to expense software development costs, the EV/EBITDA was 24.7 ($284,760 ÷ $11,517).
- Enterprise Value: Enterprise value is the sum of the market value of the company’s equity and debt. JHH has no debt, and therefore the enterprise value is equal to the market value of its equity. The market value of its equity is $284,760 ($42 per share × 6,780 shares).
- EBITDA, as reported, was $17,517 (earnings before interest and taxes of $13,317 plus $2,200 depreciation plus $2,000 amortization).
- EBITDA, adjusted for expensing software development costs by the inclusion of $6,000 development expense and the exclusion of $2,000 amortization of prior expense, would be $11,517 (earnings before interest and taxes of $9,317 plus $2,200 depreciation plus $0 amortization).
Solution to 2: Expensing software development costs would decrease historical profits, operating cash flow, and EBITDA, and would thus increase all market multiples. So JHH’s stock would appear more expensive if it expensed rather than capitalized the software development costs.
If the unadjusted market-based ratios were used in the comparison of JHH to its competitor that expenses all software development expenditures, then JHH might appear to be underpriced when the difference is solely related to accounting factors. JHH’s adjusted market-based ratios provide a better basis for comparison.
For the company in Example 10-7, current period software development expenditures exceed the amortization of prior periods’ capitalized software development expenditures. As a result, expensing rather than capitalizing software development costs would have the effect of lowering income. If, however, software development expenditures slowed such that current expenditures were lower than the amortization of prior periods’ capitalized software development expenditures, then expensing software development costs would have the effect of increasing income relative to capitalizing it.
This section illustrated how decisions about capitalizing versus expensing impact financial statements and ratios. Earlier expensing lowers current profits but enhances trends, whereas capitalizing now and expensing later enhances current profits. Having described the accounting for acquisition of long-lived assets, we now turn to the topic of measuring long-lived assets in subsequent periods.
3. DEPRECIATION AND AMORTIZATION OF LONG-LIVED ASSETS
Under the cost model of reporting long-lived assets, which is permitted under IFRS and required under U.S. GAAP, the capitalized costs of long-lived tangible assets (other than land, which is not depreciated) and intangible assets with finite useful lives are allocated to subsequent periods as depreciation and amortization expenses. Depreciation and amortization are effectively the same concept, with the term depreciation referring to the process of allocating tangible assets’ costs and the term amortization referring to the process of allocating intangible assets’ costs.12 The alternative model of reporting long-lived assets is the revaluation model, which is permitted under IFRS but not under U.S. GAAP. Under the revaluation model, a company reports the long-lived asset at fair value rather than at acquisition cost (historical cost) less accumulated depreciation or amortization, as in the cost model.
An asset’s carrying amount is the amount at which the asset is reported on the balance sheet. Under the cost model, at any point in time, the carrying amount (also called carrying value or net book value) of a long-lived asset is equal to its historical cost minus the amount of depreciation or amortization that has been accumulated since the asset’s purchase (assuming that the asset has not been impaired, a topic which will be addressed in Section 5). Companies may present on the balance sheet the total net amount of property, plant, and equipment and the total net amount of intangible assets. However, more detail is disclosed in the notes to financial statements. The details disclosed typically include the acquisition costs, the depreciation and amortization expenses, the accumulated depreciation and amortization amounts, the depreciation and amortization methods used, and information on the assumptions used to depreciate and amortize long-lived assets.
3.1. Depreciation Methods and Calculation of Depreciation Expense
Depreciation methods include the straight-line method, in which the cost of an asset is allocated to expense evenly over its useful life; accelerated methods, in which the allocation of cost is greater in earlier years; and the units-of-production method, in which the allocation of cost corresponds to the actual use of an asset in a particular period. The choice of depreciation method affects the amounts reported on the financial statements, including the amounts for reported assets and operating and net income. This, in turn, affects a variety of financial ratios, including fixed asset turnover, total asset turnover, operating profit margin, operating return on assets, and return on assets.
Using the straight-line method, depreciation expense is calculated as depreciable cost divided by estimated useful life and is the same for each period. Depreciable cost is the historical cost of the tangible asset minus the estimated residual (salvage) value.13 A commonly used accelerated method is the declining balance method, in which the amount of depreciation expense for a period is calculated as some percentage of the carrying amount (i.e., cost net of accumulated depreciation at the beginning of the period). When an accelerated method is used, depreciable cost is not used to calculate the depreciation expense but the carrying amount should not be reduced below the estimated residual value. In the units-of-production method, the amount of depreciation expense for a period is based on the proportion of the asset’s production during the period compared with the total estimated productive capacity of the asset over its useful life. The depreciation expense is calculated as depreciable cost times production in the period divided by estimated productive capacity over the life of the asset. Equivalently, the company may estimate a depreciation cost per unit (depreciable cost divided by estimated productive capacity) and calculate depreciation expense as depreciation cost per unit times production in the period. Regardless of the depreciation method used, the carrying amount of the asset is not reduced below the estimated residual value. Example 10-8 provides an example of these depreciation methods.
EXAMPLE 10-8 Alternative Depreciation Methods
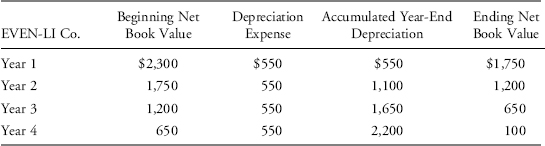
You are analyzing three hypothetical companies: EVEN-LI Co., SOONER Inc., and AZUSED Co. At the beginning of Year 1, each company buys an identical piece of box manufacturing equipment for $2,300 and has the same assumptions about useful life, estimated residual value, and productive capacity. The annual production of each company is the same, but each company uses a different method of depreciation. As disclosed in each company’s notes to the financial statements, each company’s depreciation method, assumptions, and production are as follows:
Depreciation method
- EVEN-LI Co.: straight-line method
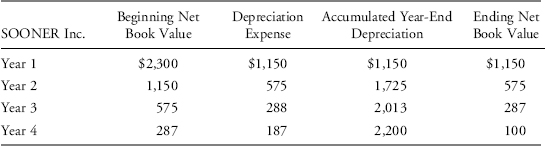
- SOONER Inc.: double-declining balance method (the rate applied to the carrying amount is double the depreciation rate for the straight-line method)
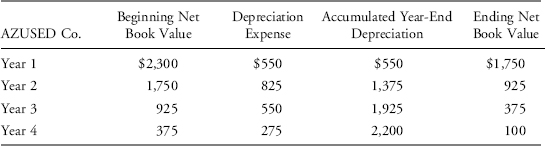
- AZUSED Co.: units-of-production method
Assumptions and production
- Estimated residual value: $100
- Estimated useful life: 4 years
- Total estimated productive capacity: 800 boxes
- Production in each of the four years: 200 boxes in the first year, 300 in the second year, 200 in the third year, and 100 in the fourth year
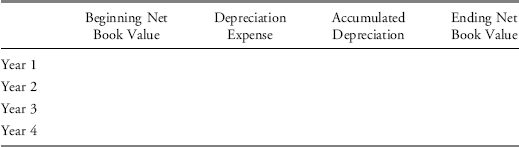
1. Using the following template for each company, record its beginning and ending net book value (carrying amount), end-of-year accumulated depreciation, and annual depreciation expense for the box manufacturing equipment.
Template:
2. Explain the significant differences in the timing of the recognition of the depreciation expense.
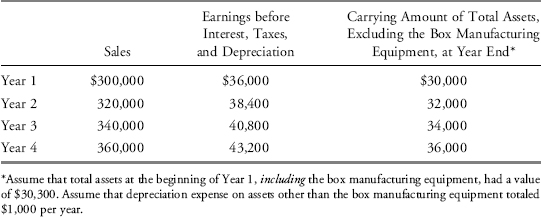
3. For each company, assume that sales, earnings before interest, taxes, and depreciation, and assets other than the box manufacturing equipment are as shown in the following table. Calculate the total asset turnover ratio, the operating profit margin, and the operating return on assets for each company for each of the four years. Discuss the ratios, comparing results within and across companies.
Solution to 1: For each company, the following information applies: Beginning net book value in Year 1 equals the purchase price of $2,300; accumulated year-end depreciation equals the balance from the previous year plus the current year’s depreciation expense; ending net book value (carrying amount) equals original cost minus accumulated year-end depreciation (which is the same as beginning net book value minus depreciation expense); and beginning net book value in Years 2, 3, and 4 equals the ending net book value of the prior year. The following text and filled-in templates describe how depreciation expense is calculated for each company.
EVEN-LI Co. uses the straight-line method, so depreciation expense in each year equals $550, which is calculated as ($2,300 original cost − $100 residual value)/4 years. The net book value at the end of Year 4 is the estimated residual value of $100.
SOONER Inc. uses the double-declining balance method. The depreciation rate for the double-declining balance method is double the depreciation rate for the straight-line method. The depreciation rate under the straight-line method is 25 percent (100 percent divided by 4 years). Thus, the depreciation rate for the double-declining balance method is 50 percent (2 times 25 percent). The depreciation expense for the first year is $1,150 (50 percent of $2,300). Note that under this method, the depreciation rate of 50 percent is applied to the carrying amount (net book value) of the asset, without adjustment for expected residual value. Because the carrying amount of the asset is not depreciated below its estimated residual value, however, the depreciation expense in the final year of depreciation decreases the ending net book value (carrying amount) to the estimated residual value.
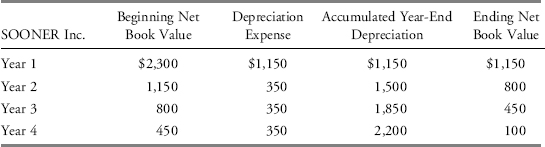
Another common approach (not required in this question) is to use an accelerated method, such as the double-declining method, for some period (a year or more) and then to change to the straight-line method for the remaining life of the asset. If SOONER had used the double-declining method for the first year and then switched to the straight-line method for Years 2, 3, and 4, the depreciation expense would be $350 [($1,150 − $100 estimated residual value)/3 years] a year for Years 2, 3, and 4. The results for SOONER under this alternative approach are shown here.
AZUSED Co. uses the units-of-production method. Dividing the equipment’s total depreciable cost by its total productive capacity gives a cost per unit of $2.75, calculated as ($2,300 original cost − $100 residual value)/800. The depreciation expense recognized each year is the number of units produced times $2.75. For Year 1, the amount of depreciation expense is $550 (200 units times $2.75). For Year 2, the amount is $825 (300 units times $2.75). For Year 3, the amount is $550. For Year 4, the amount is $275.
Solution to 2: All three methods result in the same total amount of accumulated depreciation over the life of the equipment. The significant differences are simply in the timing of the recognition of the depreciation expense. The straight-line method recognizes the expense evenly, the accelerated method recognizes most of the expense in the first year, and the units-of-production method recognizes the expense on the basis of production (or use of the asset). Under all three methods, the ending net book value is $100.
Solution to 3:
Total asset turnover ratio = Total revenue ÷ Average total assets
Operating profit margin = Earnings before interest and taxes ÷ Total revenue
Operating return on assets = Earnings before interest and taxes ÷ Average total assets
Ratios are shown in the table following, and details of the calculations for Years 1 and 2 are described after discussion of the ratios.
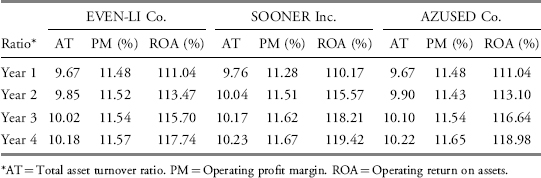
For all companies, the asset turnover ratio increased over time because sales grew at a faster rate than that of the assets. SOONER had consistently higher asset turnover ratios than the other two companies, however, because higher depreciation expense in the earlier periods decreased its average total assets. In addition, the higher depreciation in earlier periods resulted in SOONER having lower operating profit margin and operating ROA in the first year and higher operating profit margin and operating ROA in the later periods. SOONER appears to be more efficiently run, on the basis of its higher asset turnover and greater increases in profit margin and ROA over time; however, these comparisons reflect differences in the companies’ choice of depreciation method. In addition, an analyst might question the sustainability of the extremely high ROAs for all three companies because such high profitability levels would probably attract new competitors, which would likely put downward pressure on the ratios.
EVEN-LI Co.
Year 1:
Total asset turnover ratio = 300,000/[(30,300+30,000+1,750)/2] = 300,000/31,025 = 9.67
Operating profit margin = (36,000 − 1,000 − 550)/300,000 = 34,450/300,000 = 11.48%
Operating ROA = 34,450/31,025 = 111.04%
Year 2:
Total asset turnover ratio = 320,000/[(30,000+1,750+32,000+1,200)/2] = 320,000/32,475 = 9.85
Operating profit margin = (38,400 − 1,000 − 550)/320,000 = 36,850/320,000 = 11.52%
Operating ROA = 36,850/32,475 = 113.47%
SOONER Inc.
Year 1:
Total asset turnover ratio = 300,000/[(30,300+30,000+1,150)/2] = 300,000/30,725 = 9.76
Operating profit margin = (36,000 − 1,000 − 1,150)/300,000 = 33,850/300,000 = 11.28%
Operating ROA = 33,850/30,725 = 110.17%
Year 2:
Total asset turnover ratio = 320,000/[(30,000+1,150+32,000+575)/2] = 320,000/31,862.50 = 10.04
Operating profit margin = (38,400 − 1,000 − 575)/320,000 = 36,825/320,000 = 11.51%
Operating ROA = 36,825/31,862.50 = 115.57%
AZUSED Co.
Year 1:
Total asset turnover ratio = 300,000/[(30,300+30,000+1,750)/2] = 300,000/31,025 = 9.67
Operating profit margin = (36,000 − 1,000 − 550)/300,000 = 34,450/300,000 = 11.48%
Operating ROA = 34,450/31,025 = 111.04%
Year 2:
Total asset turnover ratio = 320,000/[(30,000+1,750+32,000+925)/2] = 320,000/32,337.50 = 9.90
Operating profit margin = (38,400 − 1,000 − 825)/320,000 = 36,575/320,000 = 11.43%
Operating ROA = 36,575/32,337.50 = 113.10%
In many countries, a company must use the same depreciation methods for both financial and tax reporting. In other countries, including the United States, a company need not use the same depreciation method for financial reporting and taxes. As a result of using different depreciation methods for financial and tax reporting, pretax income on the income statement and taxable income on the tax return may differ. Thus, the amount of tax expense computed on the basis of pretax income and the amount of taxes actually owed on the basis of taxable income may differ. Although these differences eventually reverse because the total depreciation is the same regardless of the timing of its recognition in financial statements versus on tax returns, during the period of the difference, the balance sheet will show what is known as deferred taxes. For instance, if a company uses straight-line depreciation for financial reporting and an accelerated depreciation method for tax purposes, the company’s financial statements will report lower depreciation expense and higher pretax income in the first year, compared with the amount of depreciation expense and taxable income in its tax reporting. (Compare the depreciation expense in Year 1 for EVEN-LI Co. and SOONER Inc. in the previous example.) Tax expense calculated on the basis of the financial statements’ pretax income will be higher than taxes payable on the basis of taxable income; the difference between the two amounts represents a deferred tax liability. The deferred tax liability will be reduced as the difference reverses (i.e., when depreciation for financial reporting is higher than the depreciation for tax purposes) and the income tax is paid.
Significant estimates required for calculating depreciation include the useful life of the asset (or its total lifetime productive capacity) and its expected residual value at the end of that useful life. A longer useful life and higher expected residual value decrease the amount of annual depreciation expense relative to a shorter useful life and lower expected residual value. Companies should review their estimates periodically to ensure they remain reasonable. IFRS require companies to review estimates annually.
Although no significant differences exist between IFRS and U.S. GAAP with respect to the definition of depreciation and the acceptable depreciation methods, IFRS require companies to use a component method of depreciation.14 Companies are required to separately depreciate the significant components of an asset (parts of an item with a cost that is significant in relation to the total cost and/or with different useful lives) and thus require additional estimates for the various components. For instance, it may be appropriate to depreciate separately the engine, frame, and interior furnishings of an aircraft. Under U.S. GAAP, the component method of depreciation is allowed but is seldom used in practice.15 The following example illustrates depreciating components of an asset.
EXAMPLE 10-9 Illustration of Depreciating Components of an Asset
CUTITUP Co., a hypothetical company, purchases a milling machine, a type of machine used for shaping metal, at a total cost of $10,000. $2,000 was estimated to represent the cost of the rotating cutter, a significant component of the machine. The company expects the machine to have a useful life of eight years and a residual value of $3,000 and that the rotating cutter will need to be replaced every two years. Assume the entire residual value is attributable to the milling machine itself, and assume the company uses straight-line depreciation for all assets.
1. How much depreciation expense would the company report in Year 1 if it uses the component method of depreciation, and how much depreciation expense would the company report in Year 1 if it does not use the component method?
2. Assuming a new cutter with an estimated two-year useful life is purchased at the end of Year 2 for $2,000, what depreciation expenses would the company report in Year 3 if it uses the component method and if it does not use the component method?
3. Assuming replacement of the cutter every two years at a price of $2,000, what is the total depreciation expense over the eight years if the company uses the component method compared with the total depreciation expense if the company does not use the component method?
4. How many different items must the company estimate in the first year to compute depreciation expense for the milling machine if it uses the component method, and how does this compare with what would be required if it does not use the component method?
Solution to 1: Depreciation expense in Year 1 under the component method would be $1,625. For the portion of the machine excluding the cutter, the depreciable base is total cost minus the cost attributable to the cutter minus the estimated residual value = $10,000 − $2,000 − $3,000 = $5,000. Depreciation expense for the machine excluding the cutter in the first year equals $625 (depreciable cost divided by the useful life of the machine = $5,000/8 years). For the cutter, the depreciation expense equals $1,000 (depreciable cost divided by the useful life of the cutter = $2,000/2 years). Thus, the total depreciation expense for Year 1 under the component method is $1,625 (the sum of the depreciation expenses of the two components = $625+$1,000). Depreciation expense in Year 2 would also be $1,625.
If the company does not use the component method, depreciation expense in Year 1 is $875 (the depreciable cost of the total milling machine divided by its useful life = [$10,000 − $3,000]/8 years). Depreciation expense in Year 2 would also be $875.
Solution to 2: Assuming that at the end of Year 2, the company purchases a new cutter for $2,000 with an estimated two-year life, under the component method, the depreciation expense in Year 3 will remain at $1,625. If the company does not use the component method and purchases a new cutter with an estimated two-year life for $2,000 at the end of Year 2, the depreciation expense in Year 3 will be $1,875 [$875+($2,000/2) = $875+$1,000].
Solution to 3: Over the eight years, assuming replacement of the cutters every two years at a price of $2,000, the total depreciation expense will be $13,000 [$1,625 × 8 years] when the component method is used. When the component method is not used, the total depreciation expense will also be $13,000 [$875 × 2 years+$1,875 × 6 years]. This amount equals the total expenditures of $16,000 [$10,000+3 cutters × $2,000] less the residual value of $3,000.
Solution to 4: The following table summarizes the estimates required in the first year to compute depreciation expense if the company does or does not use the component method:
| Estimate | Required Using Component Method? | Required If Not Using Component Method? |
| Useful life of milling machine | Yes | Yes |
| Residual value of milling machine | Yes | Yes |
| Portion of machine cost attributable to cutter | Yes | No |
| Portion of residual value attributable to cutter | Yes | No |
| Useful life of cutter | Yes | No |
Total depreciation expense may be allocated between the cost of sales and other expenses. Within the income statement, depreciation expense of assets used in production is usually allocated to the cost of sales, and the depreciation expense of assets not used in production may be allocated to some other expense category. For instance, depreciation expense may be allocated to selling, general, and administrative expenses if depreciable assets are used in those functional areas. Notes to the financial statements sometimes disclose information regarding which income statement line items include depreciation expense, although the exact amount of detail disclosed by individual companies varies.
3.2. Amortization Methods and Calculation of Amortization Expense
Amortization is similar in concept to depreciation. The term amortization applies to intangible assets, and the term depreciation applies to tangible assets. Both terms refer to the process of allocating the cost of an asset over the asset’s useful life. Only those intangible assets assumed to have finite useful lives are amortized over their useful lives, following the pattern in which the benefits are used up. Acceptable amortization methods are the same as the methods acceptable for depreciation. Assets assumed to have an indefinite useful life (in other words, without a finite useful life) are not amortized. An intangible asset is considered to have an indefinite useful life when there is “no foreseeable limit to the period over which the asset is expected to generate net cash inflows” for the company.16
Intangible assets with finite useful lives include an acquired customer list expected to provide benefits to a direct-mail marketing company for two to three years, an acquired patent or copyright with a specific expiration date, an acquired license with a specific expiration date and no right to renew the license, and an acquired trademark for a product that a company plans to phase out over a specific number of years. Examples of intangible assets with indefinite useful lives include an acquired license that, although it has a specific expiration date, can be renewed at little or no cost and an acquired trademark that, although it has a specific expiration, can be renewed at a minimal cost and relates to a product that a company plans to continue selling for the foreseeable future.
As with depreciation for a tangible asset, the calculation of amortization for an intangible asset requires the original amount at which the intangible asset is recognized and estimates of the length of its useful life and its residual value at the end of its useful life. Useful lives are estimated on the basis of the expected use of the asset, considering any factors that may limit the life of the asset, such as legal, regulatory, contractual, competitive, or economic factors.
EXAMPLE 10-10 Amortization Expense
IAS 38 Intangible Assets provides illustrative examples regarding the accounting for intangible assets, including the following:
A direct-mail marketing company acquires a customer list and expects that it will be able to derive benefit from the information on the list for at least one year, but no more than three years. The customer list would be amortized over management’s best estimate of its useful life, say 18 months. Although the direct-mail marketing company may intend to add customer names and other information to the list in the future, the expected benefits of the acquired customer list relate only to the customers on that list at the date it was acquired.
In this example, in what ways would management’s decisions and estimates affect the company’s financial statements?
Solution: Because the acquired customer list is expected to generate future economic benefits for a period greater than one year, the cost of the list should be capitalized and not expensed. The acquired customer list is determined to not have an indefinite life and must be amortized. Management must estimate the useful life of the customer list and must select an amortization method. In this example, the list appears to have no residual value. Both the amortization method and the estimated useful life affect the amount of the amortization expense in each period. A shorter estimated useful life, compared with a longer estimated useful life, results in a higher amortization expense each year over a shorter period, but the total accumulated amortization expense over the life of the intangible asset is unaffected by the estimate of the useful life. Similarly, the total accumulated amortization expense over the life of the intangible asset is unaffected by the choice of amortization method. The amortization expense per period depends on the amortization method. If the straight-line method is used, the amortization expense is the same for each year of useful life. If an accelerated method is used, the amortization expense will be higher in earlier years.
The revaluation model is an alternative to the cost model for the periodic valuation and reporting of long-lived assets. IFRS permit the use of either the revaluation model or the cost model, but the revaluation model is not allowed under U.S. GAAP. Revaluation changes the carrying amounts of classes of long-lived assets to fair value (the fair value must be measured reliably). Under the cost model, carrying amounts are historical costs less accumulated depreciation or amortization. Under the revaluation model, carrying amounts are the fair values at the date of revaluation less any subsequent accumulated depreciation or amortization.
IFRS allow companies to value long-lived assets either under a cost model at historical cost minus accumulated depreciation or amortization or under a revaluation model at fair value. In contrast, U.S. accounting standards require that the cost model be used. A key difference between the two models is that the cost model allows only decreases in the values of long-lived assets compared with historical costs but the revaluation model may result in increases in the values of long-lived assets to amounts greater than historical costs.
IFRS allow a company to use the cost model for some classes of assets and the revaluation model for others, but the company must apply the same model to all assets within a particular class of assets and must revalue all items within a class to avoid selective revaluation. Examples of different classes of assets include land, land and buildings, machinery, motor vehicles, furniture and fixtures, and office equipment. The revaluation model may be used for classes of intangible assets but only if an active market for the assets exists, because the revaluation model may only be used if the fair values of the assets can be measured reliably. For practical purposes, the revaluation model is rarely used for either tangible or intangible assets, but its use is especially rare for intangible assets.
Under the revaluation model, whether an asset revaluation affects earnings depends on whether the revaluation initially increases or decreases an asset class’ carrying amount. If a revaluation initially decreases the carrying amount of the asset class, the decrease is recognized in profit or loss. Later, if the carrying amount of the asset class increases, the increase is recognized in profit or loss to the extent that it reverses a revaluation decrease of the same asset class previously recognized in profit or loss. Any increase in excess of the reversal amount will not be recognized in the income statement but will be recorded directly to equity in a revaluation surplus account. An upward revaluation is treated the same as the amount in excess of the reversal amount. In other words, if a revaluation initially increases the carrying amount of the asset class, the increase in the carrying amount of the asset class bypasses the income statement and goes directly to equity under the heading of revaluation surplus. Any subsequent decrease in the asset’s value first decreases the revaluation surplus and then goes to income. When an asset is retired or disposed of, any related amount of revaluation surplus included in equity is transferred directly to retained earnings.
Asset revaluations offer several considerations for financial statement analyses. First, an increase in the carrying amount of depreciable long-lived assets increases total assets and shareholders’ equity, so asset revaluations that increase the carrying amount of an asset can be used to reduce reported leverage. Defining leverage as average total assets divided by average shareholders’ equity, increasing both the numerator (assets) and denominator (equity) by the same amount leads to a decline in the ratio. (Mathematically, when a ratio is greater than one, as in this case, an increase in both the numerator and the denominator by the same amount leads to a decline in the ratio.) Therefore, the leverage motivation for the revaluation should be considered in analysis. For example, a company may revalue assets up if it is seeking new capital or approaching leverage limitations set by financial covenants.
Second, assets revaluations that decrease the carrying amount of the assets reduce net income. In the year of the revaluation, profitability measures such as return on assets and return on equity decline. However, because total assets and shareholders’ equity are also lower, the company may appear more profitable in future years. Additionally, reversals of downward revaluations also go through income, thus increasing earnings. Managers can then opportunistically time the reversals to manage earnings and increase income. Third, asset revaluations that increase the carrying amount of an asset initially increase depreciation expense, total assets, and shareholders’ equity. Therefore, profitability measures, such as return on assets and return on equity, would decline. Although upward asset revaluations also generally decrease income (through higher depreciation expense), the increase in the value of the long-lived asset is presumably based on increases in the operating capacity of the asset, which will likely be evidenced in increased future revenues.
Finally, an analyst should consider who did the appraisal—that is, an independent external appraiser or management—and how often revaluations are made. Appraisals of the fair value of long-lived assets involve considerable judgment and discretion. Presumably, appraisals of assets from independent external sources are more reliable. How often assets are revalued can provide an indicator of whether their reported value continues to be representative of their fair values.
The next two examples illustrate revaluation of long-lived assets under IFRS.
EXAMPLE 10-11 Revaluation Resulting in an Increase in Carrying Amount Followed by Subsequent Revaluation Resulting in a Decrease in Carrying Amount
UPFIRST, a hypothetical manufacturing company, has elected to use the revaluation model for its machinery. Assume for simplicity that the company owns a single machine, which it purchased for €10,000 on the first day of its fiscal period, and that the measurement date occurs simultaneously with the company’s fiscal period end.
1. At the end of the first fiscal period after acquisition, assume the fair value of the machine is determined to be €11,000. How will the company’s financial statements reflect the asset?
2. At the end of the second fiscal period after acquisition, assume the fair value of the machine is determined to be €7,500. How will the company’s financial statements reflect the asset?
Solution to 1: At the end of the first fiscal period, the company’s balance sheet will show the asset at a value of €11,000. The €1,000 increase in the value of the asset will appear in other comprehensive income and be accumulated in equity under the heading of revaluation surplus.
Solution to 2: At the end of the second fiscal period, the company’s balance sheet will show the asset at a value of €7,500. The total decrease in the carrying amount of the asset is €3,500 (€11,000 − €7,500). Of the €3,500 decrease, the first €1,000 will reduce the amount previously accumulated in equity under the heading of revaluation surplus. The other €2,500 will be shown as a loss on the income statement.
EXAMPLE 10-12 Revaluation Resulting in a Decrease in Asset’s Carrying Amount Followed by Subsequent Revaluation Resulting in an Increase in Asset’s Carrying Amount
DOWNFIRST, a hypothetical manufacturing company, has elected to use the revaluation model for its machinery. Assume for simplicity that the company owns a single machine, which it purchased for €10,000 on the first day of its fiscal period, and that the measurement date occurs simultaneously with the company’s fiscal period end.
1. At the end of the first fiscal period after acquisition, assume the fair value of the machine is determined to be €7,500. How will the company’s financial statements reflect the asset?
2. At the end of the second fiscal period after acquisition, assume the fair value of the machine is determined to be €11,000. How will the company’s financial statements reflect the asset?
Solution to 1: At the end of the first fiscal period, the company’s balance sheet will show the asset at a value of €7,500. The €2,500 decrease in the value of the asset will appear as a loss on the company’s income statement.
Solution to 2: At the end of the second fiscal period, the company’s balance sheet will show the asset at a value of €11,000. The total increase in the carrying amount of the asset is an increase of €3,500 (€11,000 − €7,500). Of the €3,500 increase, the first €2,500 reverses a previously reported loss and will be reported as a gain on the income statement. The other €1,000 will bypass profit or loss and be reported as other comprehensive income and be accumulated in equity under the heading of revaluation surplus.
Exhibit 10-6 provides an example of a company’s disclosures concerning revaluation. The exhibit shows an excerpt from the 2006 annual report of KPN, a Dutch telecommunications and multimedia company. The excerpt is from the section of the annual report in which the company explains differences between its reporting under IFRS and its reporting under U.S. GAAP.17 One of these differences, as previously noted, is that U.S. GAAP do not allow revaluation of fixed assets held for use. KPN elected to report a class of fixed assets (cables) at fair value and explained that under U.S. GAAP, using the cost model, the value of the class at the end of 2006 would have been €350 million lower.
EXHIBIT 10-6 Impact of Revaluation
Excerpt from the annual report of Koninklijke KPN N. V. (NYSE: KPN) explaining certain differences between IFRS and U.S. GAAP regarding “Deemed cost fixed assets”:
KPN elected the exemption to revalue certain of its fixed assets upon the transition to IFRS to fair value and to use this fair value as their deemed cost. KPN applied the depreciated replacement cost method to determine this fair value. The revalued assets pertain to certain cables, which form part of property, plant & equipment. Under U.S. GAAP, this revaluation is not allowed and therefore results in a reconciling item. As a result, the value of these assets as of December 31, 2006 under U.S. GAAP is EUR 350 million lower (2005: EUR 415 million; 2004: EUR 487 million) than under IFRS.
KPN’s Form 20-F, p. 168, filed 1 March 2007.
Clearly, the use of the revaluation model as opposed to the cost model can have a significant impact on the financial statements of companies. This has potential consequences for comparing financial performance using financial ratios of companies that use different models.
In contrast with depreciation and amortization charges, which serve to allocate the depreciable cost of a long-lived asset over its useful life, impairment charges reflect an unanticipated decline in the value of an asset. Both IFRS and U.S. GAAP require companies to write down the carrying amount of impaired assets. Impairment reversals are permitted under IFRS but not under U.S. GAAP.
An asset is considered to be impaired when its carrying amount exceeds its recoverable amount (“the higher of fair value less cost to sell or value in use” according to IAS 36 Impairment of Assets) or under U.S. GAAP when its carrying amount exceeds its fair value. Under U.S. GAAP, however, impairment losses are only recognizable when the carrying amount of the impaired asset is determined to be not recoverable. Therefore, in general, impairment losses are recognized when the asset’s carrying amount is not recoverable. However, IFRS and U.S. GAAP define recoverability differently. The following paragraphs describe accounting for impairment for different categories of assets.
5.1. Impairment of Property, Plant, and Equipment
Accounting standards do not require that property, plant, and equipment be tested annually for impairment. Rather, at the end of each reporting period (generally, a fiscal year), a company assesses whether there are indications of asset impairment. If there is no indication of impairment, the asset is not tested for impairment. If there is an indication of impairment, such as evidence of obsolescence, decline in demand for products, or technological advancements, the recoverable amount of the asset should be measured in order to test for impairment. For property, plant, and equipment, impairment losses are recognized when the asset’s carrying amount is not recoverable; the carrying amount is more than the recoverable amount. The amount of the impairment loss will reduce the carrying amount of the asset on the balance sheet and will reduce net income on the income statement. The impairment loss is a noncash item and will not affect cash from operations.
IFRS and U.S. GAAP differ somewhat both in the guidelines for determining that impairment has occurred and in the measurement of an impairment loss. Under IAS 36, an impairment loss is measured as the excess of carrying amount over the recoverable amount of the asset. The recoverable amount of an asset is defined as “the higher of its fair value less costs to sell and its value in use.” Value in use is a discounted measure of expected future cash flows. Under U.S. GAAP, assessing recoverability is separate from measuring the impairment loss. An asset’s carrying amount is considered not recoverable when it exceeds the undiscounted expected future cash flows. If the asset’s carrying amount is considered not recoverable, the impairment loss is measured as the difference between the asset’s fair value and carrying amount.
EXAMPLE 10-13 Impairment of Property, Plant, and Equipment
Sussex, a hypothetical manufacturing company in the United Kingdom, has a machine it uses to produce a single product. The demand for the product has declined substantially since the introduction of a competing product. The company has assembled the following information with respect to the machine:
| Carrying amount | £18,000 |
| Undiscounted expected future cash flows | £19,000 |
| Present value of expected future cash flows | £16,000 |
| Fair value if sold | £17,000 |
| Costs to sell | £2,000 |
1. Under IFRS, what would the company report for the machine?
2. Under U.S. GAAP, what would the company report for the machine?
Solution to 1: Under IFRS, the company would compare the carrying amount (£18,000) with the higher of its fair value less costs to sell (£15,000) and its value in use (£16,000). The carrying amount exceeds the value in use, the higher of the two amounts, by £2,000. The machine would be written down to the recoverable amount of £16,000, and a loss of £2,000 would be reported in the income statement. The carrying amount of the machine is now £16,000. A new depreciation schedule based on the carrying amount of £16,000 would be developed.
Solution to 2: Under U.S. GAAP, the carrying amount (£18,000) is compared with the undiscounted expected future cash flows (£19,000). The carrying amount is less than the undiscounted expected future cash flows, so the carrying amount is considered recoverable. The machine would continue to be carried at £18,000, and no loss would be reported.
5.2. Impairment of Intangible Assets with a Finite Life
Intangible assets with a finite life are amortized (carrying amount decreases over time) and may become impaired. As is the case with property, plant, and equipment, the assets are not tested annually for impairment. Instead, they are tested only when significant events suggest the need to test. The company assesses at the end of each reporting period whether a significant event suggesting the need to test for impairment has occurred. Examples of such events include a significant decrease in the market price or a significant adverse change in legal or economic factors. Impairment accounting for intangible assets with a finite life is essentially the same as for tangible assets; the amount of the impairment loss will reduce the carrying amount of the asset on the balance sheet and will reduce net income on the income statement.
5.3. Impairment of Intangibles with Indefinite Lives
Intangible assets with indefinite lives are not amortized. Instead, they are carried on the balance sheet at historical cost but are tested at least annually for impairment. Impairment exists when the carrying amount exceeds its fair value.
5.4. Impairment of Long-Lived Assets Held for Sale
A long-lived (noncurrent) asset is reclassified as held for sale rather than held for use when it ceases to be used and management’s intent is to sell it. For instance, if a building ceases to be used and management’s intent is to sell it, the building is reclassified from property, plant, and equipment to noncurrent assets held for sale. At the time of reclassification, assets previously held for use are tested for impairment. If the carrying amount at the time of reclassification exceeds the fair value less costs to sell, an impairment loss is recognized and the asset is written down to fair value less costs to sell. Long-lived assets held for sale cease to be depreciated or amortized.
5.5. Reversals of Impairments of Long-Lived Assets
After an asset has been deemed impaired and an impairment loss has been reported, the asset’s recoverable amount could potentially increase. For instance, a lawsuit appeal may successfully challenge a patent infringement by another company, with the result that a patent previously written down has a higher recoverable amount. IFRS permit impairment losses to be reversed if the recoverable amount of an asset increases regardless of whether the asset is classified as held for use or held for sale. Note that IFRS permit the reversal of impairment losses only. IFRS do not permit the revaluation to the recoverable amount if the recoverable amount exceeds the previous carrying amount. Under U.S. GAAP, the accounting for reversals of impairments depends on whether the asset is classified as held for use or held for sale.18 Under U.S. GAAP, once an impairment loss has been recognized for assets held for use, it cannot be reversed. In other words, once the value of an asset held for use has been decreased by an impairment charge, it cannot be increased. For assets held for sale, if the fair value increases after an impairment loss, the loss can be reversed.
A company derecognizes an asset (i.e., removes it from the financial statements) when the asset is disposed of or is expected to provide no future benefits from either use or disposal. A company may dispose of a long-lived operating asset by selling it, exchanging it, or abandoning it. As previously described, noncurrent assets that are no longer in use and are to be sold are reclassified as noncurrent assets held for sale.
6.1. Sale of Long-Lived Assets
The gain or loss on the sale of long-lived assets is computed as the sales proceeds minus the carrying amount of the asset at the time of sale. An asset’s carrying amount is typically the net book value (i.e., the historical cost minus accumulated depreciation), unless the asset’s carrying amount has been changed to reflect impairment and/or revaluation, as previously discussed.
EXAMPLE 10.14 Calculation of Gain or Loss on the Sale of Long-Lived Assets
Moussilauke Diners Inc., a hypothetical company, as a result of revamping its menus to focus on healthier food items, sells 450 used pizza ovens and reports a gain on the sale of $1.2 million. The ovens had a carrying amount of $1.9 million (original cost of $5.1 million less $3.2 million of accumulated depreciation). At what price did Moussilauke sell the ovens?
A. $0.7 million
B. $3.1 million
C. $6.3 million
Solution: B is correct. The ovens had a carrying amount of $1.9 million, and Moussilauke recognized a gain of $1.2 million. Therefore, Moussilauke sold the ovens at a price of $3.1 million. The gain on the sale of $1.2 million is the selling price of $3.1 million minus the carrying amount of $1.9 million. Ignoring taxes, the cash flow from the sale is $3.1 million, which would appear as a cash inflow from investing.
A gain or loss on the sale of an asset is disclosed on the income statement, either as a component of other gains and losses or in a separate line item when the amount is material. A company typically discloses further detail about the sale in the management discussion and analysis and/or financial statement footnotes. In addition, a statement of cash flows prepared using the indirect method adjusts net income to remove any gain or loss on the sale from operating cash flow and to include the amount of proceeds from the sale in cash from investing activities. Recall that the indirect method of the statement of cash flows begins with net income and makes all adjustments to arrive at cash from operations, including removal of gains or losses from nonoperating activities.
6.2. Long-Lived Assets Disposed of Other Than by a Sale
Long-lived assets to be disposed of other than by a sale (e.g., abandoned, exchanged for another asset, or distributed to owners in a spin-off) are classified as held for use until disposal.19 Thus, the long-lived assets continue to be depreciated and tested for impairment, unless their carrying amount is zero, as required for other long-lived assets owned by the company.
When an asset is retired or abandoned, the accounting is similar to a sale, except that the company does not record cash proceeds. Assets are reduced by the carrying amount of the asset at the time of retirement or abandonment, and a loss equal to the asset’s carrying amount is recorded.
When an asset is exchanged, accounting for the exchange typically involves removing the carrying amount of the asset given up, adding a fair value for the asset acquired, and reporting any difference between the carrying amount and the fair value as a gain or loss. The fair value used is the fair value of the asset given up unless the fair value of the asset acquired is more clearly evident. If no reliable measure of fair value exists, the acquired asset is measured at the carrying amount of the asset given up. A gain is reported when the fair value used for the newly acquired asset exceeds the carrying amount of the asset given up. A loss is reported when the fair value used for the newly acquired asset is less than the carrying amount of the asset given up. If the acquired asset is valued at the carrying amount of the asset given up because no reliable measure of fair value exists, no gain or loss is reported.
When a spin-off occurs, typically, an entire cash-generating unit of a company with all its assets is spun off. As an illustration of a spin-off, Altria Group Inc. effected a spin-off of Kraft Foods on 30 March 2007 by distributing about 89 percent of Kraft’s shares to Altria’s shareholders. The company prepared unaudited pro forma income statements and balance sheets (for illustrative purposes only) as if the spin-off had occurred at the beginning of the year. Exhibit 10-7 summarizes information from the asset portion of the company’s pro forma balance sheets. The items in the column labeled “Spin-Off of Kraft” reflect Kraft’s assets being removed from Altria’s balance sheet at the time of the spin-off. For example, Kraft’s property, plant, and equipment (net of depreciation) totaled $9.7 billion.
EXHIBIT 10-7 Altria Group, Inc. and Subsidiaries Pro Forma Condensed Consolidated Balance Sheet [partial]
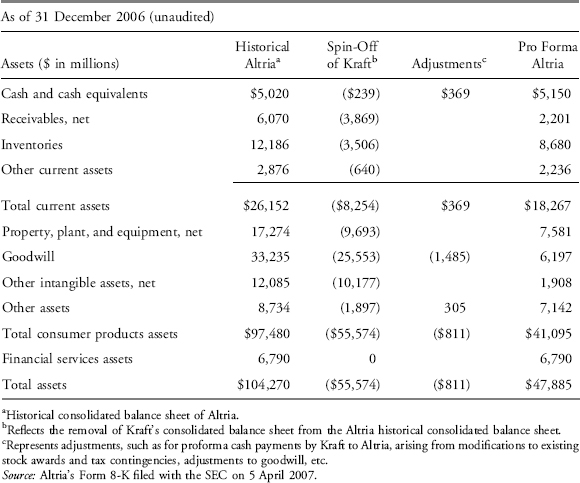
7. PRESENTATION AND DISCLOSURES
Under IFRS, for each class of property, plant, and equipment, a company must disclose the measurement bases, the depreciation method, the useful lives (or, equivalently, the depreciation rate) used, the gross carrying amount and the accumulated depreciation at the beginning and end of the period, and a reconciliation of the carrying amount at the beginning and end of the period.20 In addition, disclosures of restrictions on title and pledges as security of property, plant, and equipment and contractual agreements to acquire property, plant, and equipment are required. If the revaluation model is used, the date of revaluation, details of how the fair value was obtained, the carrying amount under the cost model, and the revaluation surplus must be disclosed.
The disclosure requirements under U.S. GAAP are less exhaustive.21 A company must disclose the depreciation expense for the period, the balances of major classes of depreciable assets, accumulated depreciation by major classes or in total, and a general description of the depreciation method(s) used in computing depreciation expense with respect to the major classes of depreciable assets.
Under IFRS, for each class of intangible assets, a company must disclose whether the useful lives are indefinite or finite. If finite, for each class of intangible asset, a company must disclose the useful lives (or, equivalently, the amortization rate) used, the amortization methods used, the gross carrying amount and the accumulated amortization at the beginning and end of the period, where amortization is included on the income statement, and a reconciliation of the carrying amount at the beginning and end of the period.22 If an asset has an indefinite life, the company must disclose the carrying amount of the asset and why it is considered to have an indefinite life. Similar to property, plant, and equipment, disclosures of restrictions on title and pledges as security of intangible assets and contractual agreements to acquire intangible assets are required. If the revaluation model is used, the date of revaluation, details of how the fair value was obtained, the carrying amount under the cost model, and the revaluation surplus must be disclosed.
Under U.S. GAAP, companies are required to disclose the gross carrying amounts and accumulated amortization in total and by major class of intangible assets, the aggregate amortization expense for the period, and the estimated amortization expense for the next five fiscal years.23
The disclosures related to impairment losses also differ under IFRS and U.S. GAAP. Under IFRS, a company must disclose for each class of assets the amounts of impairment losses and reversals of impairment losses recognized in the period and where those are recognized on the financial statements.24 The company must also disclose in aggregate the main classes of assets affected by impairment losses and reversals of impairment losses and the main events and circumstances leading to recognition of these impairment losses and reversals of impairment losses. Under U.S. GAAP, there is no reversal of impairment losses. The company must disclose a description of the impaired asset, what led to the impairment, the method of determining fair value, the amount of the impairment loss, and where the loss is recognized on the financial statements.25
Disclosures about long-lived assets appear throughout the financial statements: in the balance sheet, the income statement, the statement of cash flows, and the notes. The balance sheet reports the carrying value of the asset. For the income statement, depreciation expense may or may not appear as a separate line item. Under IFRS, whether the income statement discloses depreciation expense separately depends on whether the company is using a “nature of expense” method or a “function of expense” method. Under the nature of expense method, a company aggregates expenses “according to their nature (for example, depreciation, purchases of materials, transport costs, employee benefits and advertising costs), and does not reallocate them among functions within the entity.”26 Under the function of expense method, a company classifies expenses according to the function, for example as part of cost of sales or of SG&A (selling, general, and administrative expenses). At a minimum, a company using the function of expense method must disclose cost of sales, but the other line items vary.
The statement of cash flows reflects acquisitions and disposals of fixed assets in the investing section. In addition, when prepared using the indirect method, the statement of cash flowstypically shows depreciation expense (or depreciation plus amortization) as a line item in the adjustments of net income to cash flow from operations. The notes to the financial statements describe the company’s accounting method(s), the range of estimated useful lives, historical cost by main category of fixed asset, accumulated depreciation, and annual depreciation expense.
To illustrate financial statement presentation and disclosures, the following example provides excerpts relating to intangible assets and property, plant, and equipment from the annual report of Vodafone Group Plc for the year ended 31 March 2009.
EXAMPLE 10-15 Financial Statement Presentation and Disclosures for Long-Lived Assets
The following exhibits include excerpts from the annual report for the year ended 31 March 2009 of Vodafone Group Plc (London: VOD), a global mobile telecommunications company headquartered in the United Kingdom.
EXHIBIT 10-9 Vodafone Group Plc Excerpts from the Notes to the Consolidated Financial Statements
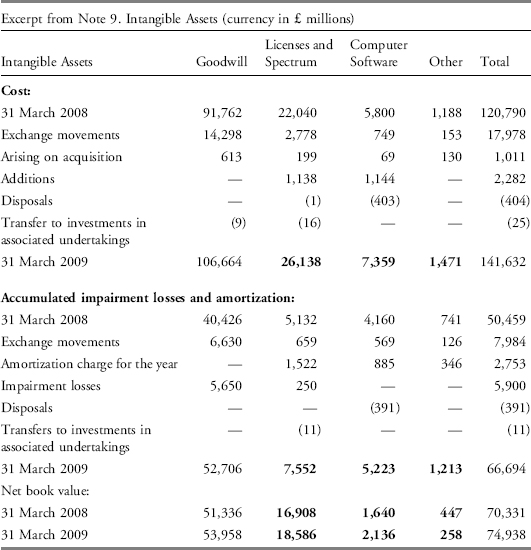
For licenses and spectrum and other intangible assets, amortization is included within the cost of sales line within the consolidated income statement. Licenses and spectrum with a net book value of £2,765m (2008: £nil) have been pledged as security against borrowings.
Excerpt from Note 10. Impairment
Impairment losses
Impairment losses recognized in the consolidated income statement as a separate line item within operating profit, in respect of goodwill and licenses and spectrum fees are as follows (£m):
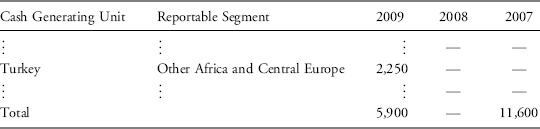
. . . The impairment losses were based on value in use calculations.. . .
Turkey
. . .At 30 September 2008, the goodwill was impaired by £1,700 million.. . . During the second half of the 2009 financial year, impairment losses of £300 million in relation to goodwill and £250 million in relation to licenses and spectrum resulted from adverse changes in both the discount rate and a fall in the long-term GDP growth rate. The cash flow projections. . .were substantially unchanged from those used at 30 September 2008.. . .
Sensitivity to changes in assumptions
. . .The estimated recoverable amount of the Group’s operations in Spain, Turkey, and Ghana equaled their respective carrying value and, consequently, any adverse change in key assumption would, in isolation, cause a further impairment loss to be recognized.. . .
The changes in the following table to assumptions used in the impairment review would, in isolation, lead to an (increase)/decrease to the aggregate impairment loss recognized in the year ended 31 March 2009:
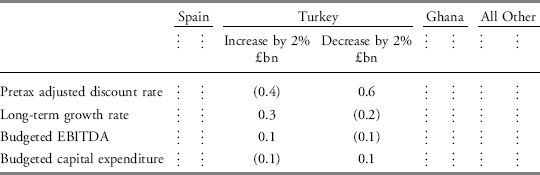
Excerpt from Note 11. Property, Plant, and Equipment
The net book value of land and buildings and equipment, fixtures, and fittings includes £106 million and £82 million, respectively (2008: £110 million and £51 million) in relation to assets held under finance leases. Included in the net book value of land and buildings and equipment, fixtures and fittings are assets in the course of construction, which are not depreciated, with a cost of £44 million and £1,186 million, respectively (2008: £28 million and £1,013 million). Property, plant, and equipment with a net book value of £148 million (2008: £1,503 million) has been pledged as security against borrowings.
Excerpt from Note 22. Movements in Accumulated Other Recognized Income and Expense (currency in £ millions)
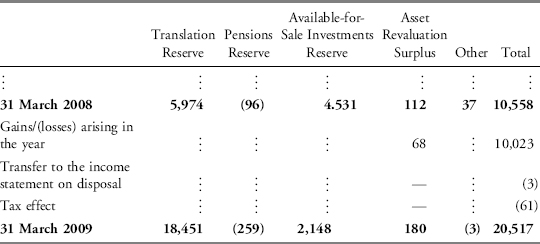
1. As of 31 March 2009, what percentage of other intangible assets and property, plant, and equipment is pledged as security against borrowings?
2. What caused the £250 million impairment losses in relation to licenses and spectrum during the year ended 31 March 2009?
3. By what amount would impairment losses related to Turkey change if the pretax adjusted discount rate decreased by 2 percent?
4. Where are impairment losses reported on the financial statements? Where is amortization included within the consolidated income statement?
5. What percentage of property, plant, and equipment, based on net book value, is held under finance leases rather than owned as of 31 March 2009?
6. The gains and losses arising in the year on asset revaluation most likely are:
A. reflected on the consolidated income statement.
B. reported in the notes to the financial statements only.
C. recognized directly in equity and shown on the consolidated statement of recognized income and expense.
Solution to 1: Assets that have been pledged as security against borrowings are licenses and spectrum, with a net book value of £2,765 million (Note 9), and property, plant, and equipment, with a net book value of £148 million (Note 11). These assets represent 7.24 percent [(2,765+148)/(20,980+19,250)] of the other intangible assets and property, plant, and equipment.
Solution to 2: The £250 million impairment losses in relation to licenses and spectrum resulted from an increase in the pretax adjusted discount rate and a decrease in the long-term growth rate in Turkey (Note 10).
Solution to 3: A 2 percent decrease in the pretax adjusted discount rate related to Turkey would reduce impairment losses by £0.6 billion or £600 million (Note 10).
Solution to 4: Impairment losses are reported on the consolidated income statement (Exhibit 10-8). Impairment losses reduce the value of the assets impaired (Note 9) and are thus recognized within the consolidated balance sheet. Amortization is included within the cost of sales line within the consolidated income statement (Note 9).
EXHIBIT 10-8 Vodafone Group Plc Excerpts from the Consolidated Financial Statements
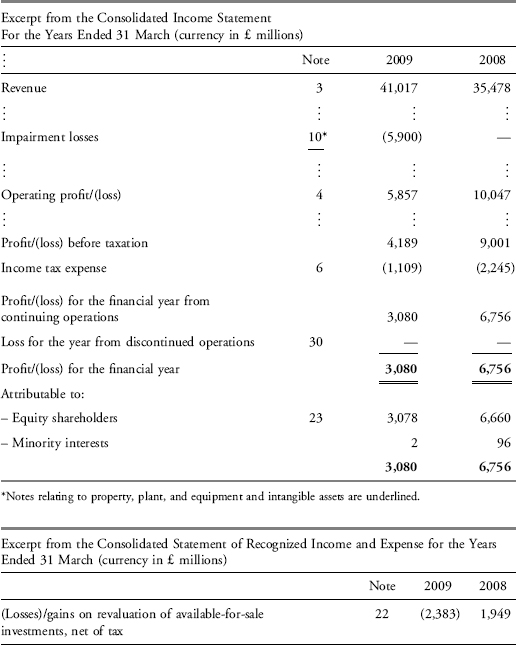

Solution to 5: The net book value of land and buildings and equipment, fixtures, and fittings includes £106 million and £82 million, respectively, in relation to assets held under finance leases (Note 22). The sum of these values represents 0.98 percent of the property, plant, and equipment [(106+82)/19,250].
Solution to 6: C is correct. The gains and losses arising in the year on asset revaluation are recognized directly in equity and shown on the consolidated statement of recognized income and expense. They are also reported in the notes to the financial statements (Note 22).
Note that the exhibits in the previous example contain relatively brief excerpts from the company’s disclosures. The complete text of the disclosures concerning the company’s noncurrent assets spans seven different footnotes, most of which are several pages long. In addition to information about the discount rate and other assumptions used to calculate impairment charges, the disclosures provide information about the sensitivity of impairment charges to changes in the assumptions.
Overall, an analyst can use the disclosures to understand a company’s investments in tangible and intangible assets, how those investments changed during a reporting period, how those changes affected current performance, and what those changes might indicate about future performance.
Ratios used in analyzing fixed assets include the fixed asset turnover ratio and several asset age ratios. The fixed asset turnover ratio (total revenue divided by average net fixed assets) reflects the relationship between total revenues and investment in PPE. The higher this ratio, the higher the amount of sales a company is able to generate with a given amount of investment in fixed assets. A higher asset turnover ratio is often interpreted as an indicator of greater efficiency.
Asset age ratios generally rely on the relationship between historical cost and depreciation. Under the revaluation model (permitted under IFRS but not U.S. GAAP), the relationship between carrying amount, accumulated depreciation, and depreciation expense will differ when the carrying amount differs significantly from the depreciated historical cost. Therefore, the following discussion of asset age ratios applies primarily to PPE reported under the cost model.
Asset age and remaining useful life, two asset age ratios, are important indicators of a company’s need to reinvest in productive capacity. The older the assets and the shorter the remaining life, the more a company may need to reinvest to maintain productive capacity. The average age of a company’s asset base can be estimated as accumulated depreciation divided by depreciation expense. The average remaining life of a company’s asset base can be estimated as net PPE divided by depreciation expense. These estimates simply reflect the following relationships for assets accounted for on a historical cost basis: total historical cost minus accumulated depreciation equals net PPE; and, under straight-line depreciation, total historical cost less salvage value divided by estimated useful life equals annual depreciation expense. Equivalently, total historical cost less salvage value divided by annual depreciation expense equals estimated useful life. Assuming straight-line depreciation and no salvage value (for simplicity), we have the following:
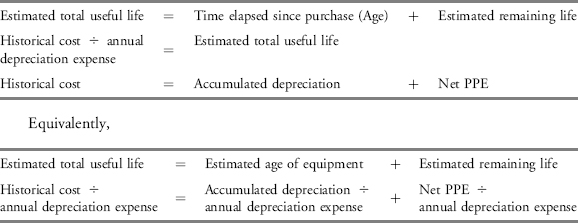
The application of these estimates can be illustrated by a hypothetical example of a company with a single depreciable asset. Assume the asset initially cost $100, had an estimated useful life of 10 years, and an estimated salvage value of $0. Each year, the company records a depreciation expense of $10, so accumulated depreciation will equal $10 times the number of years since the asset was acquired (when the asset is 7 years old, accumulated depreciation will be $70). Equivalently, the age of the asset will equal accumulated depreciation divided by the annual depreciation expense.
In practice, such estimates are difficult to make with great precision. Companies use depreciation methods other than the straight-line method and have numerous assets with varying useful lives and salvage values, including some assets that are fully depreciated, so this approach produces an estimate only. Moreover, fixed asset disclosures are often quite general. Consequently, these estimates may be primarily useful to identify areas for further investigation.
One further measure compares a company’s current reinvestment in productive capacity. Comparing annual capital expenditures to annual depreciation expense provides an indication of whether productive capacity is being maintained. It is a very general indicator of the rate at which a company is replacing its PPE relative to the rate at which PPE is being depreciated.
EXAMPLE 10-16 Using Fixed Asset Disclosure to Compare Companies’ Fixed Asset Turnover and Average Age of Depreciable Assets
You are analyzing the property, plant, and equipment of three international paper and paper products companies:
- AbitibiBowater Inc. (NYSE: ABY) is a Canadian company that manufactures newsprint, commercial printing papers, and other wood products.
- International Paper Company (NYSE: IP) is a U.S. paper and packaging company.
- UPM-Kymmene Corporation (UPM) is a Finnish company that manufactures fine and specialty papers, newsprint, magazine papers, and other related products. The company’s common stock is listed on the Helsinki and New York stock exchanges.
Exhibit 10-10 presents selected information from the companies’ financial statements.
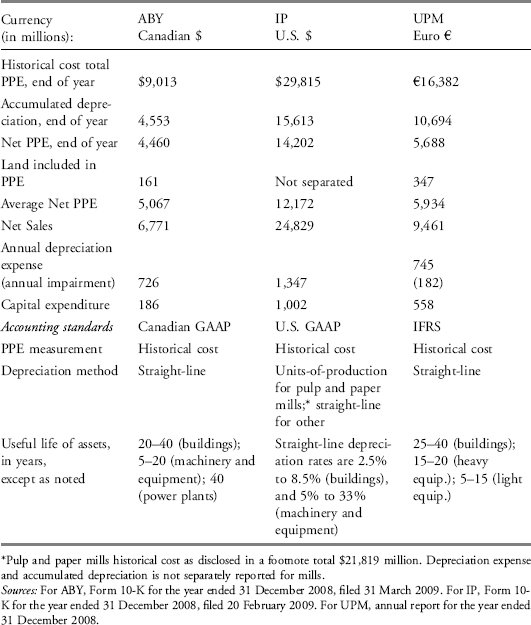
1. Based on the earlier data for each company, estimate the total useful life, age, and remaining useful life of PPE.
2. Interpret the estimates. What items might affect comparisons across these companies?
3. How does each company’s 2008 depreciation expense compare to its capital expenditures for the year?
4. Calculate and compare fixed asset turnover for each company.
Solution to 1: The following table presents the estimated total useful life, estimated age, and estimated remaining useful life of PPE for each of the companies.
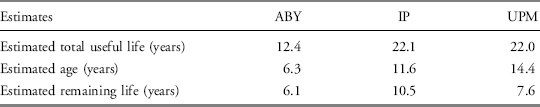
The computations are explained using UPM’s data. The estimated total useful life of PPE is total historical cost of PPE of €16,382 divided by annual depreciation expense of €745, giving 22.0 years. Estimated age and estimated remaining life are obtained by dividing accumulated depreciation of €10,694 and net PPE of €5,688 by the annual depreciation expense of €745, giving 14.4 years and 7.6 years, respectively.
Ideally, the estimates of asset lives illustrated in this example should exclude land, which is not depreciable, when the information is available; however, IP does not separately disclose land. We will use UPM, for which land appeared to be disclosed separately in the previous table, to illustrate the estimates with adjusting for land. As an illustration of the calculations to exclude land, excluding UPM’s land would give an estimated total useful life for the nonland PPE of 21.5 years [(total cost €16,382 minus land cost of €347) divided by annual depreciation expense of €745 million].
Solution to 2: The estimated total useful life suggests that IP and UPM depreciate PPE over a much longer period than ABY: 22.1 and 22.0 years for IP and UPM, respectively, versus 12.4 years for ABY. This result can be compared, to an extent, to the useful life of assets noted by the companies, and the composition of fixed assets. For instance, ABY and UPM depreciate their buildings over similar periods and their equipment over the same period (5 to 20 years). That the estimated useful life of PPE overall differs so much between the companies suggests that equipment reflects a higher proportion of ABY’s assets. An inspection of the companies’ footnoted information (not shown) on asset composition confirms that equipment accounts for a larger portion of ABY gross fixed assets (86%) compared to UPM (76%).
The estimated age of the equipment suggests that ABY has the newest PPE with an estimated age of 6.3 years. Additionally, the estimates suggest that around 50 percent of ABY’s assets’ useful lives have passed (6.3 years÷12.4 years, or equivalently, C$4,553 million÷C$9,013 million). In comparison, around 67 percent of the useful lives of the PPE of UPM have passed. Items that can affect comparisons across the companies include business differences, such as differences in composition of the companies’ operations and differences in acquisition and divestiture activity. In addition, the companies all report under different accounting standards, and IP discloses that it uses the units-of-production method for the largest component of its PPE. Differences in disclosures, for example, in the categories of assets disclosed, also can affect comparisons.
Solution to 3: Capital expenditure as a percentage of depreciation is 26 percent for ABY, 74 percent for IP, and 75 percent for UPM. Based on this measure, IP and UPM are replacing their PPE at rates closer to the rate PPE are being depreciated. ABY’s measure suggests the company is replacing its PPE at a slower rate than the PPE is being depreciated, consistent with the company’s apparently newer asset base.
Solution to 4: Fixed asset turnover for each company is presented here, calculated as total revenues divided by average net PPE. Net sales is used as an approximation for total revenues, because differences like sales returns are not consistently disclosed by companies. We can see that IP’s fixed asset turnover is highest, implying it is able to generate more sales from each unit of investment in fixed assets.
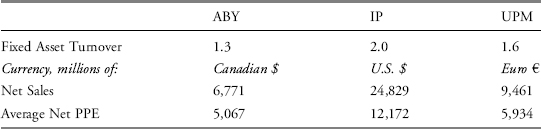
Investment property is defined under IFRS as property that is owned (or, in some cases, leased under a finance lease) for the purpose of earning rentals or capital appreciation or both.27 An example of investment property is a building owned by a company and leased out to tenants. In contrast, other long-lived tangible assets (i.e., property considered to be property, plant, and equipment) are owner-occupied properties used for producing the company’s goods and services or for housing the company’s administrative activities. Investment properties do not include long-lived tangible assets held for sale in the ordinary course of business. For example, the houses and property owned by a housing construction company are considered to be its inventory.
Under IFRS, companies are allowed to value investment properties using either a cost model or a fair value model. The cost model is identical to the cost model used for property, plant, and equipment. The fair value model, however, differs from the revaluation model used for property, plant, and equipment. Under the revaluation model, whether an asset revaluation affects net income depends on whether the revaluation initially increases or decreases the carrying amount of the asset. In contrast, under the fair value model, all changes in the fair value of the asset affect net income. To use the fair value model, a company must be able to reliably determine the property’s fair value on a continuing basis.28 Under U.S. GAAP, there is no specific definition of investment property. Most operating companies and real estate companies in the United States that hold investment-type property use the historical cost model.
Example 10-17 presents an excerpt from the annual report of a property company reporting under IFRS.
EXAMPLE 10-17 Financial Statement Presentation and Disclosures for Long-Lived Assets
The following exhibit presents an excerpt from the annual report for the year ended 31 March 2009 of Daejan Holdings PLC (London: DJAN), a property company headquartered in the United Kingdom.
EXHIBIT 10-11 Excerpt from the Consolidated Income Statements at 31 March (Currency in £ thousands)
| 2009 | 2008 | |
| Gross rental income | 83,918 | 73,590 |
| Service charge income | 12,055 | 13,362 |
| Total Rental and Related Income from Investment Properties | 95,973 | 86,952 |
| Property operating expenses | (53,470) | (46,464) |
| Net Rental and Related Income from Investment Properties | 42,503 | 40,488 |
| Profit on Disposal of Investment Properties | 6,758 | 6,578 |
| Valuation gains on investment properties | 6,646 | 46,646 |
| Valuation losses on investment properties | (268,249) | (25,982) |
| Net Valuation (Losses)/Gains on Investment Properties | (261,603) | 20,664 |
| Administrative expenses | (12,039) | (8,629) |
| Net Operating (Loss)/Profit before Net Financing Costs | (224,381) | 59,101 |
1. What was the primary cause of the company’s £224,381 thousand net operating loss before net financing costs for the year ended 31 March 2009?
2. What was the primary cause of the company’s £59,101 thousand net operating profit before financing costs for the year ended 31 March 2008?
3. What was the primary cause of the change from a £59,101 thousand net operating profit in 2008 to a £224,381 thousand net operating loss in 2009?
4. Do the valuation gains and losses on investment properties indicate that the properties have been sold?
Solution to 1: The primary cause of the company’s net operating loss for the year ended 31 March 2009 was the net valuation loss on investment properties. The net valuation loss of £262 million (valuation gain of £6,646 thousand minus the valuation loss of £268,249 thousand) exceeded the company’s net rental income plus its profit on disposal of investment properties.
Solution to 2: The primary cause of the company’s net operating profit for the year ended 31 March 2008 was the £40 million net rental income. Additionally, the company reported net valuation gains on investment properties of £21 million (valuation gain of £46,646 thousand minus the valuation loss of £25,982 thousand) and profit on disposal of investment properties of £7 million.
Solution to 3: The change from a net operating profit to a net operating loss was primarily due to valuation gains exceeding valuation losses (net valuation gains) in 2008 and valuation losses significantly exceeding valuation gains (net valuation losses) in 2009.
Solution to 4: No. The valuation gains and losses on investment properties arise from changes in the fair value of properties that are owned by the company. The gains and losses on properties that have been sold are reported as Profit (Loss) on Disposal of Investment Properties. In neither 2008 nor 2009 did the company experience a loss on disposal of investment properties so the line item was reported as Profit on Disposal of Investment Properties.
In general, a company must apply its chosen model (cost or fair value) to all of its investment property. If a company chooses the fair value model for its investment property, it must continue to use the fair value model until it disposes of the property or changes its use such that it is no longer considered investment property (e.g., it becomes owner-occupied property or part of inventory). The company must continue to use the fair value model for that property even if transactions on comparable properties, used to estimate fair value, become less frequent.
Certain valuation issues arise when a company changes the use of property such that it moves from being an investment property to owner-occupied property or part of inventory. If a company’s chosen model for investment property is the cost model, such transfers do not change the carrying amount of the property transferred. If a company’s chosen model is the fair value model, transfers from investment property to owner-occupied property or to inventory are made at fair value. In other words, the property’s fair value at the time of transfer is considered to be its cost for ongoing accounting for the property. If a company’s chosen model for investment property is the fair value model and it transfers a property from owner-occupied to investment property, the change in measurement of the property from depreciated cost to fair value is treated like a revaluation. If a company’s chosen model is the fair value model and it transfers a property from inventory to investment property, any difference between the inventory carrying amount and the property’s fair value at the time of transfer is recognized as profit or loss.
Investment property appears as a separate line item on the balance sheet. Companies are required to disclose whether they use the fair value model or the cost model for their investment property. If the company uses the fair value model, it must make additional disclosures about how it determines fair value and must provide reconciliation between the beginning and ending carrying amounts of investment property. If the company uses the cost model, it must make additional disclosures similar to those for property, plant, and equipment—for example, the depreciation method and useful lives must be disclosed. In addition, if the company uses the cost model, it must also disclose the fair value of investment property.
A lease is a contract between the owner of an asset—the lessor—and another party seeking use of the assets—the lessee. Through the lease, the lessor grants the right to use the asset to the lessee. The right to use the asset can be a long period, such as 20 years, or a much shorter period, such as a month. In exchange for the right to use the asset, the lessee makes periodic lease payments to the lessor. A lease, then, is a form of financing to the lessee provided by the lessor that enables the lessee to purchase the use of the leased asset.
9.1. The Lease versus Buy Decision
There are several advantages to leasing an asset compared to purchasing it. Leases can provide less costly financing, usually require little, if any, down payment, and are often at fixed interest rates. The negotiated lease contract may contain less restrictive provisions than other forms of borrowing. A lease can also reduce the risks of obsolescence, residual value, and disposition to the lessee because the lessee does not own the asset. The lessor may be better positioned to manage servicing the asset and to take advantage of tax benefits of ownership. As a result, leasing the asset may be less costly than owning the asset for the lessee.
Leases also have perceived financial and tax reporting advantages. While providing a form of financing, certain types of leases are not reported as debt on the balance sheet. The items leased under these types of leases also do not appear as assets on the balance sheet. Therefore, no interest expense or depreciation expense is included in the income statement. Additionally, in some countries such as the United States, financial reporting standards may differ from reporting under tax regulations; thus, in some cases, a company may own an asset for tax purposes (and thus obtain deductions for depreciation expense for tax purposes) while not reflecting the ownership in its financial statements. A lease that is structured to provide a company with the tax benefits of ownership while not requiring the asset to be reflected on the company’s financial statements is known as a synthetic lease.
9.2. Finance versus Operating Leases
Differences in economic substance and accounting exist for two main types of leases—finance and operating. The economic substance of a finance (or capital)29 lease is different from an operating lease, as are the implications of each for the financial statements of the lessee and lessor. In substance, a finance lease is equivalent to the purchase of some asset (lease to own) by the buyer (lessee) that is directly financed by the seller (lessor). An operating lease is an agreement allowing the lessee to use the asset for a period of time, essentially a rental.
Under IFRS, if substantially all the risks and rewards incidental to ownership are transferred to the lessee, the lease is classified as a finance lease and the lessee reports a leased asset and a lease obligation on the balance sheet.30 Otherwise, the lease is reported as an operating lease. While a similar principle of the transfer of benefits and risks guides U.S. GAAP, U.S. accounting standards are currently more prescriptive in their criteria for classifying finance and operating leases. Under U.S. GAAP, a lease that meets any one of four specific requirements is classified as a finance lease; however, recently proposed accounting standards would eliminate those criteria.31
The example following illustrates and compares the accounting and financial statement effects of buying an asset using debt, leasing an asset under an operating lease, and leasing an asset under a finance lease.
EXAMPLE 10-18 Comparison of Accounting and Financial Statement Effects of the Buy versus Lease Decision
Bi-ly Company is considering the following alternatives in obtaining the use of a new piece of equipment at the beginning of Year 1:
Alternative 1: Buy the equipment and finance the purchase with new debt.
Alternative 2: Lease the equipment under an operating lease (the equipment is not reported as an asset, the lease payments each period are treated as an operating expense on the income statement).
Alternative 3: Lease the equipment under a finance lease (the equipment is reported as an asset and an obligation is recorded equal to the present value of future lease payments).
The fair value of the equipment, having a five-year useful life and no salvage value, is $1,000. If Bi-ly leases the equipment, annual lease payments would be $264 due at the end of each year. Bi-ly’s discount rate is 10 percent. The company uses straight-line depreciation. (For illustration, assume the company can record the lease as either operating or financing.)
1. For each alternative under consideration, determine the effect on assets and liabilities at the beginning of Year 1.
2. For each alternative, determine the effect on the income statement in Year 1.
3. For each alternative, calculate Bi-ly’s return on assets and debt-to-asset ratio at the end of Year 1. For simplicity, assume that—excluding any effects of Bi-ly’s choice among the three alternatives for obtaining the assets—total assets at the beginning and end of the year are $4,500, total liabilities at the beginning and end of the year are $3,000, and net income for the year is $800.
Solution to 1: At the beginning of Year 1, Bi-ly would show the following assets and debt:

Solution to 2: For Year 1, Bi-ly would show the following expenses related to the equipment:
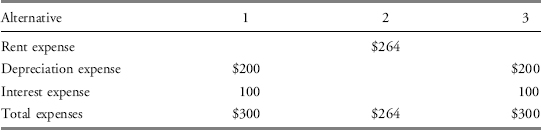
For Alternatives 1 and 3, depreciation expense is the acquisition cost of $1,000 divided by the 5-year useful life. Salvage value is 0.
For Alternatives 1 and 3, interest expense is the beginning balance of debt, $1,000 times the discount rate of 10 percent. Each year the interest expense will decline.
For Alternative 2, rent expense is the lease payment of $264.
Solution to 3: To calculate the return on assets:
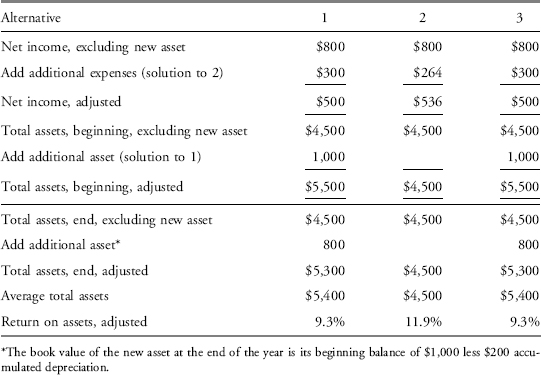
In this example, the highest return on assets is found when the equipment is leased under an operating lease which is expected because net income is highest and the asset base is lowest. Buying an asset and seeking to finance it with new debt and leasing it under a finance lease result in the same return on assets.
To calculate the debt-to-asset ratio at the end of the year:
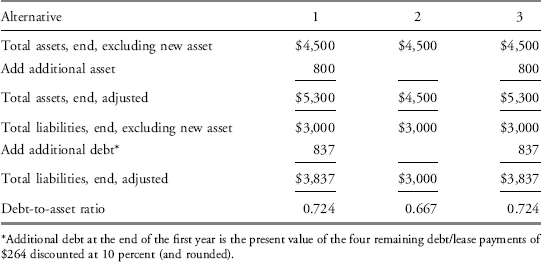
In this example, the lowest debt-to-asset ratio is found when the equipment is financed through an operating lease. Buying an asset and seeking to finance it with new debt and leasing it under a finance lease result in the same return on assets.
9.2.1. Accounting and Reporting by the Lessee
A finance lease is economically similar to borrowing money and buying an asset; therefore, a company that enters into a finance lease as the lessee reports an asset (leased asset) and related debt (lease payable) on the balance sheet. The initial value of both the leased asset and the lease payable is the lower of the fair value of the leased asset or the present value of future lease payments. On the income statement, the company reports interest expense on the debt; and if the asset acquired is depreciable, the company reports depreciation expense. (The lessor, as we illustrate in Section 9.2.2, reports the sale of an asset and the lease as a receivable.)
Because an operating lease is economically similar to renting an asset, the lessee records a lease expense on its income statement during the period it uses the asset. No asset or liability is recorded on its balance sheet. The main accounting differences between a finance lease and an operating lease are that under a finance lease, reported debt and assets are higher and expenses are generally higher in the early years. Because of the higher reported assets, debt and expenses—and therefore the lower ROA, all else equal—lessees often prefer operating leases to finance leases. As we illustrate in the next section, lessors’ preferences generally differ. Lessors would prefer a finance lease because, under an operating lease, lessors continue to show the asset and its associated financing on their balance sheets.
On the lessee’s statement of cash flows, for an operating lease, the full lease payment is shown as an operating cash outflow. For a finance lease, only the portion of the lease payment relating to interest expense potentially reduces operating cash flows,32 the portion of the lease payment that reduces the lease liability appears as a cash outflow in the financing section.
A company reporting a lease as an operating lease will typically show higher profits in early years, higher return measures in early years, and a stronger solvency position than an identical company reporting an identical lease as a finance lease. However, the company reporting the lease as a finance lease will show higher operating cash flows because a portion of the lease payment will be reflected as a financing cash outflow rather than an operating cash outflow.
The following example illustrates the effect on a lessee’s income, debt, and cash flows when reporting a lease as a finance lease versus an operating lease.
EXAMPLE 10-19 Financial Statement Impact of a Finance versus an Operating Lease for the Lessee
Assume two similar (hypothetical) companies, CAPBS Inc. and OPIS Inc., enter into similar lease agreements for a piece of machinery on 1 January Year 1. The leases require four annual payments of €28,679 starting on 1 January Year 1. The useful life of the machine is four years and its salvage value is zero. CAPBS accounts for the lease as a finance lease and uses straight-line depreciation, while OPIS has determined the lease is an operating lease. For simplicity, this example assumes that the accounting rules governing these hypothetical companies do not mandate either type of lease. The present value of lease payments and fair value of the equipment is €100,000. (A reminder relevant for present value calculations: Lease payments are made at the beginning of each period.)
At the beginning of Year 1, before entering into the lease agreements, both companies reported liabilities of €100,000 and equity of €200,000. Each year the companies receive total revenues of €50,000, and all revenues are cash. Assume the companies have a tax rate of 30 percent, and use the same accounting for financial and tax purposes. Both companies’ discount rate is 10 percent. In order to focus only on the differences in the type of lease, assume neither company incurs expenses other than those associated with the lease, and neither invests excess cash.
1. Which company reports higher expenses/net income in Year 1? Over the four years?
2. Which company reports higher total cash flow over the four years? Cash flow from operations?
3. Based on return on equity (ROE), how do the two companies’ profitability measures compare?
4. Based on the ratio of debt-to-equity, how do the two companies’ solvency positions compare?
Solution to 1: In Year 1 and Year 2, CAPBS reports higher expenses because the depreciation expense and interest expense of its finance lease exceeds the lease expense of OPIS’s operating lease. Therefore, OPIS reports higher net income in Year 1 and Year 2. The companies’ total expense over the entire four-year period, however, is equal as is the companies’ total net income.
Each year, OPIS reports lease expense of €28,679 associated with its operating lease. For CAPBS, its finance lease is treated as being economically similar to borrowing money and purchasing an asset. So, on its income statement, CAPBS reports depreciation expense on the leased asset acquired and interest expense on the lease liability.
The following table shows by year CAPBS’s depreciation expense and book values on the leased asset.
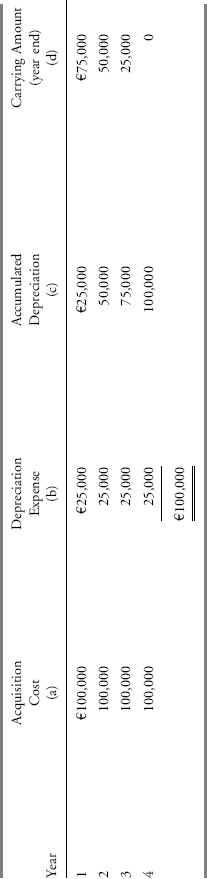
- Column (a) is acquisition cost of €100,000 of the leased equipment.
- Column (b) is depreciation expense of €25,000 per year, calculated using the straight line convention, as the acquisition costs less salvage value divided by useful life [(€100,000 − €0)/4 years].
- Column (c) is the accumulated depreciation on the leased asset calculated as the prior year’s accumulated depreciation plus the current year’s depreciation expense.
- Column (d) is the carrying amount at year end of the leased equipment, which is the difference between the acquisition cost and accumulated depreciation.
The following table shows CAPBS’s lease payment, interest expense, and carrying amount for its lease liability by year.33
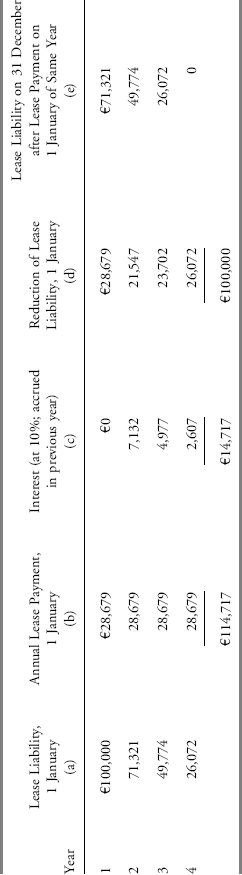
- Column (a) is the lease liability at the beginning of the year.
Year 1: €100,000
Years thereafter: lease liability at end of previous year
- Column (b) is the annual lease payment made at the beginning of the year. Part of the lease payment pays any interest accrued in the previous year, and the remainder of the lease payment reduces the lease liability. For example, in Year 2, the €28,679 paid on 1 January reduces the interest payable of €7,132 that accrued in Year 1 (0.10 × 71,321) and then reduces the lease liability by €21,547.
- Column (c) is the interest portion of the 1 January lease payment made on that date. This amount of interest was accrued as interest payable during the prior year and is reported as the interest expense of the prior year.
- Column (d) is the reduction of the lease liability, which is the difference between the annual lease payment and the interest portion.
- Column (e) is the lease liability on 31 December of a given year just before the lease payment is made on the first day of the next year. It is equal to the lease liability on 1 January of the same year (column a) less the reduction of the lease liability (column d).
The following table summarizes and compares the income statement effects of the lease for CAPBS and OPIS. Notice that over the four-year lease, both companies report the same total amount of expense but CAPBS shows higher expenses earlier in the life of the lease.
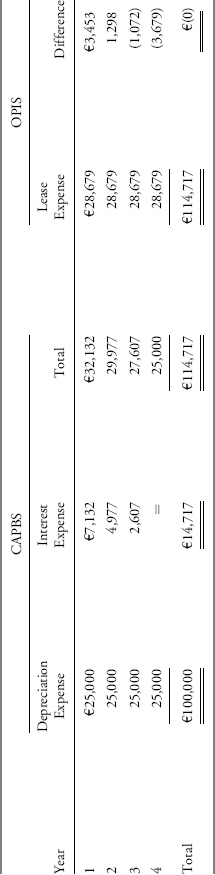
The complete income statements for CAPBS and OPIS follow. Notice under the assumption that the same accounting is used for financial and tax purposes, CAPBS’s taxes are lower in Year 1 and Year 2. The lower taxes in the earlier years reflect the higher expenses in those years.
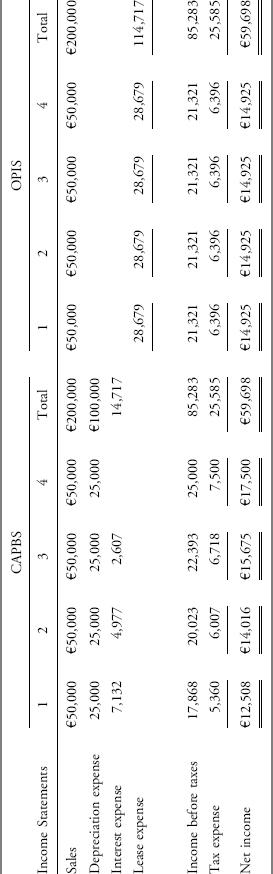
Solution to 2: On the statement of cash flows, observe that over the four years, both CAPBS and OPIS report the same total change in cash of €59,698. Operating cash flows reported by CAPBS are higher because a portion of the lease payment each year is categorized as a financing cash flow rather than an operating cash flow. In the first two years, CAPBS’s change in cash is higher due to its lower taxes in those years.
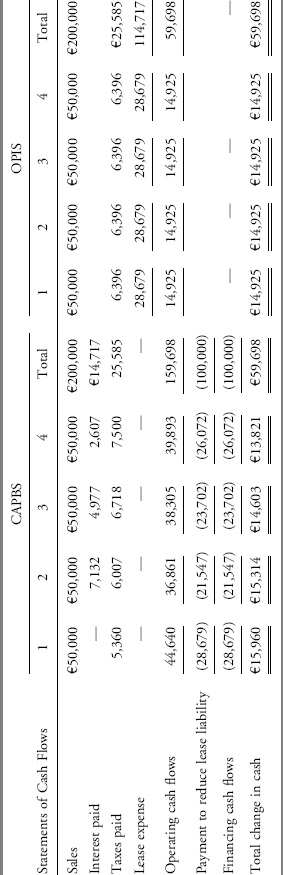
Solution to 3: Based on ROE, CAPBS looks less profitable than OPIS in the earlier years. Computing ROE requires forecasting shareholders’ equity. In general, ending Shareholders’ equity = Beginning shareholders’ equity+Net income+Other comprehensive income − Dividends+Net capital contributions by shareholders. Because the companies in this example do not have other comprehensive income, did not pay dividends, and experienced no capital contributions from shareholders, Ending shareholders’ equity = Beginning shareholders’ equity+Net income. The forecasts are presented here.
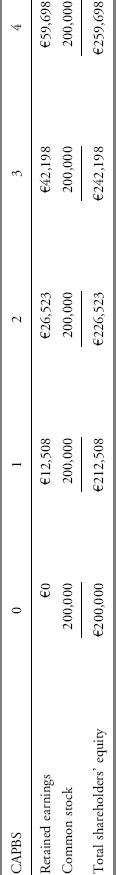
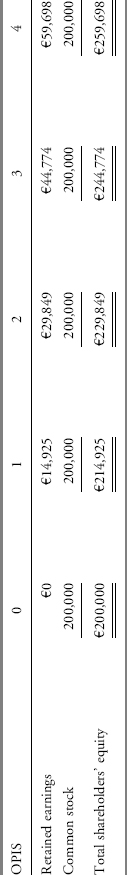
ROE is calculated as Net income divided by Average shareholders’ equity. For example, CAPBS Inc. had Year 1 ROE of 6.1 percent: €12,508/ [(€200,000+€212,508)/2].
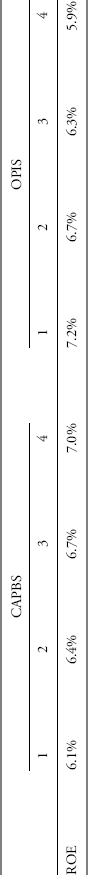
Solution to 4: Based on the ratio of debt-to-equity, the solvency position of CAPBS appears weaker than that of OPIS.
For the debt-to-equity ratio, take the total shareholders’ equity from Part 3 given earlier. Initially, both companies had reported liabilities of €100,000. For OPIS, the amount of total liabilities remains constant at €100,000. For CAPBS, add the lease liability at the end of the year and the amount of accrued interest payable at the end of each year from Part 1. So at the end of Year 1, CAPBS’s total liabilities are €178,453 (€100,000+€71,321 lease liability+€7,132 accrued interest payable at the end of the year), and its debt-to-equity ratio is 0.84 (€178,453/€212,508). At the end of Year 2, CAPBS total liabilities equal €154,751 (€100,000+€49,774 lease liability+€4,977 accrued interest payable at the end of the year). The remaining years are computed in the same manner. The following table presents the ratios for each year.
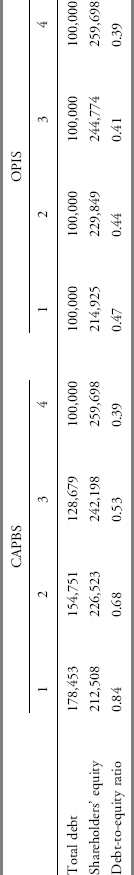
In summary, a company reporting a lease as an operating lease will typically show higher profits in early years, higher return measures in early years, and a stronger solvency position than an identical company reporting an identical lease as a finance lease.34 However, the company reporting the lease as a finance lease will show higher operating cash flows because a portion of the lease payment will be reflected as a financing cash outflow rather than an operating cash outflow.
The precisely defined accounting standards in the United States that determine when a company should report a capital (finance) versus an operating lease enable a company to structure a lease so as to avoid meeting any of the four capital lease criteria and thereby record an operating lease. Similar to debt disclosures, lease disclosures show payments under both capital and operating leases for the next five years and afterwards. Future payments under U.S. GAAP are disclosed year by year for the first five years and then aggregated for all subsequent years. Under IFRS, future payments are disclosed for the first year, in aggregate for years two through five, and then in aggregate for all subsequent years. These disclosures can help to estimate the extent of a company’s off-balance-sheet lease financing through operating leases. Example 10-20 illustrates the disclosures and how these disclosures can be used to determine the effect on the financial statements if all operating leases were capitalized.
EXAMPLE 10-20 Financial Statement Impact of Treating Operating Leases as Finance Leases for the Lessee
CEC Entertainment, Inc. (NYSE: CEC) has significant commitments under capital (finance) and operating leases. Following is selected financial statement information and note disclosure to the financial statements for the company.
Commitments and Contingencies Footnote from CEC’s Financial Statements:
8. Commitments and contingencies:
The company leases certain restaurants and related property and equipment under operating and capital leases. All leases require the company to pay property taxes, insurance, and maintenance of the leased assets. The leases generally have initial terms of 10 to 20 years with various renewal options.
Scheduled annual maturities of the obligations for capital and operating leases as of 28 December 2008 are as follows (US$ thousands):
| Years | Capital | Operating |
| 2009 | $1,683 | $66,849 |
| 2010 | 1,683 | 66,396 |
| 2011 | 1,683 | 66,558 |
| 2012 | 1,600 | 65,478 |
| 2013 | 1,586 | 63,872 |
| Thereafter | 9,970 | 474,754 |
| Minimum future lease payments | 18,205 | $803,907 |
| Less amounts representing interest | (5,997) | |
| Present value of future minimum lease payments | 12,208 | |
| Less current portion | (806) | |
| Long-term finance lease obligation | $11,402 |
Selected Financial Statement Information for CEC:
| 28 December 2008 | 30 December 2007 | |
| Total liabilities | $608,854 | $519,900 |
| Shareholders’ equity | $128,586 | $217,993 |
1. A. Calculate the implicit interest rate used to discount the “scheduled annual maturities” under capital leases to obtain the “present value of future minimum lease payments” of $12,208 disclosed in the Commitments and Contingencies footnote. To simplify the calculation, assume that future minimum lease payments on the company’s capital leases for the “thereafter” lump sum are as follows: $1,586 on 31 December of each year from 2014 to 2019, and $454 in 2020. Assume annual lease payments are made at the end of each year.
B. Why is the implicit interest rate estimate in Part A important in assessing a company’s leases?
2. If the operating lease agreements had been treated as capital leases, what additional amount would be reported as a lease obligation on the balance sheet at 28 December 2008? To simplify the calculation, assume that future minimum lease payments on the company’s operating leases for the “thereafter” lump sum are as follows: $63,872 on 31 December each year from 2014 to 2020, and $27,650 in 2021. Based on the implicit interest rate obtained in Part 1A, use 7.245 percent to discount future cash flows on the operating leases.
3. What would be the effect on the debt-to-equity ratio of treating all operating leases as finance leases (i.e., the ratio of total liabilities to equity) at 28 December 2008?
Solution to 1A: The implicit interest rate on finance leases is 7.245 percent. The implicit interest rate used to discount the finance lease payments is the internal rate of return on the stream of cash flows; that is, the interest rate that will make the present value of the lease payments equal to $12,208. You can use an Excel spreadsheet or a financial calculator for the computations. Set the cash flow at time zero equal to $12,208 (note on Excel and on most financial calculators, you will input this amount as a negative number), input each of the annual payments on the finance leases, and solve for the internal rate of return.
To demonstrate how the internal rate of return corresponds to the individual present values, refer to the following schedule of the undiscounted minimum lease payments based on information from footnote 8 and the assumptions given. Exhibit 10-12 presents the present value computations.
EXHIBIT 10-12 Present Value Computations

The interest rate of 7.245 percent approximately equates the future minimum lease payments with the present value of future minimum lease payments of $12,208 that CEC reports.
Solution to 1B: The implicit interest rate is important because it will be used to estimate the present value of the lease obligations reported as a liability, the value of the leased assets on the balance sheet, the interest expense, and the lease amortization on the income statement. For instance, by selecting a higher rate a company could, if desired, opportunistically reduce the present value of its finance leases and thus its reported debt. The reasonableness of the implicit interest rate can be gauged by comparing it to the interest rates of the company’s other debt instruments outstanding, which are disclosed in financial statement footnotes, and by considering recent market conditions. Note, however, that the interest rate implicit in capitalization of the finance lease obligations reflects the interest rate at the time the lease occurred and thus may differ from current rates.
Solution to 2: If the operating leases had been treated as finance leases, the additional amount that would be reported as a lease obligation on the balance sheet at 28 December 2008, using a discount rate of 7.245 percent determined in Part 1 given earlier, is $520,256. Exhibit 10-13 presents the present value computations. An alternative short cut approach is to divide the discounted finance lease cash flows of $12,208 by the undiscounted finance lease cash flows of $18,205 and then apply the resulting percentage of 67.06 percent to the undiscounted operating lease cash flows of $803,907. The shortcut approach estimates the present value of the operating lease payments as $539,100, which is close to the estimate obtained using the longer method. It is likely to be most accurate when the timing and relative quantities of the two sets of cash flows are similar.
EXHIBIT 10-13 Present Value Computations
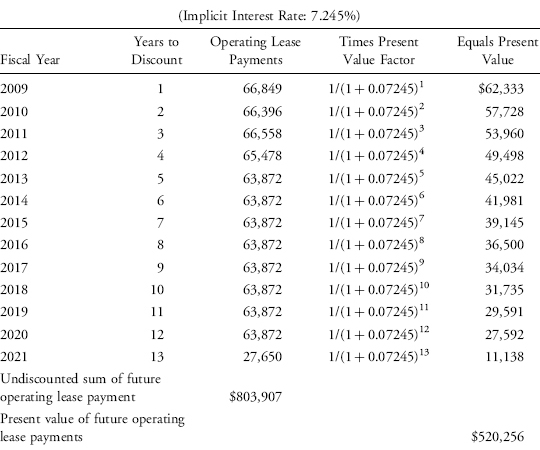
Solution to 3: The debt-to-equity ratio almost doubles, increasing to 8.78x from 4.74x when capitalizing the operating leases. The adjusted debt-to-equity ratio is computed as follows:
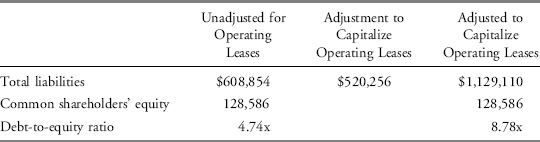
9.2.2. Accounting and Reporting by the Lessor
Lessors that report under U.S. GAAP determine whether a lease is a finance (also called “capital lease”) or operating lease using the same four criteria as a lessee, plus additional revenue recognition criteria. If a lessor enters into an operating lease, the lessor records any lease revenue when earned. The lessor also continues to report the leased asset on the balance sheet and the asset’s associated depreciation expense on the income statement.
Under a finance lease, the lessor reports a lease receivable based on the present value of future lease payments, and the lessor also reduces its assets by the carrying amount of the asset leased. Under U.S. GAAP, the carrying amount of the asset leased relative to the present value of lease payments distinguishes a direct financing lease from a sales-type lease. The income statement will show interest revenue on the lease.
EXAMPLE 10-21 Financial Statement Impact of a Direct Financing Lease versus Operating Lease for the Lessor
Assume two similar (hypothetical) companies, DIRFIN Inc. and LOPER Inc., own a similar piece of machinery and make similar agreements to lease the machinery on 1 January Year 1. In the lease contract, each company requires four annual payments of €28,679 starting on 1 January Year 1. The useful life of the machine is four years and its salvage value is zero. DIRFIN Inc. accounts for the lease as a direct financing lease while LOPER has determined the lease is an operating lease. (For simplicity, this example assumes that the accounting rules governing these hypothetical companies do not mandate either type of lease.) The present value of lease payments and fair value of the equipment is €100,000.
At the beginning of Year 1, before entering into the lease agreement, both companies reported liabilities of €100,000 and equity of €200,000. Assets on hand include the asset about to be leased. Each year the companies receive total revenues of €50,000 cash, apart from any revenue earned on the lease. Assume the companies have a tax rate of 30 percent, and use the same accounting for financial and tax purposes. Both companies’ discount rate is 10 percent. In order to focus only on the differences in the type of lease, assume that neither company incurs revenues or expenses other than those associated with the lease and that neither invests excess cash.
1. Which company reports higher expenses/net income in Year 1? Over the four years?
2. Which company reports higher total cash flow over the four years? Cash flow from operations?
3. Based on ROE, how do the two companies’ profitability measures compare?
Solution to 1: LOPER reports higher expenses in Year 1 because, under an operating lease, the lessor retains ownership of the asset and continues to report associated depreciation expense. DIRFIN, treating the lease as a finance lease, does not reflect ownership of the asset or the associated depreciation expense. DIRFIN has higher net income in Year 1 because the interest revenue component of the lease payment in that year exceeds the lease revenue net of depreciation reported by LOPER.
On its income statement, LOPER reports depreciation expense for the asset it has leased and lease revenue based on the lease payment received. The following table shows LOPER’s depreciation and book values on leased equipment by year.35
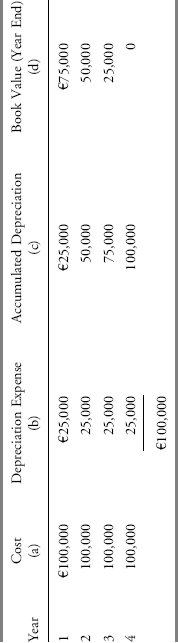
- Column (a) is the cost of €100,000 of the leased equipment.
- Column (b) is depreciation expense of €25,000 per year, calculated using the straight-line method as the cost less the salvage value divided by the useful life [(€100,000 − €0)/4 years].
- Column (c) is the accumulated depreciation on the leased asset calculated as the prior year’s accumulated depreciation plus the current year’s depreciation expense.
- Column (d) is the ending book value of the leased equipment, which is the difference between the cost and accumulated depreciation.
DIRFIN, however, records the lease as a direct financing lease. It removes the leased asset from its assets and records a lease receivable. On its income statement, DIRFIN reports interest revenues earned from financing the lease. The table following shows DIRFIN’s interest revenues and carrying amounts on the lease receivable.
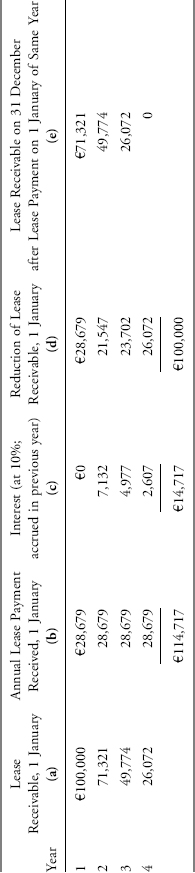
- Column (a) is the lease receivable at the beginning of the year.
- Column (b) is annual lease payment received at the beginning of the year, which is allocated to interest and reduction of the lease receivable.
- Column (c) is interest accrued in the previous year calculated as the lease receivable outstanding for the year times the interest rate.
- Column (d) is the reduction of the lease receivable which is the difference between the annual lease payments received and interest. Because the lease payment is due on 1 January, this amount of interest is a receivable at the end of the prior year and is reported as interest revenue in the prior year.
- Column (e) is the lease receivable after the lease payment is received and at the end of the year. It is the lease receivable at 1 January (Column a) less the reduction of the lease receivable (Column d).
The table following summarizes and compares the income statement effects of the lease for DIRFIN and LOPER. Notice that over the four-year lease, both companies report the same total amount of revenue, but DIRFIN’s revenues in the earlier years of the lease are higher than the net of lease revenues less depreciation reported by LOPER in those years.
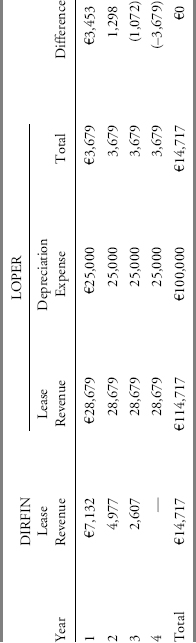
The complete income statements for DIRFIN and LOPER follow. Notice that, under the assumption that the same accounting is used for financial and tax purposes, DIRFIN’s taxes are higher than those of LOPER in Years 1 and 2.
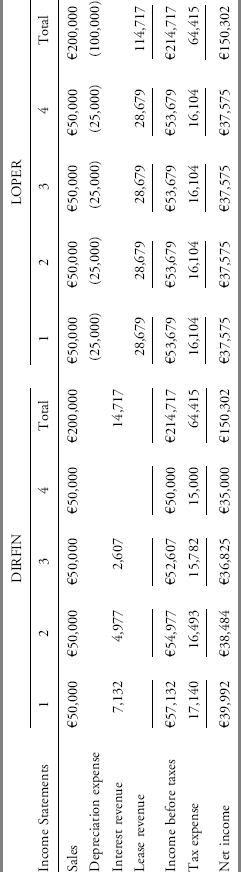
Solution to 2: Looking at the statement of cash flows, observe that operating cash flows reported by DIRFIN are lower, but investing cash flows are higher than LOPER. Over the four years, both DIRFIN and LOPER report the same total change in cash.
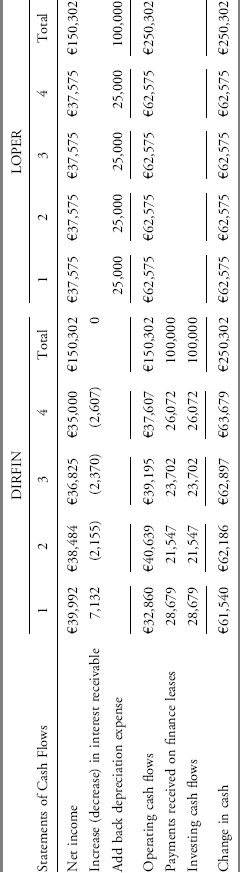
Solution to 3: Based on ROE, DIRFIN appears more profitable than LOPER in the early years of the lease.
Computing ROE requires forecasting shareholders’ equity. In general, Ending shareholders’ equity = Beginning shareholders’ equity+Net income+Other comprehensive income − Dividends+Net capital contributions by shareholders. Because the companies in this example do not have other comprehensive income, do not pay dividends, and have no capital contributions, Ending shareholders’ equity = Beginning shareholders’ equity+Net income. The forecasts are presented here.
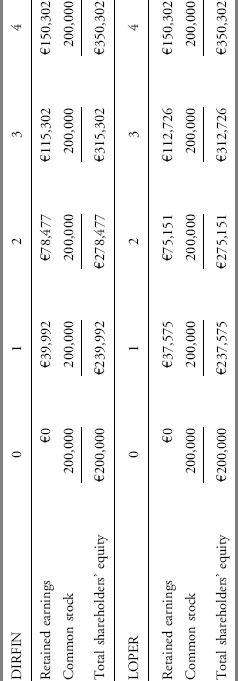
ROE is calculated as net income divided by average shareholders’ equity. For example, DIRFIN Inc. had Year 1 ROE of 18.2 percent: €39,992/[(€200,000+€239,992)/2].
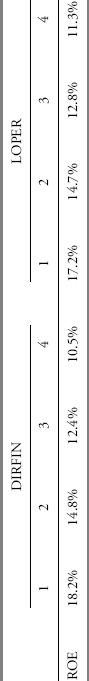
From the comparisons given earlier, DIRFIN looks more profitable in the early years of the lease, but less profitable in the later years.
U.S. GAAP make a further distinction in defining two types of nonoperating leases: (1) direct financing leases, and (2) sales-type leases from the lessor’s perspective.36 A direct financing lease results when the present value of lease payments (and thus the amount recorded as a lease receivable) equals the carrying amount of the leased asset. Because there is no “profit” on the asset itself, the lessor is essentially providing financing to the lessee, and the revenues earned by the lessor are financing in nature (i.e., interest revenue). If, however, the present value of lease payments (and thus the amount recorded as a lease receivable) exceeds the carrying value of the leased asset, the lease is treated as a sale.
When a company enters into a sales-type lease, a lease agreement where the present value of lease payment is greater than the value of the leased asset to the lessor, it will show a profit on the transaction in the year of inception and interest revenue over the life of the lease.
EXAMPLE 10-22 Financial Statement Impact of a Sales-Type Lease for the Lessor
Assume a (hypothetical) company, Selnow Inc., owns a piece of machinery and enters into an agreement to lease the machinery on 1 January Year 1. In the lease contract, the company requires four annual payments of €28,679 starting on 1 January Year 1. The present value of the lease payments (using a 10 percent discount rate) is €100,000, and the fair value of the equipment is €90,000. The useful life of the machinery is four years and its salvage value is zero.
1. Is the lease a direct financing or sales-type lease?
2. What is Selnow’s income related to the lease in Year 1? In Year 2? Ignore taxes.
Solution to 1: This is a sales-type lease: The present value of lease payments is more than the lessor’s carrying amount of the leased asset. The difference between the present value of the lease payments and the carrying amount of the leased asset is the lessor’s profit from selling the machinery. The lessor will record a profit of €10,000 on the sale of the leased equipment in Year 1 (€100,000 present value of lease payments receivable less €90,000 value of leased equipment).
Solution to 2: In Year 1, Selnow shows income of €17,132 related to the lease. One part of this is the €10,000 gain on the sale of the lease equipment (sales revenues of €100,000 less costs of goods sold of €90,000). Selnow also shows interest revenue of €7,132 on its financing of the lease (lease receivable of €71,321 after the initial lease payment is received times the 10 percent discount rate). In Year 2, Selnow reports only the interest revenue of €4,977 (lease receivable of €49,774 after the 1 January lease payment is received times the 10 percent discount rate). The table following shows lease payments received, interest revenue, and reduction of the lease receivable for Selnow’s sales-type lease. Note that this table is the same as DIRFIN’s table in the previous example with the direct financing lease. They are the same because the present value of the lease payments in both cases is the same. It is the fair value of the equipment that differs between the two examples.
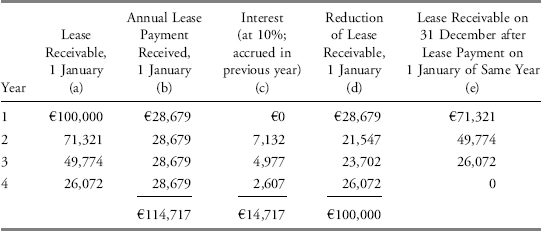
Understanding the reporting of long-lived assets at inception requires distinguishing between expenditures that are capitalized (i.e., reported as long-lived assets) and those that are expensed. Once a long-lived asset is recognized, it is reported under the cost model at its historical cost less accumulated depreciation (amortization) and less any impairment or under the revaluation model at its fair value. IFRS permit the use of either the cost model or the revaluation model, whereas U.S. GAAP require the use of the cost model. Most companies reporting under IFRS use the cost model. The choice of different methods to depreciate (amortize) long-lived assets can create challenges for analysts comparing companies.
Key points include the following:
- Expenditures related to long-lived assets are capitalized as part of the cost of assets if they are expected to provide future benefits, typically beyond one year. Otherwise, expenditures related to long-lived assets are expensed as incurred.
- Although capitalizing expenditures, rather than expensing them, results in higher reported profitability in the initial year, it results in lower profitability in subsequent years; however, if a company continues to purchase similar or increasing amounts of assets each year, the profitability-enhancing effect of capitalization continues.
- Capitalizing an expenditure rather than expensing it results in a greater amount reported as cash from operations because capitalized expenditures are classified as an investing cash outflow rather than an operating cash outflow.
- Companies must capitalize interest costs associated with acquiring or constructing an asset that requires a long period of time to prepare for its intended use.
- Including capitalized interest in the calculation of interest coverage ratios provides a better assessment of a company’s solvency.
- IFRS require research costs be expensed but allow all development costs (not only software development costs) to be capitalized under certain conditions. Generally, U.S. accounting standards require that research and development costs be expensed; however, certain costs related to software development are required to be capitalized.
- When one company acquires another company, the transaction is accounted for using the acquisition method of accounting in which the company identified as the acquirer allocates the purchase price to each asset acquired (and each liability assumed) on the basis of its fair value. Under acquisition accounting, if the purchase price of an acquisition exceeds the sum of the amounts that can be allocated to individual identifiable assets and liabilities, the excess is recorded as goodwill.
- The capitalized costs of long-lived tangible assets and of intangible assets with finite useful lives are allocated to expense in subsequent periods over their useful lives. For tangible assets, this process is referred to as depreciation, and for intangible assets, it is referred to as amortization.
- Long-lived tangible assets and intangible assets with finite useful lives are reviewed for impairment whenever changes in events or circumstances indicate that the carrying amount of an asset may not be recoverable.
- Intangible assets with an indefinite useful life are not amortized but are reviewed for impairment annually.
- Impairment disclosures can provide useful information about a company’s expected cash flows.
- Methods of calculating depreciation or amortization expense include the straight-line method, in which the cost of an asset is allocated to expense in equal amounts each year over its useful life; accelerated methods, in which the allocation of cost is greater in earlier years; and the units-of-production method, in which the allocation of cost corresponds to the actual use of an asset in a particular period.
- Estimates required for depreciation and amortization calculations include the useful life of the equipment (or its total lifetime productive capacity) and its expected residual value at the end of that useful life. A longer useful life and higher expected residual value result in a smaller amount of annual depreciation relative to a shorter useful life and lower expected residual value.
- IFRS permit the use of either the cost model or the revaluation model for the valuation and reporting of long-lived assets, but the revaluation model is not allowed under U.S. GAAP.
- Under the revaluation model, carrying amounts are the fair values at the date of revaluation less any subsequent accumulated depreciation or amortization.
- In contrast with depreciation and amortization charges, which serve to allocate the cost of a long-lived asset over its useful life, impairment charges reflect an unexpected decline in the fair value of an asset to an amount lower than its carrying amount.
- IFRS permit impairment losses to be reversed, with the reversal reported in profit. U.S. GAAP do not permit the reversal of impairment losses.
- The gain or loss on the sale of long-lived assets is computed as the sales proceeds minus the carrying amount of the asset at the time of sale.
- Estimates of average age and remaining useful life of a company’s assets reflect the relationship between assets accounted for on a historical cost basis and depreciation amounts.
- The average remaining useful life of a company’s assets can be estimated as net PPE divided by depreciation expense, although the accounting useful life may not necessarily correspond to the economic useful life.
- Long-lived assets reclassified as held for sale cease to be depreciated or amortized. Long-lived assets to be disposed of other than by a sale (e.g., by abandonment, exchange for another asset, or distribution to owners in a spin-off) are classified as held for use until disposal. Thus, they continue to be depreciated and tested for impairment.
- Investment property is defined as property that is owned (or, in some cases, leased under a finance lease) for the purpose of earning rentals, capital appreciation, or both.
- Under IFRS, companies are allowed to value investment properties using either a cost model or a fair value model. The cost model is identical to the cost model used for property, plant, and equipment, but the fair value model differs from the revaluation model used for property, plant, and equipment. Under the fair value model, all changes in the fair value of investment property affect net income.
- Under U.S. GAAP, investment properties are generally measured using the cost model.
- Accounting standards generally define two types of leases: operating leases and finance (or capital) leases. Current U.S. GAAP specify four criteria to determine when a lease is classified as a capital lease, although proposed standards would eliminate those specific criteria. IFRS are less prescriptive in determining the classification of a lease as a finance lease.
- When a lessee reports a lease as an operating lease rather than a finance lease, it usually appears more profitable in early years of the lease and less so later, and it appears less leveraged over the entire lease period.
- When a lessor reports a lease as a finance lease rather than an operating lease, it usually appears more profitable in early years of the lease.
1. JOOVI Inc. has recently purchased and installed a new machine for its manufacturing plant. The company incurred the following costs:
| Purchase price | $12,980 |
| Freight and insurance | $1,200 |
| Installation | $700 |
| Testing | $100 |
| Maintenance staff training costs | $500 |
The total cost of the machine to be shown on JOOVI’s balance sheet is closest to:
A. $14,180.
B. $14,980.
C. $15,480.
2. BAURU, S.A., a Brazilian corporation, borrows capital from a local bank to finance the construction of its manufacturing plant. The loan has the following conditions:
| Borrowing date | 1 January 2009 |
| Amount borrowed | 500 million Brazilian real (BRL) |
| Annual interest rate | 14 percent |
| Term of the loan | 3 years |
| Payment method | Annual payment of interest only. Principal amortization is due at the end of the loan term. |
The construction of the plant takes two years, during which time BAURU earned BRL 10 million by temporarily investing the loan proceeds. Which of the following is the amount of interest related to the plant construction (in BRL million) that can be capitalized in BAURU’s balance sheet?
A. 130
B. 140
C. 210
3. After reading the financial statements and footnotes of a company that follows IFRS, an analyst identified the following intangible assets:
- product patent expiring in 40 years
- copyright with no expiration date
- goodwill acquired 2 years ago in a business combination
Which of these assets is an intangible asset with a finite useful life?
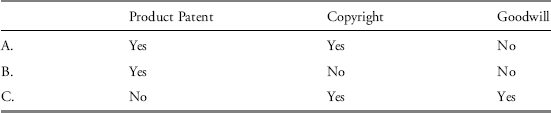
4. Intangible assets with finite useful lives mostly differ from intangible assets with infinite useful lives with respect to accounting treatment of:
A. revaluation.
B. impairment.
C. amortization.
5. A financial analyst is studying the income statement effect of two alternative depreciation methods for a recently acquired piece of equipment. She gathers the following information about the equipment’s expected production life and use:
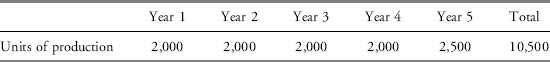
Compared with the units-of-production method of depreciation, if the company uses the straight-line method to depreciate the equipment, its net income in Year 1 will most likely be:
A. lower.
B. higher.
C. the same.
6. Juan Martinez, CFO of VIRMIN, S.A., is selecting the depreciation method to use for a new machine. The machine has an expected useful life of six years. Production is expected to be relatively low initially but to increase over time. The method chosen for tax reporting must be the same as the method used for financial reporting. If Martinez wants to minimize tax payments in the first year of the machine’s life, which of the following depreciation methods is Martinez most likely to use?
A. Straight-line method
B. Units-of-production method
C. Double-declining balance method
The following information relates to Questions 7 and 8.
Miguel Rodriguez of MARIO, S.A., an Uruguayan corporation, is computing the depreciation expense of a piece of manufacturing equipment for the fiscal year ended 31 December 2009. The equipment was acquired on 1 January 2009. Rodriguez gathers the following information (currency in Uruguayan pesos, UYP):
| Cost of the equipment | UYP 1,200,000 |
| Estimated residual value | UYP 200,000 |
| Expected useful life | 8 years |
| Total productive capacity | 800,000 units |
| Production in FY 2009 | 135,000 units |
| Expected production for the next 7 years | 95,000 units each year |
7. If MARIO uses the straight-line method, the amount of depreciation expense on MARIO’s income statement related to the manufacturing equipment is closest to:
A. 125,000.
B. 150,000.
C. 168,750.
8. If MARIO uses the units-of-production method, the amount of depreciation expense (in UYP) on MARIO’s income statement related to the manufacturing equipment is closest to:
A. 118,750.
B. 168,750.
C. 202,500.
9. Which of the following amortization methods is most likely to evenly distribute the cost of an intangible asset over its useful life?
A. Straight-line method
B. Units-of-production method
C. Double-declining balance method
10. Which of the following will cause a company to show a lower amount of amortization of intangible assets in the first year after acquisition?
A. A higher residual value
B. A higher amortization rate
C. A shorter useful life
11. An analyst in the finance department of BOOLDO, S.A., a French corporation, is computing the amortization of a customer list, an intangible asset, for the fiscal year ended 31 December 2009. She gathers the following information about the asset:
| Acquisition cost | €2,300,000 |
| Acquisition date | 1 January 2008 |
| Expected residual value at time of acquisition | €500,000 |
| The customer list is expected to result in extra sales for three years after acquisition. The present value of these expected extra sales exceeds the cost of the list. | |
If the analyst uses the straight-line method, the amount of accumulated amortization related to the customer list as of 31 December 2009 is closest to:
A. €600,000.
B. €1,200,000.
C. €1,533,333.
12. A financial analyst is analyzing the amortization of a product patent acquired by MAKETTI S.p.A., an Italian corporation. He gathers the following information about the patent:
| Acquisition cost | €5,800,000 |
| Acquisition date | 1 January 2009 |
| Patent expiration date | 31 December 2015 |
| Total plant capacity of patented product | 40,000 units per year |
| Production of patented product in fiscal year ended 31 December 2009 | 20,000 units |
| Expected production of patented product during life of the patent | 175,000 units |
If the analyst uses the units-of-production method, the amortization expense on the patent for fiscal year 2009 is closest to:
A. €414,286.
B. €662,857.
C. €828,571.
13. MARU S.A. de C.V., a Mexican corporation that follows IFRS, has elected to use the revaluation model for its property, plant, and equipment. One of MARU’s machines was purchased for 2,500,000 Mexican pesos (MXN) at the beginning of the fiscal year ended 31 March 2010. As of 31 March 2010, the machine has a fair value of MXN 3,000,000. Should MARU show a profit for the revaluation of the machine?
A. Yes.
B. No, because this revaluation is recorded directly in equity.
C. No, because value increases resulting from revaluation can never be recognized as a profit.
14. An analyst is studying the impairment of the manufacturing equipment of WLP Corp., a U.K.-based corporation that follows IFRS. He gathers the following information about the equipment:
| Fair value | £16,800,000 |
| Costs to sell | £800,000 |
| Value in use | £14,500,000 |
| Net carrying amount | £19,100,000 |
The amount of the impairment loss on WLP Corp.’s income statement related to its manufacturing equipment is closest to:
A. £2,300,000.
B. £3,100,000.
C. £4,600,000.
15. A financial analyst at BETTO, S.A. is analyzing the result of the sale of a vehicle for 85,000 Argentine pesos (ARP) on 31 December 2009. The analyst compiles the following information about the vehicle:
| Acquisition cost of the vehicle | ARP 100,000 |
| Acquisition date | 1 January 2007 |
| Estimated residual value at acquisition date | ARP 10,000 |
| Expected useful life | 9 years |
| Depreciation method | Straight-line |
The result of the sale of the vehicle is most likely:
A. a loss of ARP 15,000.
B. a gain of ARP 15,000.
C. a gain of ARP 18,333.
16. CROCO S.p.A. sells an intangible asset with a historical acquisition cost of €12 million and an accumulated depreciation of €2 million and reports a loss on the sale of €3.2 million. Which of the following amounts is most likely the sale price of the asset?
A. €6.8 million
B. €8.8 million
C. €13.2 million
17. According to IFRS, all of the following pieces of information about property, plant, and equipment must be disclosed in a company’s financial statements and footnotes except for:
A. useful lives.
B. acquisition dates.
C. amount of disposals.
18. According to IFRS, all of the following pieces of information about intangible assets must be disclosed in a company’s financial statements and footnotes except for:
A. fair value.
B. impairment loss.
C. amortization rate.
19. Which of the following characteristics is most likely to differentiate investment property from property, plant, and equipment?
A. It is tangible.
B. It earns rent.
C. It is long-lived.
20. If a company uses the fair value model to value investment property, changes in the fair value of the asset are least likely to affect:
A. net income.
B. net operating income.
C. other comprehensive income.
21. Investment property is most likely to:
A. earn rent.
B. be held for resale.
C. be used in the production of goods and services.
22. A company is most likely to:
A. use a fair value model for some investment property and a cost model for other investment property.
B. change from the fair value model when transactions on comparable properties become less frequent.
C. change from the fair value model when the company transfers investment property to property, plant, and equipment.
The following information relates to Questions 23 through 28.37
Melanie Hart, CFA, is a transportation analyst. Hart has been asked to write a research report on Altai Mountain Rail Company (AMRC). Like other companies in the railroad industry, AMRC’s operations are capital intensive, with significant investments in such long-lived tangible assets as property, plant, and equipment. In November of 2008, AMRC’s board of directors hired a new team to manage the company. In reviewing the company’s 2009 annual report, Hart is concerned about some of the accounting choices that the new management has made. These choices differ from those of the previous management and from common industry practice. Hart has highlighted the following statements from the company’s annual report:
| Statement 1: | “In 2009, AMRC spent significant amounts on track replacement and similar improvements. AMRC expensed rather than capitalized a significant proportion of these expenditures.” |
| Statement 2: | “AMRC uses the straight-line method of depreciation for both financial and tax reporting purposes to account for plant and equipment.” |
| Statement 3: | “In 2009, AMRC recognized an impairment loss of €50 million on a fleet of locomotives. The impairment loss was reported as ‘other income’ in the income statement and reduced the carrying amount of the assets on the balance sheet.” |
| Statement 4: | “AMRC acquires the use of many of its assets, including a large portion of its fleet of rail cars, under long-term lease contracts. In 2009, AMRC acquired the use of equipment with a fair value of €200 million under 20-year lease contracts. These leases were classified as operating leases. Prior to 2009, most of these lease contracts were classified as finance leases.” |
Exhibits A and B contain AMRC’s 2009 consolidated income statement and balance sheet. AMRC prepares its financial statements in accordance with International Financial Reporting Standards.
EXHIBIT A Consolidated Statement of Income
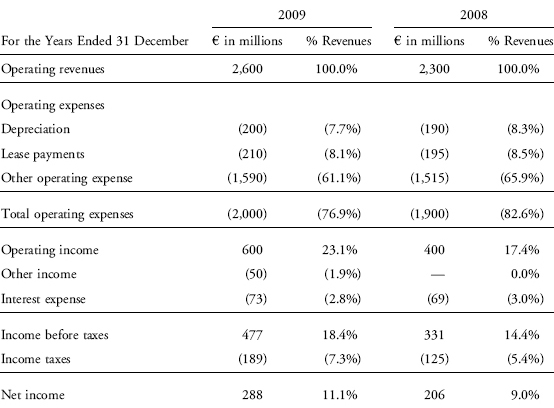
EXHIBIT B Consolidated Balance Sheet

23. With respect to Statement 1, which of the following is the most likely effect of management’s decision to expense rather than capitalize these expenditures?
A. 2009 net profit margin is higher than if the expenditures had been capitalized.
B. 2009 total asset turnover is lower than if the expenditures had been capitalized.
C. Future profit growth will be higher than if the expenditures had been capitalized.
24. With respect to Statement 2, what would be the most likely effect in 2010 if AMRC were to switch to an accelerated depreciation method for both financial and tax reporting?
A. Net profit margin would decrease.
B. Total asset turnover would increase.
C. Cash flow from operating activities would increase.
25. With respect to Statement 3, what is the most likely effect of the impairment loss?
A. Net income in years prior to 2009 was likely understated.
B. Net profit margins in years after 2009 will likely exceed the 2009 net profit margin.
C. Cash flow from operating activities in 2009 was likely lower due to the impairment loss.
26. Based on Exhibits A and B, the best estimate of the average remaining useful life of the company’s plant and equipment at the end of 2009 is:
A. 20.75 years.
B. 24.25 years.
C. 30.00 years.
27. With respect to Statement 4, if AMRC had used its old classification method for its leases instead of its new classification method, its 2009 total asset turnover ratio would most likely be:
A. lower.
B. higher.
C. the same.
28. With respect to Statement 4 and Exhibit A, if AMRC had used its old classification method for its leases instead of its new classification method, the most likely effect on its 2009 ratios would be a:
A. higher net profit margin.
B. higher fixed asset turnover.
C. higher total liabilities-to-total assets ratio.
The following information relates to Questions 29 through 35.38
Brian Jordan is interviewing for a junior equity analyst position at Orion Investment Advisors. As part of the interview process, Mary Benn, Orion’s Director of Research, provides Jordan with information about two hypothetical companies, Alpha and Beta, and asks him to comment on the information on their financial statements and ratios. Both companies prepare their financial statements in accordance with International Financial Reporting Standards (IFRS) and are identical in all respects except for their accounting choices.
Jordan is told that at the beginning of the current fiscal year, both companies purchased a major new computer system and began building new manufacturing plants for their own use. Alpha capitalized and Beta expensed the cost of the computer system; Alpha capitalized and Beta expensed the interest costs associated with the construction of the manufacturing plants. In mid-year, both companies leased new office headquarters. Alpha classified the lease as an operating lease, and Beta classified it as a finance lease.
Benn asks Jordan, “What was the impact of these decisions on each company’s current fiscal year financial statements and ratios?”
Jordan responds, “Alpha’s decision to capitalize the cost of its new computer system instead of expensing it results in lower net income, lower total assets, and higher cash flow from operating activities in the current fiscal year. Alpha’s decision to capitalize its interest costs instead of expensing them results in a lower fixed asset turnover ratio and a higher interest coverage ratio. Alpha’s decision to classify its lease as an operating lease instead of a finance lease results in higher net income, higher cash flow from operating activities, and stronger solvency and activity ratios compared to Beta.”
Jordan is told that Alpha uses the straight-line depreciation method and Beta uses an accelerated depreciation method; both companies estimate the same useful lives for long-lived assets. Many companies in their industry use the units-of-production method.
Benn asks Jordan, “What are the financial statement implications of each depreciation method, and how do you determine a company’s need to reinvest in its productive capacity?”
Jordan replies, “All other things being equal, the straight-line depreciation method results in the least variability of net profit margin over time, while an accelerated depreciation method results in a declining trend in net profit margin over time. The units-of-production can result in a net profit margin trend that is quite variable. I use a three-step approach to estimate a company’s need to reinvest in its productive capacity. First, I estimate the average age of the assets by dividing net property, plant, and equipment by annual depreciation expense. Second, I estimate the average remaining useful life of the assets by dividing accumulated depreciation by depreciation expense. Third, I add the estimates of the average remaining useful life and the average age of the assets in order to determine the total useful life.”
Jordan is told that at the end of the current fiscal year, Alpha revalued a manufacturing plant; this increased its reported carrying amount by 15 percent. There was no previous downward revaluation of the plant. Beta recorded an impairment loss on a manufacturing plant; this reduced its carrying by 10 percent.
Benn asks Jordan “What was the impact of these decisions on each company’s current fiscal year financial ratios?”
Jordan responds, “Beta’s impairment loss increases its debt to total assets and fixed asset turnover ratios, and lowers its cash flow from operating activities. Alpha’s revaluation increases its debt to capital and return on assets ratios, and reduces its return on equity.”
At the end of the interview, Benn thanks Jordan for his time and states that a hiring decision will be made shortly.
29. Jordan’s response about the financial statement impact of Alpha’s decision to capitalize the cost of its new computer system is most likely correct with respect to:
A. lower net income.
B. lower total assets.
C. higher cash flow from operating activities.
30. Jordan’s response about the ratio impact of Alpha’s decision to capitalize interest costs is most likely correct with respect to the:
A. interest coverage ratio.
B. fixed asset turnover ratio.
C. interest coverage and fixed asset turnover ratios.
31. Jordan’s response about the impact of Alpha’s decision to classify its lease as an operating lease instead of finance lease is most likely incorrect with respect to:
A. net income.
B. solvency and activity ratios.
C. cash flow from operating activities.
32. Jordan’s response about the impact of the different depreciation methods on net profit margin is most likely incorrect with respect to:
A. accelerated depreciation.
B. straight-line depreciation.
C. units-of-production depreciation.
33. Jordan’s response about his approach to estimating a company’s need to reinvest in its productive capacity is most likely correct regarding:
A. estimating the average age of the asset base.
B. estimating the total useful life of the asset base.
C. estimating the average remaining useful life of the asset base.
34. Jordan’s response about the effect of Beta’s impairment loss is most likely incorrect with respect to the impact on its:
A. debt to total assets.
B. fixed asset turnover.
C. cash flow from operating activities.
35. Jordan’s response about the effect of Alpha’s revaluation is most likely correct with respect to the impact on its:
A. return on equity.
B. return on assets.
C. debt to capital ratio.
1In some instances, industry practice is to include as current assets (inventory) some assets that will be held longer than one year (e.g., leaf tobacco, which is cured and aged over a period longer than one year, and whiskey, which is barrel aged for a period longer than one year).
2Fair value is defined in International Financial Reporting Standards (IFRS) and under U.S. generally accepted accounting principles (U.S. GAAP) in the Financial Accounting Standards Board (FASB) Accounting Standards Codification (ASC) as “the price that would be received to sell an asset or paid to transfer a liability in an orderly transaction between market participants at the measurement date” [IFRS 13 and FASB ASC Topic 820].
3IAS 16 Property, Plant and Equipment, paragraphs 24–26 [Measurement of Cost]; IAS 38 Intangible Assets, paragraphs 45–47 [Exchange of Assets]; and FASB ASC Section 845-10-30 [Nonmonetary Transactions − Overall − Initial Measurement].
4The IFRS definition of an intangible asset as an “identifiable nonmonetary asset without physical substance” applies to intangible assets not specifically dealt with in standards other than IAS 38. The definition of intangible assets under U.S. GAAP—“assets (other than financial assets) that lack physical substance”—includes goodwill in the definition of an intangible asset.
5IAS 38 Intangible Assets.
6IAS 38 Intangible Assets, paragraph 8 [Definitions].
7IAS 38 Intangible Assets, paragraph 8 [Definitions].
8FASB ASC Section 350-40-25 [Intangibles—Goodwill and Other − Internal-Use Software − Recognition] and FASB ASC Section 985-20-25 [Software − Costs of Software to be Sold, Leased, or Marketed − Recognition] specify U.S. GAAP accounting for software development costs for software for internal use and for software to be sold, respectively.
9Both IFRS and U.S. GAAP require the use of the acquisition method in accounting for business combinations (IFRS 3 and FASB ASC Section 805).
10As previously described, the definitional criteria are identifiability, control by the company, and expected future benefits. The recognition criteria are probable flows of the expected economic benefits to the company and measurability.
11IAS 23 [Borrowing Costs] and FASB ASC Subtopic 835-20 [Interest − Capitalization of Interest] specify respectively IFRS and U.S. GAAP for capitalization of interest costs. Although the standards are not completely converged, the standards are in general agreement.
12Depletion is the term applied to a similar concept for natural resources; costs associated with those resources are allocated to a period on the basis of the usage or extraction of those resources.
13The residual value is the estimated amount that an entity will obtain from disposal of the asset at the end of its useful life.
14IAS 16 Property, Plant and Equipment, paragraphs 43–47 [Depreciation].
15According to the Ernst & Young Academic Resource Center.
16IAS 38 Intangible Assets, paragraph 88.
17On 15 November 2007, the SEC approved rule amendments under which financial statements from foreign private issuers in the United States will be accepted without reconciliation to U.S. GAAP if the financial statements are prepared in accordance with IFRS as issued by the International Accounting Standards Board. The new rule is effective for the 2007 fiscal year. As a result, companies such as KPN no longer need to provide reconciliations to U.S. GAAP.
18FASB ASC Section 360-10-35 [Property, Plant, and Equipment − Overall − Subsequent Measurement].
19In a spin-off, shareholders of the parent company receive a proportional number of shares in a new, separate entity.
20IAS 16 Property, Plant and Equipment, paragraphs 73–78 [Disclosure].
21FASB ASC Section 360-10-50 [Property, Plant, and Equipment − Overall − Disclosure].
22IAS 38 Intangible Assets, paragraphs 118–128 [Disclosure].
23FASB ASC Section 350-30-50 [Intangibles − General − Disclosure].
24IAS 36 Impairment of Assets, paragraphs 126–131 [Disclosure].
25FASB ASC Section 360-10-50 [Property, Plant, and Equipment − Overall − Disclosure] and FASB ASC Section 350-30-50 [Intangibles − General − Disclosure].
26IAS 1 paragraph 102.
27IAS 40 Investment Property prescribes the accounting treatment for investment property.
28Fair value of investment property is defined as the price at which the property could be exchanged between knowledgeable, willing parties in an arm’s length transaction (IAS 40 Investment Property, paragraph 36).
29Finance lease is IFRS terminology and capital lease is U.S. GAAP terminology. IAS 17 [Leases] and FASB ASC Topic 840 [Leases].
30International accounting for leases is prescribed under IAS 17 [Leases].
31The four criteria are: (1) ownership of the leased asset transfers to lessee at end of lease, (2) the lease contains an option for the lessee to purchase the leased asset cheaply (bargain purchase option), (3) the lease term is 75 percent or more of the useful life of the leased asset, and (4) the present value of lease payments is 90 percent or more of the fair value of the leased asset (ASC 840-10-25-1). An Exposure Draft, Leasing, issued jointly by the FASB and IASB in August 2010 would eliminate these criteria from U.S. GAAP.
32Interest expense may be classified as a financing cash flow or an operating cash flow under IFRS (IAS 7 paragraph 33) but is classified as an operating cash flow under U.S. GAAP (FASB ASC paragraph 230-10-45-17).
33The computations included throughout the example were made using an Excel worksheet; small discrepancies in the calculations are due to rounding.
34Example 11 assumes the company uses the straight-line depreciation method, which is common under IFRS and U.S. GAAP. If the company estimated depreciation expense based on the “economic” depreciation of the leased asset, there would be no difference in reported income under a finance lease and operating lease.
35The computations included throughout the example were made using an Excel worksheet; small apparent discrepancies in the calculations are due to the rounding.
36IFRS does not make the distinction between a sales-type lease and a direct financing lease. However, a similar treatment to “sales-type” is allowed for finance leases originated by “manufacturer or dealer lessors,” within the general provisions for finance leases.
37Item set developed by Christopher Anderson, CFA (Lawrence, Kansas, U.S.A.)
38Item set developed by Philip Fanara Jr., CFA (Hyattsville, Maryland, U.S.A.)