CHAPTER 12
NONCURRENT (LONG-TERM) LIABILITIES
After completing this chapter, you will be able to do the following:
- Determine the initial recognition and measurement and subsequent measurement of bonds.
- Discuss the effective interest method and calculate interest expense, amortization of bond discounts/premiums, and interest payments.
- Discuss the derecognition of debt.
- Explain the role of debt covenants in protecting creditors.
- Discuss the financial statement presentation of and disclosures relating to debt.
- Discuss the motivations for leasing assets instead of purchasing them.
- Distinguish between a finance lease and an operating lease from the perspectives of the lessor and the lessee.
- Determine the initial recognition and measurement and subsequent measurement of finance leases.
- Compare and contrast the disclosures relating to finance and operating leases.
- Describe defined contribution and defined benefit pension plans.
- Compare and contrast the presentation and disclosure of defined contribution and defined benefit pension plans.
- Calculate and interpret leverage and coverage ratios.
A noncurrent (long-term) liability broadly represents a probable sacrifice of economic benefits in periods generally greater than one year in the future. Common types of noncurrent liabilities reported in a company’s financial statements include long-term debt (e.g., bonds payable, long-term notes payable), finance leases, pension liabilities, and deferred tax liabilities. This chapter focuses on bonds payable and leases. Pension liabilities are also introduced.
This chapter is organized as follows. Section 2 describes and illustrates the accounting for long-term bonds, including the issuance of bonds, the recording of interest expense and interest payments, the amortization of any discount or premium, the derecognition of debt, and the disclosure of information about debt financings. In discussing the financial statement effects and analyses of these issues, we focus on solvency and coverage ratios. Section 3 discusses leases, including benefits of leasing and accounting for leases by both lessees and lessors. Section 4 provides an introduction to pension accounting and the resulting noncurrent liabilities. Section 5 discusses the use of leverage and coverage ratios in evaluating solvency. A summary of the chapter is followed by practice problems in the CFA Institute format.
This section discusses accounting for bonds payable—a common form of long-term debt. In some contexts (e.g., some government debt obligations), the word “bond” is used only for a debt security with a maturity of 10 years or longer; “note” refers to a debt security with a maturity between 2 and 10 years; and “bill” refers to a debt security with a maturity of less than 2 years. In this chapter, we use the terms bond and note interchangeably because the accounting treatments of bonds payable and long-term notes payable are similar. In the following sections, we discuss bond issuance (initial recognition and measurement); bond amortization, interest expense, and interest payments; market rates and fair value (subsequent measurement); repayment of bonds, including retirements and redemptions (derecognition); and other issues concerning disclosures related to debt. We also discuss debt covenants.
2.1. Accounting for Bond Issuance
Bonds are contractual promises made by a company (or other borrowing entity) to pay cash in the future to its lenders (i.e., bondholders) in exchange for receiving cash in the present. The terms of a bond contract are contained in a document called an indenture. The cash or sales proceeds received by a company when it issues bonds is based on the value (price) of the bonds at the time of issue; the price at the time of issue is determined as the present value of the future cash payments promised by the company in the bond agreement.
Ordinarily, bonds contain promises of two types of future cash payments: (1) the face value of the bonds, and (2) periodic interest payments. The face value of the bonds is the amount of cash payable by the company to the bondholders when the bonds mature. The face value is also referred to as the principal, par value, stated value, or maturity value. The date of maturity of the bonds (the date on which the face value is paid to bondholders) is stated in the bond contract and typically is a number of years in the future. Periodic interest payments are made based on the interest rate promised in the bond contract applied to the bonds’ face value. The interest rate promised in the contract, which is the rate used to calculate the periodic interest payments, is referred to as the coupon rate, nominal rate, or stated rate. Similarly, the periodic interest payment is referred to as the coupon payment or simply the coupon. For fixed rate bonds (the primary focus of our discussion here), the coupon rate remains unchanged throughout the life of the bonds. The frequency with which interest payments are made is also stated in the bond contract. For example, bonds paying interest semiannually will make two interest payments per year.1
The future cash payments are discounted to the present to arrive at the market value of the bonds. The market rate of interest is the rate demanded by purchasers of the bonds given the risks associated with future cash payment obligations of the particular bond issue. The market rate of interest at the time of issue often differs from the coupon rate because of interest rate fluctuations that occur between the time the issuer establishes the coupon rate and the day the bonds are actually available to investors. If the market rate of interest when the bonds are issued equals the coupon rate, the market value (price) of the bonds will equal the face value of the bonds. Thus, ignoring issuance costs, the issuing company will receive sales proceeds (cash) equal to the face value of the bonds. When a bond is issued at a price equal to its face value, the bond is said to have been issued at par.
If the coupon rate when the bonds are issued is higher than the market rate, the market value of the bonds—and thus the amount of cash the company receives—will be higher than the face value of the bonds. In other words, the bonds will sell at a premium to face value because they are offering an attractive coupon rate compared to current market rates. If the coupon rate is lower than the market rate, the market value and thus the sale proceeds from the bonds will be less than the face value of the bonds; the bond will sell at a discount to face value. The market rate at the time of issuance is the effective interest rate or borrowing rate that the company incurs on the debt. The effective interest rate is the discount rate that equates the present value of the two types of promised future cash payments to their selling price. For the issuing company, interest expense reported for the bonds in the financial statements is based on the effective interest rate.
On the issuing company’s statement of cash flows, the cash received (sales proceeds) from issuing bonds is reported as a financing cash inflow. On the issuing company’s balance sheet at the time of issue, bonds payable normally are measured and reported at the sales proceeds. In other words, the bonds payable are initially reported at the face value of the bonds minus any discount, or plus any premium.
Using a three-step approach, the following two examples illustrate accounting for bonds issued at face value and then accounting for bonds issued at a discount to face value. Accounting for bonds issued at a premium involves steps similar to the steps followed in the examples following. For simplicity, these examples assume a flat interest rate yield curve (i.e., that the market rate of interest is the same for each period). More-precise bond valuations use the interest rate applicable to each time period in which a payment of interest or principal occurs.
EXAMPLE 12-1 Bonds Issued at Face Value
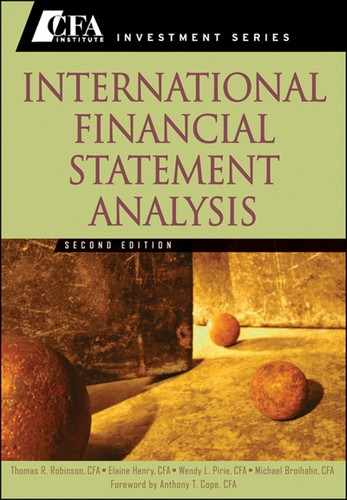
Debond Corp. (a hypothetical company) issues £1,000,000 worth of five-year bonds, dated 1 January 2010, when the market interest rate on bonds of comparable risk and terms is 5 percent per annum. The bonds pay 5 percent interest annually on 31 December. What are the sales proceeds of the bonds when issued, and how is the issuance reflected in the financial statements?
Solution: Calculating the value of the bonds at issuance and thus the sales proceeds involves three steps: (1) identifying key features of the bonds and the market interest rate, (2) determining future cash outflows, and (3) discounting the future cash flows to the present.
First, identify key features of the bonds and the market interest rate necessary to determine sales proceeds:
| Face value (principal): | £1,000,000 | |
| Time to maturity: | 5 years | |
| Coupon rate: | 5% | |
| Market rate at issuance: | 5% | |
| Frequency of interest payments: | annual | |
| Interest payment: | £50,000 | Each annual interest payment is the face value times the coupon rate (£1,000,000 × 5%). If interest is paid other than annually, adjust the interest rate to match the interest payment period (e.g., divide the annual coupon rate by two for semiannual interest payments). |
Second, determine future cash outflows. Debond will pay bondholders £1,000,000 when the bonds mature in five years. On 31 December of each year until the bonds mature, Debond will make an interest payment of £50,000.
Third, sum the present value of the future payments of interest and principal to obtain the value of the bonds and thus the sales proceeds from issuing the bonds. In this example, the sum is £1,000,000 = (£216,474+£783,526).
The sales proceeds of the bonds when issued are £1,000,000. There is no discount or premium because these bonds are issued at face value. The issuance is reflected on the balance sheet as an increase of cash and an increase in a long-term liability, bonds payable, of £1,000,000. The issuance is reflected in the statement of cash flows as a financing cash inflow of £1,000,000.
The price of bonds is often expressed as a percentage of face value. For example, the price of bonds issued at par, as in Example 12-1, is 100 (i.e., 100 percent of face value). In Example 12-2, in which bonds are issued at a discount, the price is 95.79 (i.e., 95.79 percent of face value).
EXAMPLE 12-2 Bonds Issued at a Discount
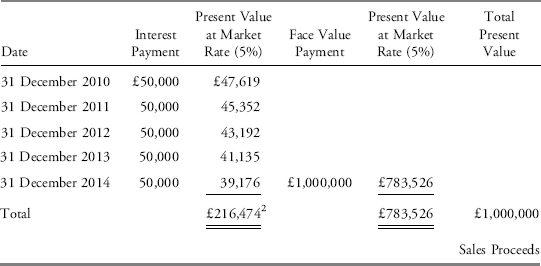
Debond Corp. issues £1,000,000 worth of five-year bonds, dated 1 January 2010, when the market interest rate on bonds of comparable risk and terms is 6 percent. The bonds pay 5 percent interest annually on 31 December. What are the sales proceeds of the bonds when issued, and how is the issuance reflected in the financial statements?
Solution: The key features of the bonds and the market interest rate are:
| Face value (principal): | £1,000,000 | |
| Time to maturity: | 5 years | |
| Coupon rate: | 5% | |
| Market rate at issuance: | 6% | |
| Frequency of interest payments: | annual | |
| Interest payment: | £50,000 | Each annual interest payment is the face value times the coupon rate (£1,000,000 × 5%). |
The future cash outflows (interest payments and face value payment), the present value of the future cash outflows, and the total present value are:
The sales proceeds of the bonds when issued are £957,876. The bonds sell at a discount of £42,124 = (£1,000,000 − £957,876) because the market rate when the bonds are issued (6 percent) is greater than the bonds’ coupon rate (5 percent). The issuance is reflected on the balance sheet as an increase of cash and an increase in a long-term liability, bonds payable, of £957,876. The bonds payable is composed of the face value of £1,000,000 minus a discount of £42,124. The issuance is reflected in the statement of cash flows as a financing cash inflow of £957,876.
In Example 12-2, the bonds were issued at a discount to face value because the bonds’ coupon rate of 5 percent was less than the market rate. Bonds are issued at a premium to face value when the bonds’ coupon rate exceeds the market rate.
Bonds issued with a coupon rate of zero (zero-coupon bonds) are always issued at a discount to face value. The value of zero-coupon bonds is based on the present value of the principal payment only because there are no periodic interest payments.
Such issuance costs as printing, legal fees, commissions, and other types of charges are costs incurred when bonds are issued. Under International Financial Reporting Standards (IFRS), all debt issuance costs are included in the measurement of the liability, bonds payable. Under U.S. generally accepted accounting principles (U.S. GAAP), companies generally show these debt issuance costs as an asset (a deferred charge), which is amortized on a straight-line basis to the relevant expense (e.g., legal fees) over the life of the bonds.3 Under IFRS and U.S. GAAP, cash outflows related to bond issuance costs are included in the financing section of the statement of cash flows, usually netted against bond proceeds.
2.2. Accounting for Bond Amortization, Interest Expense, and Interest Payments
In this section, we discuss accounting and reporting for bonds after they are issued. Most companies maintain the historical cost (sales proceeds) of the bonds after issuance, and they amortize any discount or premium over the life of the bond. The amount reported on the balance sheet for bonds is thus the historical cost plus or minus the cumulative amortization, which is referred to as amortized cost. Companies also have the option to report the bonds at their current fair values.
The rationale for reporting the bonds at amortized historical cost is the company’s intention to retain the debt until it matures. Therefore, changes in the underlying economic value of the debt are not relevant from the issuing company’s perspective. From an investor’s perspective, however, analysis of a company’s underlying economic liabilities and solvency is more difficult when debt is reported at amortized historical cost. The rest of this section illustrates accounting and reporting of bonds at amortized historical cost. Section 2.3 discusses the alternative of reporting bonds at fair value.
Companies initially report bonds as a liability on their balance sheet at the amount of the sales proceeds net of issuance costs under IFRS and at the amount of the sales proceeds under U.S. GAAP, ignoring any bond issuance costs. The amount at which bonds are reported on the company’s balance sheet is referred to as the carrying amount, carrying value, book value, or net book value. If the bonds are issued at par, the initial carrying amount will be identical to the face value, and usually the carrying amount will not change over the life of the bonds.4 For bonds issued at face value, the amount of periodic interest expense will be the same as the amount of periodic interest payment to bondholders.
If, however, the market rate differs from the bonds’ coupon rate at issuance such that the bonds are issued at a premium or discount, the premium or discount is amortized systematically over the life of the bonds as a component of interest expense. For bonds issued at a premium to face value, the carrying amount of the bonds is initially greater than the face value. As the premium is amortized, the carrying amount (amortized cost) of the bonds will decrease to the face value. The reported interest expense will be less than the coupon payment. For bonds issued at a discount to face value, the carrying amount of the bonds is initially less than the face value. As the discount is amortized, the carrying amount (amortized cost) of the bonds will increase to the face value. The reported interest expense will be higher than the coupon payment.
The accounting treatment for bonds issued at a discount reflects the fact that the company essentially paid some of its borrowing costs at issuance by selling its bonds at a discount. Rather than there being an actual cash transfer in the future, this “payment” was made in the form of accepting less than the face value for the bonds at the date of issuance. The remaining borrowing cost occurs as a cash interest payment to investors each period. The total interest expense reflects both components of the borrowing cost: the periodic interest payments plus the amortization of the discount. The accounting treatment for bonds issued at a premium reflects the fact that the company essentially received a reduction on its borrowing costs at issuance by selling its bonds at a premium. Rather than there being an actual reduced cash transfer in the future, this “reduction” was made in the form of receiving more than face value for the bonds at the date of issuance. The total interest expense reflects both components of the borrowing cost: the periodic interest payments less the amortization of the premium. When the bonds mature, the carrying amount will be equal to the face value regardless of whether the bonds were issued at face value, a discount, or a premium.
Two methods for amortizing the premium or discount of bonds that were issued at a price other than par are the effective interest rate method and the straight-line method. The effective interest rate method is required under IFRS and preferred under U.S. GAAP because it better reflects the economic substance of the transaction. The effective interest rate method applies the market rate in effect when the bonds were issued (historical market rate or effective interest rate) to the current amortized cost (carrying amount) of the bonds to obtain interest expense for the period. The difference between the interest expense (based on the effective interest rate and amortized cost) and the interest payment (based on the coupon rate and face value) is the amortization of the discount or premium. The straight-line method of amortization evenly amortizes the premium or discount over the life of the bond, similar to straight-line depreciation on long-lived assets. Under either method, as the bond approaches maturity, the amortized cost approaches face value.
Example 12-3 illustrates both methods of amortization for bonds issued at a discount. Example 12-4 shows amortization for bonds issued at a premium.
EXAMPLE 12-3 Amortizing a Bond Discount
Debond Corp. issues £1,000,000 face value of five-year bonds, dated 1 January 2010, when the market interest rate is 6 percent. The sales proceeds are £957,876. The bonds pay 5 percent interest annually on 31 December.
1. What is the interest payment on the bonds each year?
2. What amount of interest expense on the bonds would be reported in 2010 and 2011 using the effective interest rate method?
3. Determine the reported value of the bonds (i.e., the carrying amount) at 31 December 2010 and 2011, assuming the effective interest rate method is used to amortize the discount.
4. What amount of interest expense on the bonds would be reported under the straight-line method of amortizing the discount?
Solution to 1: The interest payment equals £50,000 annually (£1,000,000 × 5%).
Solution to 2: The sales proceeds of £957,876 are less than the face value of £1,000,000; the bonds were issued at a discount of £42,124. The bonds are initially reported as a long-term liability, bonds payable, of £957,876, which comprises the face value of £1,000,000 minus a discount of £42,124. The discount is amortized over time, ultimately, increasing the carrying amount (amortized cost) to face value.
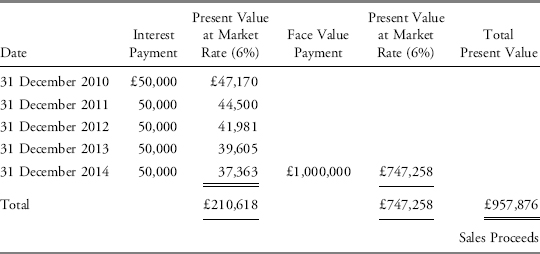
Under the effective interest rate method, interest expense on the bonds is calculated as the bonds’ carrying amount times the market rate in effect when the bonds are issued (effective interest rate). For 2010, interest expense is £57,473 = (£957,876 × 6%). The amount of the discount amortized in 2010 is the difference between the interest expense of £57,473 and the interest payment of £50,000 (i.e., £7,473). The bonds’ carrying amount increases by the discount amortization; at 31 December 2010, the bonds’ carrying amount is £965,349 (beginning balance of £957,876 plus £7,473 discount amortization). At this point, the carrying amount reflects a remaining unamortized discount of £34,651 (£42,124 discount at issuance minus £7,473 amortized).
For 2011, interest expense is £57,921 = (£965,349 × 6%), the carrying amount of the bonds on 1 January 2011 times the effective interest rate. The amount of the discount amortized in 2011 is the difference between the interest expense of £57,921 and the interest payment of £50,000 (i.e., £7,921). At 31 December 2011, the bonds’ carrying amount is £973,270 (beginning balance of £965,349 plus £7,921 discount amortization).
The following table illustrates interest expense, discount amortization, and carrying amount (amortized cost) over the life of the bonds.
Solution to 3: The carrying amounts of the bonds at 31 December 2010 and 2011 are £965,349 and £973,270, respectively. Observe that the carrying amount of the bonds issued at a discount increases over the life of the bonds. At maturity, 31 December 2014, the carrying amount of the bonds equals the face value of the bonds. The carrying amount of the bonds will be reduced to zero when the principal payment is made.
Solution to 4: Under the straight-line method, the discount (or premium) is evenly amortized over the life of the bonds. In this example, the £42,124 discount would be amortized by £8,424.80 (£42,124 divided by 5 years) each year under the straight-line method. So, the annual interest expense under the straight-line method would be £58,424.80 (£50,000 plus £8,424.80).
The accounting and reporting for zero-coupon bonds is similar to the earlier example except that no interest payments are made; thus, the amount of interest expense each year is the same as the amount of the discount amortization for the year.
EXAMPLE 12-4 Amortizing a Bond Premium
Prembond Corp. issues £1,000,000 face value of five-year bonds, dated 1 January 2010, when the market interest rate is 4 percent. The sales proceeds are £1,044,518. The bonds pay 5 percent interest annually on 31 December.
1. What is the interest payment on the bonds each year?
2. What amount of interest expense on the bonds would be reported in 2010 and 2011 using the effective interest rate method?
3. Determine the reported value of the bonds (i.e., the carrying amount) at 31 December 2010 and 2011, assuming the effective interest rate method is used to amortize the premium.
4. What amount of interest expense on the bonds would be reported under the straight-line method of amortizing the premium?
Solution to 1: The interest payment equals £50,000 annually (£1,000,000 × 5%).
Solution to 2: The sales proceeds of £1,044,518 are more than the face value of £1,000,000; the bonds were issued at a premium of £44,518. The bonds are initially reported as a long-term liability, bonds payable, of £1,044,518, which comprises the face value of £1,000,000 plus a premium of £44,518. The premium is amortized over time, ultimately decreasing the carrying amount (amortized cost) to face value.
Under the effective interest rate method, interest expense on the bonds is calculated as the bonds’ carrying amount times the market rate in effect when the bonds are issued (effective interest rate). For 2010, interest expense is £41,781 = (£1,044,518 × 4%). The amount of the premium amortized in 2010 is the difference between the interest expense of £41,781 and the interest payment of £50,000 (i.e., £8,219). The bonds’ carrying amount decreases by the premium amortization; at 31 December 2010, the bonds’ carrying amount is £1,036,299 (beginning balance of £1,044,518 less £8,219 premium amortization). At this point, the carrying amount reflects a remaining unamortized premium of £36,299 (£44,158 premium at issuance minus £8,219 amortized).
For 2011, interest expense is £41,452 = (£1,036,299 × 4%). The amount of the premium amortized in 2011 is the difference between the interest expense of £41,452 and the interest payment of £50,000 (i.e., £8,548). At 31 December 2011, the bonds’ carrying amount is £1,027,751 (beginning balance of £1,036,299 less £8,548 premium amortization).
The following table illustrates interest expense, premium amortization, and carrying amount (amortized cost) over the life of the bonds.
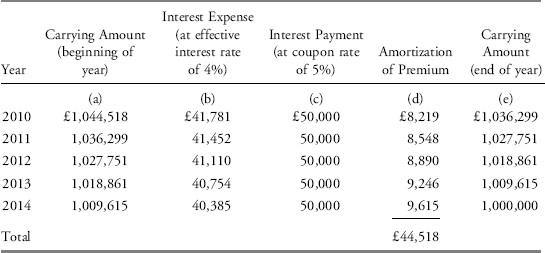
Solution to 3: The carrying amounts of the bonds at 31 December 2010 and 2011 are £1,036,299 and £1,027,751, respectively. Observe that the carrying amount of the bonds issued at a premium decreases over the life of the bonds. At maturity, 31 December 2014, the carrying amount of the bonds equals the face value of the bonds. The carrying amount of the bonds will be reduced to zero when the principal payment is made.
Solution to 4: Under the straight-line method, the premium is evenly amortized over the life of the bonds. In this example, the £44,518 premium would be amortized by £8,903.64 (£44,518 divided by 5 years) each year under the straight-line method. So, the annual interest expense under the straight-line method would be £41,096.36 (£50,000 less £8,903.64).
The reporting of interest payments on the statement of cash flows can differ under IFRS and U.S. GAAP. Under IFRS, interest payments on bonds can be included as an outflow in either the operating section or the financing section of the statement of cash flows. U.S. GAAP requires interest payments on bonds to be included as an operating cash outflow. (Some financial statement users consider the placement of interest payments in the operating section to be inconsistent with the placement of bond issue proceeds in the financing section of the statement of cash flows.) Typically, cash interest paid is not shown directly on the statement of cash flows, but companies are required to disclose interest paid separately.
Amortization of a discount (premium) is a noncash item and thus, apart from its effect on taxable income, has no affect on cash flow. In the section of the statement of cash flows that reconciles net income to operating cash flow, amortization of a discount (premium) is added back to (subtracted from) net income.
2.3. Current Market Rates and Fair Value Reporting Option
Reporting bonds at amortized historical costs (historical cost plus or minus the cumulative amortization) reflects the market rate at the time the bonds were issued (i.e., historical market rate or effective interest rate). As market interest rates change, the bonds’ carrying amount diverges from the bonds’ fair market value. When market interest rates decline, the fair value of a bond with a fixed coupon rate increases. As a result, a company’s economic liabilities may be higher than its reported debt based on amortized historical cost. Conversely, when market interest rates increase, the fair value of a bond with a fixed coupon rate decreases and the company’s economic liability may be lower than its reported debt. Using financial statement amounts based on amortized cost may underestimate (or overestimate) a company’s debt-to-total-capital ratio and similar leverage ratios.
Companies recently have been given the option to report financial liabilities at fair values. Financial liabilities reported at fair value are designated as financial liabilities at fair value through profit or loss. Even if a company does not opt to report financial liabilities at fair value, the availability of fair value information in the financial statements has increased. IFRS and U.S. GAAP require fair value disclosures in the financial statements unless the carrying amount approximates fair value or the fair value cannot be reliably measured.5
A company selecting the fair value option for a liability with a fixed coupon rate will report gains (losses) when market interest rates increase (decrease). When market interest rates increase or other factors cause the fair value of a company’s bonds to decline, the company reports a decrease in the fair value of its liability and a corresponding gain. When interest rates decrease or other factors cause the fair value of a company’s bonds to increase, the company reports an increase in the fair value of its liability and a corresponding loss. The gains or losses resulting from changes in fair values are recognized in profit or loss.
Few companies have selected the option to report financial liabilities at fair value. Those that have are primarily companies in the financial sector. Reporting standards for financial investments and derivatives already required these companies to report a significant portion of their assets at fair values. Measuring financial liabilities at other than fair value, when financial assets are measured at fair value, results in earnings volatility. This volatility is the result of using different bases of measurement for financial assets and financial liabilities. Goldman Sachs (NYSE: GS) elected to account for some financial liabilities at fair value under the fair value option. In its fiscal year 2008 10-K filing (page 74), Goldman explains this choice:
The primary reasons for electing the fair value option are to reflect economic events in earnings on a timely basis, to mitigate volatility in earnings from using different measurement attributes and to address simplification and cost-benefit considerations.
Most companies, as required under IFRS and U.S. GAAP, disclose the fair values of financial liabilities. The primary exception to the disclosure occurs when fair value cannot be reliably measured. Example 12-5 illustrates Sony’s fair value disclosures, including the fair values of long-term debt.
EXAMPLE 12-5 Fair Value Disclosures of Debt and Financial Instruments
The following are excerpts from Notes 2 and 13 of Sony Corporation’s (NYSE: SNE) 20-F filing for the fiscal year ended 31 March 2009. These discuss the option for reporting fair values in the balance sheet and illustrate financial statement disclosures of fair values.
Excerpt from NOTE 2: SUMMARY OF SIGNIFICANT ACCOUNTING POLICIES
. . .“The Fair Value Option for Financial Assets and Financial Liabilities.”. . .permits companies to choose to measure, on an instrument-by-instrument basis, various financial instruments and certain other items at fair value that are not currently required to be measured at fair value. The fair value measurement election is irrevocable and subsequent changes in fair value must be recorded in earnings.. . . Sony did not elect the fair value option for any assets or liabilities that were not previously carried at fair value.
Excerpt from NOTE 13: FAIR VALUE MEASUREMENTS
The estimated fair values of Sony’s financial instruments are summarized as follows. The following summary excludes cash and cash equivalents, call loans, time deposits, notes and accounts receivable, trade, call money, short-term borrowings, notes and accounts payable, trade and deposits from customers in the banking business because the carrying values of these financial instruments approximated their fair values due to their short-term nature.
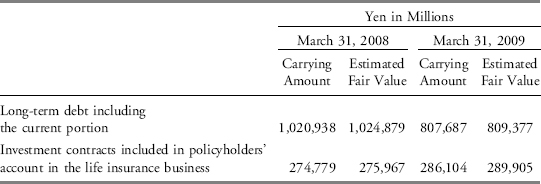
The fair values of long-term debt including the current portion and investment contracts included in policyholders’ account in the life insurance business were estimated based on either the market value or the discounted future cash flows using Sony’s current incremental borrowing rates for similar liabilities.
Use the excerpts from the notes to Sony’s financial statements to address the following questions:
1. Does Sony report the fair values of its long-term debt on the balance sheet?
2. How does Sony measure the long-term debt reported on the balance sheet?
3. As of 31 March 2008 and 31 March 2009, what is the percent difference in the carrying amount and fair value of Sony’s long-term debt?
Solution to 1: Sony does not report the fair values of its long-term debt on the balance sheet; Sony discloses that it did not elect the fair value option for any assets or liabilities that were not previously carried at fair value in Note 2. In Note 13, we also observe that Sony discloses the estimated fair value of long-term debt separately from its carrying amount.
Solution to 2: Notes 2 and 13 indicate that Sony did not elect the fair value option. Therefore, the carrying amount of its debt must be its amortized historical cost.
Solution to 3: In each year, the fair value of Sony’s long-term debt is less than one half of one percent greater than its carrying amount: 0.4% [= (1,024,879/1,020,938) − 1] on 31 March 2008 and 0.2% [= (809,377/807,687) − 1] on 31 March 2009. Although the estimated fair values are higher, the difference is small and would most likely not materially affect an analysis of the company.
2.4. Derecognition of Debt
Once bonds are issued, a company may leave the bonds outstanding until maturity or redeem the bonds before maturity either by calling the bonds (if the bond issue includes a call provision) or by purchasing the bonds in the open market. If the bonds remain outstanding until the maturity date, the company pays bondholders the face value of the bonds at maturity. The discount or premium on the bonds would be fully amortized at maturity; the carrying amount would equal face value. Upon repayment, bonds payable is reduced by the carrying amount at maturity (face value) of the bonds and cash is reduced by an equal amount. Repayment of the bonds appears in the statement of cash flows as a financing cash outflow.
If a company decides to redeem bonds before maturity and thus extinguish the liability early, bonds payable is reduced by the carrying amount of the redeemed bonds. The difference between the cash required to redeem the bonds and the carrying amount of the bonds is a gain or loss on the extinguishment of debt. Under IFRS, debt issuance costs are included in the measurement of the liability and are thus part of its carrying amount. Under U.S. GAAP, debt issuance costs are accounted for separately from bonds payable and are amortized over the life of the bonds. Any unamortized debt issuance costs must be written off at the time of redemption and included in the gain or loss on debt extinguishment.
For example, a company reporting under IFRS has a £10 million bond issuance with a carrying amount equal to its face value and five years remaining until maturity. The company redeems the bonds at a call price of 103. The redemption cost is £10.3 million (= £10 million × 103%). The company’s loss on redemption would be £300 thousand (£10 million carrying amount minus £10.3 million cash paid to redeem the callable bonds).
A gain or loss on the extinguishment of debt is disclosed on the income statement, in a separate line item, when the amount is material. A company typically discloses further detail about the extinguishment in the management discussion and analysis (MD&A) and/or notes to the financial statements.6 In addition, in a statement of cash flows prepared using the indirect method, net income is adjusted to remove any gain or loss on the extinguishment of debt from operating cash flows and the cash paid to redeem the bonds is classified as cash used for financing activities. (Recall that the indirect method of the statement of cash flows begins with net income and makes necessary adjustments to arrive at cash from operations, including removal of gains or losses from nonoperating activities.)
To illustrate the financial statement impact of the extinguishment of debt, consider the notes payable repurchase by B+H Ocean Carriers in Example 12-6.
EXAMPLE 12-6 Debt Extinguishment Disclosure
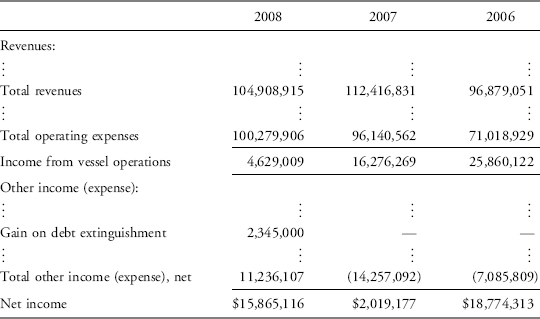
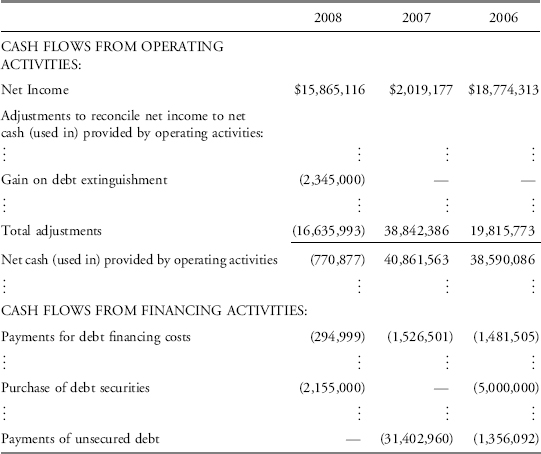
The following excerpts are from the 2008 20-F filing of B+H Ocean Carriers (NYSE Alternext: BHO). In its statement of cash flows, the company uses the indirect method to reconcile net income with net cash (used in) provided by operations.
Excerpt from Consolidated Statements of Income for the Years Ended 31 December 2008, 2007, and 2006
Excerpt from Consolidated Statements of Cash Flows for the Years Ended 31 December 2008, 2007, and 2006
Excerpt from NOTE 2: SUMMARY OF SIGNIFICANT ACCOUNTING POLICIES
. . .The carrying amount of the Company’s variable rate long-term debt approximates fair value.
Excerpt from NOTE 8: BONDS PAYABLE
On December 12, 2006, the Company issued $25 million of unsecured bonds.. . . Interest on the bonds is equal to LIBOR plus 4%, payable quarterly in arrears.. . . During the 4th quarter of 2008, the Company repurchased the unsecured bonds with a face value of $4.5 million and realized a $2.3 million gain.
1. The balance in bonds payable was reduced at redemption by:
A. $2,155,000.
B. $2,345,000.
C. $4,500,000.
Solution to 1: C is correct. The bonds payable is reduced at redemption by the carrying amount of the bonds redeemed. The cash paid to extinguish the bonds plus the gain on redemption equals the carrying amount of the bonds. The carrying amount of the bonds was $4,500,000. In this case, the carrying amount equals the face value. The company recognized a gain of $2,345,000 when it extinguished the debt of $4,500,000 by paying only $2,155,000.
2.5. Debt Covenants
Borrowing agreements (the bond indenture) often include restrictions called covenants that protect creditors by restricting activities of the borrower. Debt covenants benefit borrowers to the extent that they lower the risk to the creditors and thus reduce the cost of borrowing. Affirmative covenants restrict the borrower’s activities by requiring certain actions. For instance, covenants may require that the borrower maintain certain ratios above a specified amount or perform regular maintenance on real assets used as collateral. Negative covenants require that the borrower not take certain actions. Covenants may restrict the borrower’s ability to invest, pay dividends, or make other operating and strategic decisions that might adversely affect the company’s ability to pay interest and principal.
Common covenants include limitations on how borrowed monies can be used, maintenance of collateral pledged as security (if any), restrictions on future borrowings, requirements that limit dividends, and requirements to meet specific working capital requirements. Covenants may also specify minimum acceptable levels of financial ratios, such as debt-to-equity, current, or interest coverage.
When a company violates a debt covenant, it is a breach of contract. Depending on the severity of the breach and the terms of the contract, lenders may choose to waive the covenant, be entitled to a penalty payment or higher interest rate, renegotiate, or call for payment of the debt. Bond contracts typically require that the decision to call for immediate repayment be made, on behalf of all the bondholders, by holders of some minimum percentage of the principal amount of the bond issue.
Example 12-7 illustrates common disclosures related to debt covenants included in financial statement disclosures (notes to the financial statements).
EXAMPLE 12-7 Illustration of Debt Covenant Disclosures
The following excerpt is from TORM A/S (NASDAQ: TORM) from the Risk Factors section of Item 3, Key Information, in its fiscal year 2008 20-F filing. The excerpt illustrates debt covenants and their disclosure:
Certain of our loan agreements contain restrictive covenants, which may limit our liquidity and corporate activities and prevent proper service of debt, which could result in the loss of our vessels.
Some loan agreements impose operating and financial restrictions upon us. These restrictions may limit our ability to:
- Change the management of our vessels without the lenders’ consent (which they are not entitled to unreasonably withhold).
- Enter into mergers or corporate restructurings, or effect material divestments, if such would be materially adverse to the company.
Our lenders’ interests may be different from ours and we cannot guarantee that we will be able to obtain our lenders’ permission when needed. This may prevent us from taking actions that are in our best interest.
The following excerpt is an additional excerpt from “Note 8: Bonds Payable” of B+H Ocean Carriers that was referenced in Example 12-6.
The bond facility contains certain restrictive covenants which restrict the payment of dividends. The facility requires a minimum value adjusted equity ratio (as defined) of 25%. At December 31, 2008, the Company was in compliance with these covenants and is likely to remain in compliance throughout 2009. However, the bond agreement contains a cross default provision that essentially enables the lender to call the bonds if the Company defaults on a separate loan facility. The Company reclassified its long-term debt because of a determination prospectively that certain covenants in certain long-term agreements may be breached during 2009. As such, the Company has recorded the entire balance of the bonds as current as of December 31, 2008.
1. Which of the covenants described in the previous excerpts is an affirmative covenant?
2. Based on the excerpt from B+H Ocean Carriers, what is the implied consequence of breaching certain covenants?
Solution to 1: The requirement that “a minimum value adjusted equity ratio (as defined) of 25 percent” be maintained by B+H Ocean Carriers is an example of an affirmative covenant. It requires the issuer to do something. The covenants on TORM A/S require that TORM not take certain actions (e.g., not change management of vessels without lenders’ consent and not enter into mergers that would be materially adverse) and are negative covenants.
Solution to 2: If B+H Ocean Carriers breaches certain covenants, it seems that the entire balance of bonds payable becomes due. The bonds payable have been prospectively moved from noncurrent to current liabilities.
2.6. Presentation and Disclosure of Long-Term Debt
The noncurrent (long-term) liabilities section of the balance sheet usually includes a single line item of the total amount of a company’s long-term debt due after one year, with the portion of long-term debt due in the next twelve months shown as a current liability. Notes to the financial statements provide more information on the types and nature of a company’s debt. These note disclosures can be used to determine the amount and timing of future cash outflows. The notes generally include stated and effective interest rates, maturity dates, restrictions imposed by creditors (covenants), and collateral pledged (if any). The amount of scheduled debt repayments for the next five years also is shown in the notes.
Example 12-8 contains an excerpt from Johnson & Johnson’s 2008 10-K filing that illustrates common long-term debt disclosures.
EXAMPLE 12-8 Illustration of Long-Term Debt Disclosures
Exhibit 12-1 is an excerpt from Note 6 of Johnson & Johnson’s (NYSE: JNJ) 2008 financial statements that illustrates financial statement disclosure for long-term debt, including type and nature of long-term debt, effective interest rates, and required payments over the next five years. Johnson & Johnson reports its debt at amortized cost.
EXHIBIT 12-1 Johnson & Johnson
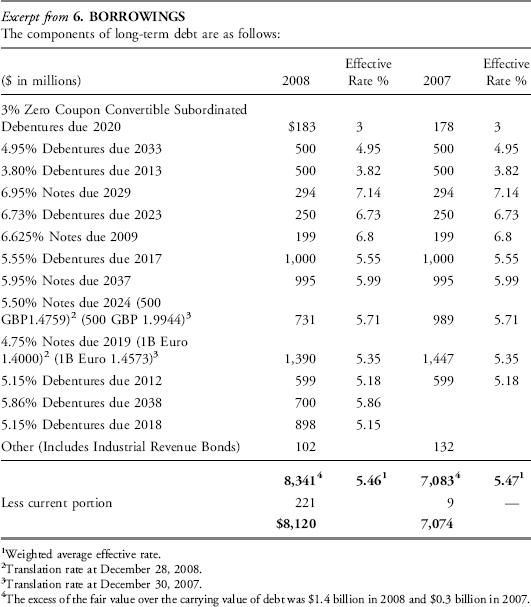
The Company has access to substantial sources of funds at numerous banks worldwide. In September 2008, the Company secured a new 364-day and 5-year Credit Facility. Total credit available to the Company approximates $7.7 billion of which $6.3 billion expires September 24, 2009, and $1.4 billion expires September 25, 2013. Interest charged on borrowings under the credit line agreements is based on either bids provided by banks, the prime rate or London Interbank Offered Rates (LIBOR), plus applicable margins. Commitment fees under the agreements are not material.
. . .
Aggregate maturities of long-term obligations commencing in 2007 are (dollars in millions):
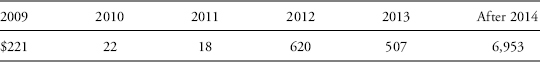
Use the information in Exhibit 12-1 to answer the following questions:
1. Why are the effective interest rates unchanged from 2007 and 2008 for the first 11 borrowings listed?
2. Why does the carrying amount of the “4.95% Debentures due 2033” remain the same in 2007 and 2008?
3. Why does the carrying amount of the “4.75% Notes due 2019” decrease from 2007 to 2008?
Solution to 1: The effective interest rate is the market rate at which the bonds are issued and does not change from year to year.
Solution to 2: The carrying amount of the “4.95% Debentures due 2033” remains the same because the effective interest rate at which the debentures were issued is the same as the coupon rate. The debentures were issued at par, and the carrying amount does not change.
Solution to 3: The notes are denominated in euros, with a face value of €1 billion. The dollar/euro translation exchange rate at the end of 2008 was lower than the exchange rate at the end of 2007 (1.4000 versus 1.4573). That decline explains the decrease in carrying value. Note that the face amount of the debt at the translation rate (at the end of 2008, €1 billion times 1.4000 = $1.4 billion) is higher than the carrying amount (at the end of 2008, $1.39 billion). The reason for this difference is that the notes were issued at a discount; the effective interest rate of 5.35 percent is higher than the 4.75 percent coupon rate. The carrying amount of the notes thus reflects the amortization of the discount at issuance; the amortization of the discount will increase the carrying amount.
In this chapter, we focus on accounting for simple debt contracts. Debt contracts can take on additional features, which lead to more complexity. For instance, convertible debt and debt with warrants are more complex instruments that have both debt and equity features. Convertible debt gives the debt holder the option to exchange the debt for equity. Bonds issued with warrants give holders the right to purchase shares of the issuer’s common stock at a specific price, similar to stock options. Issuance of bonds with warrants is more common by non-U.S. companies. Example 12-9 provides an example of a financial statement disclosure of bonds with warrants issued by a Chinese company.
EXAMPLE 12-9 Financial Statement Disclosure of Bonds with Warrants
The following excerpt is from the fiscal year 2008 Annual Report of the China Petroleum & Chemical Corporation (NYSE Euronext: SNP).
Excerpt from NOTE 29: DEBENTURES PAYABLE
On 26 February 2008, the Company issued convertible bonds with stock warrants due 2014 with an aggregate principal amount of RMB 30 billion in the PRC (the “Bonds with Warrants”). The Bonds with Warrants with fixed interest rate of 0.8% per annum and interest payable annually, were issued at par value of RMB 100. The Bonds with Warrants were guaranteed by Sinopec Group Company. Each lot of the Bonds with Warrants, comprising ten Bonds with Warrants are entitled to warrants (the “Warrants”) to subscribe 50.5 A shares of the Company during the 5 trading days prior to 3 March 2010 at an initial exercise price of RMB 19.68 per share, subject to adjustment for, amongst other things, cash dividends, subdivision or consolidation of shares, bonus issues, rights issues, capital distribution, change of control and other events which have a dilutive effect on the issued share capital of the Company.
If all warrants were exercised, how many shares would be subscribed for?
Solution: 1,515,000,000 shares would be subscribed for [aggregate principal amount divided by par value of a lot times shares subscribed per lot = (RMB 30,000,000,000/RMB 1,000) × 50.5 shares].
In addition to disclosures in the notes to the financial statements, an MD&A commonly provides other information about a company’s capital resources, including debt financing and off-balance-sheet financing. In the MD&A, management often provides a qualitative discussion on any material trends, favorable or unfavorable, in capital resources and indicates any expected material changes in their mix and relative cost. Additional quantitative information is typically provided, including schedules summarizing a company’s contractual obligations (e.g., bond payables) and other commitments (e.g., lines of credit and guarantees) in total and over the next five years.
A company wishing to obtain the use of an asset can either purchase the asset or lease the asset. Section 3.1 describes some advantages to leasing from the viewpoint of the lessee (the party obtaining the use of an asset through a lease). Section 3.2 describes the classification of leases. Section 3.2.1 describes the accounting treatments of different types of leases from the perspective of the lessee, and section 3.2.2 discusses leases from the perspective of the lessor (the owner of the asset).
3.1. Advantages of Leasing
A lease is a contract between the owner of an asset—the lessor—and another party seeking use of the asset—the lessee. Through the lease, the lessor grants the right to use the asset to the lessee. The right to use the asset can be for a long period, such as 20 years, or a much shorter period, such as a month. In exchange for the right to use the asset, the lessee makes periodic lease payments to the lessor. A lease, then, is a form of financing to the lessee provided by the lessor that enables the lessee to obtain the use of the leased asset.
There are several advantages to leasing an asset compared to purchasing it. Leases can provide less costly financing; they usually require little, if any, down payment and often are at lower fixed interest rates than those incurred if the asset was purchased. This financing advantage is the result of the lessor having advantages over the lessee and/or another lender. The lessor may be in a better position to take advantage of tax benefits of ownership, such as depreciation and interest. The lessor may be better able to value and bear the risks associated with ownership, such as obsolescence, residual value, and disposition of asset. The lessor may enjoy economies of scale for servicing assets. As a result of these advantages, the lessor may offer attractive lease terms and leasing the asset may be less costly for the lessee than owning the asset. Further, the negotiated lease contract may contain less-restrictive provisions than other forms of borrowing.
Companies also use certain types of leases because of perceived financial reporting and tax advantages. Although they provide a form of financing, certain types of leases are not shown as debt on the balance sheet. The items leased under these types of leases also do not appear as assets on the balance sheet. Therefore, no interest expense or depreciation expense is included in the income statement. In addition, in some countries—including the United States—because financial reporting rules differ from tax regulations, a company may own an asset for tax purposes (and thus obtain deductions for depreciation expense for tax purposes) while not reflecting the ownership in its financial statements. A lease that is structured to provide a company with the tax benefits of ownership while not requiring the asset to be reflected on the company’s financial statements is known as a synthetic lease.
3.2. Finance (or Capital) Leases versus Operating Leases
There are two main classifications of leases: finance (or capital) and operating leases.7 The economic substance of a finance (or capital) lease is very different from an operating lease, as are the implications of each for the financial statements for the lessee and lessor. In substance, a finance (capital) lease is equivalent to the purchase of some asset (lease to own) by the buyer (lessee) that is directly financed by the seller (lessor). An operating lease is an agreement allowing the lessee to use some asset for a period of time, essentially a rental.
Under IFRS, the classification of a lease as a finance lease or an operating lease depends on the transfer of the risks and rewards incidental to ownership of the leased asset.8 If substantially all the risks and rewards are transferred to the lessee, the lease is classified as a finance lease and the lessee reports a leased asset and lease obligation on its balance sheet. Otherwise, the lease is reported as an operating lease, in which case the lessee reports neither an asset nor a liability; the lessee reports only the lease expense. Similarly, if the lessor transfers substantially all the risks and rewards incidental to legal ownership, the lease is reported as a finance lease and the lessor reports a lease receivable on its balance sheet and removes the leased asset from its balance sheet. Otherwise, the lease is reported as an operating lease, and the lessor keeps the leased asset on its balance sheet. Examples of situations that would normally lead to a lease being classified as a finance lease include the following:9
- The lease transfers ownership of the asset to the lessee by the end of the lease term.
- The lessee has the option to purchase the asset at a price that is expected to be sufficiently lower than the fair value at the date the option becomes exercisable for it to be reasonably certain, at the inception of the lease, that the option will be exercised.
- The lease term is for the major part of the economic life of the asset, even if the title is not transferred.
- At the inception of the lease, the present value of the minimum lease payments amounts to at least substantially all of the fair value of the leased asset.
- The leased assets are of such a specialized nature that only the lessee can use them without major modifications.
Although accounting for leases under U.S. GAAP is guided by a similar principle of the transfer of benefits and risks, U.S. GAAP is more prescriptive in its criteria for classifying capital and operating leases. Four criteria are specified to identify when a lease is a capital lease:10
1. Ownership of the leased asset transfers to the lessee at the end of the lease.
2. The lease contains an option for the lessee to purchase the leased asset cheaply (bargain purchase option).
3. The lease term is 75 percent or more of the useful life of the leased asset.
4. The present value of lease payments is 90 percent or more of the fair value of the leased asset.
Only one of these criteria has to be met for the lease to be considered a capital lease by the lessee. On the lessor side, satisfying at least one of these four criteria plus meeting revenue recognition requirements (that is, being reasonably assured of cash collection and having performed substantially under the lease) determine a capital lease. If none of the four criteria are met or if the revenue recognition requirement is not met, the lessor reports the lease as an operating lease.
3.2.1. Accounting and Reporting by the Lessee
Because a finance lease is economically similar to borrowing money and buying an asset, a company that enters into a finance lease as the lessee reports an asset (leased asset) and related debt (lease payable) on its balance sheet. The initial value of both the leased asset and lease payable is the lower of the present value of future lease payments and the fair value of the leased asset; in many cases, these will be equal. On the income statement, the company reports interest expense on the debt, and if the asset acquired is depreciable, the company reports depreciation expense. (The lessor, as we illustrate in the next section, reports the sale of an asset and a lease as receivable.)
Because an operating lease is economically similar to renting an asset, a company that enters into an operating lease as the lessee records a lease expense on its income statement during the period it uses the asset. No asset or liability is recorded on its balance sheet. The main accounting differences for a lessee between a finance lease and an operating lease, then, are that reported assets and debt are higher and expenses are generally higher in the early years under a finance lease. Because of the higher reported debt and expenses under a finance lease, lessees often prefer operating leases to finance leases. (Although classifying a lease as an operating lease can make reported profitability ratios and debt-to-equity ratios appear better, financial analysts are aware of this impact and typically adjust the reported numbers accordingly.)
On the lessee’s statement of cash flows, for an operating lease, the full lease payment is shown as an operating cash outflow. For a finance lease, only the portion of the lease payment relating to interest expense reduces operating cash flow; the portion of the lease payment that reduces the lease liability appears as a cash outflow in the financing section.
Example 12-10 illustrates the accounting of a finance lease by a lessee.
EXAMPLE 12-10 Determining the Initial Recognition and Measurement and Subsequent Measurement of a Finance Lease for a Lessee
CAPBS Inc. enters into a lease agreement to acquire the use of a piece of machinery for four years beginning on 1 January 2010. The lease requires four annual payments of €28,679 starting on 1 January 2010. The useful life of the machine is four years, and its salvage value is zero. CAPBS accounts for the lease as a finance lease. The fair value of the machine is €100,000. The present value of the lease payments using the company’s discount rate of 10 percent is €100,000. (A reminder is relevant for present value calculations: Lease payments are made at the beginning of each period.) The company uses straight-line depreciation.
1. Comment on the appropriateness of CAPBS treating the lease agreement as a finance lease under IFRS and a capital lease under U.S. GAAP.
2. What is the amount reported as a leased asset on the balance sheet on 1 January 2010? What depreciation expense is reported in fiscal year 2010?
3. What is the amount of the machinery reported as a leased asset on the balance sheet on 31 December 2010?
4. What is the amount of the lease liability reported on the balance sheet on 1 January 2010? What interest expense is reported in fiscal year 2010?
5. What is the amount of the lease liability reported on the balance sheet on 31 December 2010? What interest expense is reported in fiscal year 2011?
6. If CAPBS had determined that this lease was an operating lease, what amount of expenses would be reported on the income statements in fiscal 2010 and 2011? How does this expense compare to the expenses reported under a capital lease?
Solution to 1: CAPBS should treat this lease as a finance lease under IFRS. The machine is leased for the major part of its useful life (the useful life of the machine and the lease are each four years). Also, the present value of lease payments equals substantially the fair value of the machine (both are €100,000). CAPBS should treat this lease as a capital lease under U.S. GAAP. The machine is leased for more than 75 percent of its useful life, and the present value of the lease payments exceeds 90 percent of the fair value of the leased asset.
Solution to 2: The amount initially reported as a leased asset on 1 January 2010 is €100,000. Depreciation expense each year is €25,000 [(€100,000 − €0)/4 years].
The following table shows CAPBS’s depreciation expense and carrying amount for the leased asset by year.
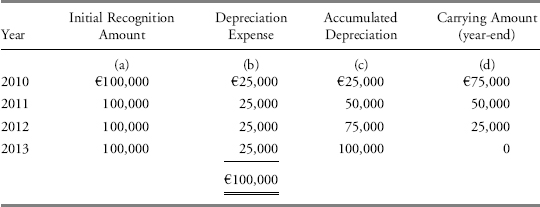
- Column (a) is the lower of the fair value of the machinery and the present value (PV) of lease payments at lease inception. In this example, they are the same.
- Column (b) is the depreciation expense of €25,000 per year [straight-line depreciation = acquisition cost less salvage value divided by useful life = (€100,000 − €0)/4 years].
- Column (c) is the accumulated depreciation on the leased asset calculated as the prior year’s accumulated depreciation plus the current year’s depreciation expense.
- Column (d) is the carrying amount of the machine (the leased asset), which is the difference between the initial recognition amount and accumulated depreciation.
Solution to 3: From the table presented in Solution to 2, the carrying amount on 31 December 2010 is €75,000.
Solution to 4: The amount of the lease liability initially recognized on 1 January 2010 is €100,000, which is both the fair value of the leased asset and the present value of lease payments. However, the first lease payment of €28,679, due on 1 January 2010, immediately reduces the lease liability balance to €71,321. Interest expense in 2010 is based on the €71,321 carrying amount. Interest expense reported in fiscal year 2010 is €7,132 (€71,321 × 10%).
The table following shows CAPBS’s lease payment, interest expense, and carrying values for its lease liability by year.11
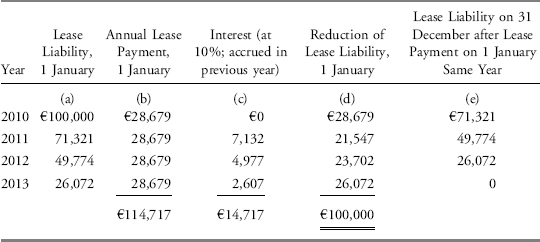
- Column (a) is the lease liability at the beginning of the year.
- 2010: €100,000
- Years thereafter: It is the lease liability at the end of the previous year
- Column (b) is the annual lease payment made at the beginning of the year. A portion of the lease payment reduces interest accrued in the previous year, and the remainder of the lease payment reduces the carrying amount of the lease liability.
- For example, in 2011, the €28,679 paid on 1 January reduces the interest payable of €7,132 that accrued in 2010 (€71,321 × 10%) and then reduces the lease liability by €21,547.
- Column (c) is the interest portion of the 1 January lease payment made on that date. This amount of interest was accrued as interest payable during the prior year and is reported as the interest expense of the prior year. For example, at 31 December 2010, interest expense and interest payable in the amount of €7,132 was recognized.
- Column (d) is the reduction of the lease liability, which is the difference between the annual lease payment and the interest portion.
- Column (e) is the lease liability on 31 December of a given year just before the lease payment is made on the first day of the next year. It is equal to the lease liability on 1 January of the same year (column a) less the reduction of the lease liability (column d).
Solution to 5: From the table presented in Solution to 4, the interest expense in fiscal year 2011 is €4,977 (€49,744 × 10%).
Solution to 6: As an operating lease, a rent expense of €28,679 would be reported on the income statement each year. Under a capital lease, the expenses related to the lease are depreciation and interest expense. In 2010, the depreciation expense is €25,000 and the interest expense is €7,132. In 2011, the depreciation expense is €25,000 and the interest expense is €4,977.
A company reporting a lease as an operating lease will typically show higher profits in early years, higher return measures in early years, and a stronger solvency position than an identical company reporting an identical lease as a finance lease. However, the company reporting the lease as a finance lease will show higher operating cash flows because the portion of the lease payment that reduces the carrying amount of the lease liability will be reflected as a financing cash outflow rather than an operating cash outflow. The interest expense portion of the lease payment on the statement of cash flows can be treated as operating or financing cash outflow under IFRS and is treated as an operating cash outflow under U.S. GAAP.
The explicit standards in the United States that determine when a company should report a capital lease versus an operating lease make it easier for a company to structure a lease so that it is reported as an operating lease. The company structures the lease so that none of the four capital lease identifying criteria is met. Similar to debt disclosures, however, lease disclosures show payments under both capital and operating leases for the next five years and afterward. These disclosures can help to estimate the extent of a company’s off-balance-sheet lease financing through operating leases. Example 12-11 illustrates the disclosures of operating and finance leases. Although these disclosures can be used to determine the effect on the financial statements if all operating leases were capitalized, this chapter focuses solely on the information that is disclosed.
EXAMPLE 12-11 Financial Statement Disclosure of Leases by the Lessee
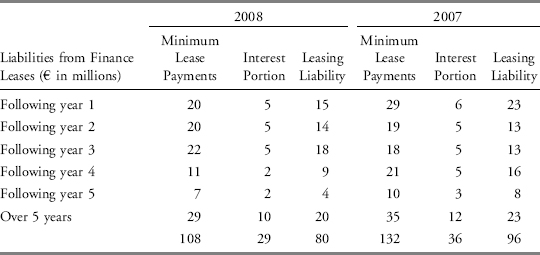
BASF Group (OTC: BASFY) has significant commitments under finance and operating leases. Following is selected note disclosure from its fiscal year 2008 financial statements.
27. LEASING
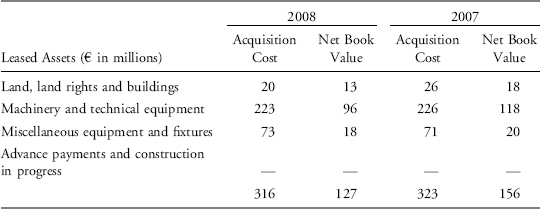
Leased assets
Property, plant and equipment include those assets which are considered to be economically owned through a finance lease. They primarily concern the following items:
In the current business year and in 2007, no additional lease payments arising from contractual obligations were recognized in income above the minimum lease payments.
In 2008, leasing liabilities were not offset by any expected minimum lease payments from sub-leases.
In addition, BASF is a lessee under operating lease contracts. The resulting lease obligations totaling €1,449 million in 2008 and €1,272 in 2007 are due in the following years:
| Commitments Due to Operating Lease Contracts (€ in millions) | ||
| Nominal Value of the Future Minimum Payments | ||
| Dec. 31, 2008 | Dec. 31, 2007 | |
| Less than 1 year | 280 | 292 |
| 1–5 years | 613 | 505 |
| Over 5 years | 556 | 475 |
| 1,449 | 1,272 | |
1. At the end of fiscal year 2008, what is the total amount of finance lease liabilities BASF reports on its balance sheet?
2. Based on finance lease agreements in place at the end of fiscal year 2008, how much will BASF pay out on finance lease commitments in fiscal year 2009?
3. Based on finance lease agreements in place at the end of fiscal year 2008, what is the amount of interest expense that BASF will report in fiscal year 2009?
4. At the end of fiscal 2008, what are BASF’s total commitments under operating leases?
5. Based on operating lease agreements in place at the end of fiscal year 2008, what is the minimum amount of rent expense that BASF will report in fiscal year 2009?
6. At the end of fiscal year 2008, what is the amount of leased assets (carrying amount) BASF reports on its balance sheet?
Solution to 1: €80 million—the total of the 2008 column “Leasing liability” in the “Liabilities from finance leases” table.
Solution to 2: €20 million—reported in the 2008 column “Minimum lease payments,” row “Following year 1,” in the “Liabilities from finance leases” table.
Solution to 3: €5 million—reported in the 2008 column “Interest portion,” row “Following year 1,” in the “Liabilities from finance leases” table.
Solution to 4: €1,449 million—the total of the 2008 column “Nominal value of the future minimum payments” in the “Commitments due to operating lease contracts” table.
Solution to 5: €280 million—reported in the 2008 column “Nominal value of the future minimum payments,” row “Less than 1 year,” in the “Commitments due to operating lease contracts” table.
Solution to 6: €127 million—the total of the 2008 column “Net book value” in the “Leased assets” table.
Example 12-12 contains information from Royal Dutch Shell’s (LSE: RDSA) 2008 financial statements. As required by IFRS, the balance sheet presents finance lease obligations in the line items labeled “Debt.” Additionally, IFRS require certain disclosures to be made in the notes; the layout of disclosure notes on debt varies across companies. For Royal Dutch, the disclosure note on debt, Note 18[A], first shows a breakdown of total debt reported on the balance sheet into two components: the amount of debt excluding finance lease obligations and the amount of finance lease obligations. Note 18[B] provides disclosures on the component of on-balance-sheet debt, excluding finance lease obligations. Next, Note 18[C] presents information about all the companies’ lease obligations—both finance leases (which are a component of the on-balance-sheet total debt) and operating leases (for which no obligation appears on the balance sheet). This disclosure clearly illustrates that although finance leases and operating leases are both contractual obligations, only the finance leases are reported on the balance sheet. As mentioned earlier, a subsequent chapter demonstrates how analysts adjust the total amount of debt as reported on the balance sheet to also include the off-balance-sheet obligations for operating leases. Analysts also should be aware that the International Accounting Standards Board (IASB) and the Financial Accounting Standards Board (FASB) are addressing the lease accounting standards, so these standards may change in the coming years.
EXAMPLE 12-12 Long-Term Debt and Lease Disclosures
Use the following excerpts taken from Royal Dutch Shell (LSE: RDSA) 2008 consolidated financial statements and notes to the consolidated financial statements to answer the following questions.
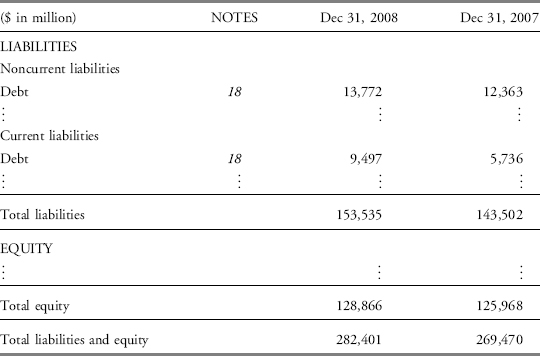
Excerpt from CONSOLIDATED BALANCE SHEET
Excerpt from CONSOLIDATED STATEMENT OF CASH FLOWS
| Dec 31, 2008 | Dec 31, 2007 | |
| Net increase/(decrease) in debt with maturity period within three months | 4,161 | (455) |
| Other debt: New borrowings | 3,555 | 4,565 |
| Repayments | (2,890) | (2,796) |
Excerpt from NOTE 1: BASIS OF PREPARATION
The Consolidated Financial Statements of Royal Dutch Shell plc (the Company) and its subsidiaries (collectively known as “Shell” or the “Shell group”) have been prepared in accordance with the provisions of the Companies Act 1985, Article 4 of the International Accounting Standards (IAS) Regulation and with International Financial Reporting Standards (IFRS) as adopted by the European Union. As applied to Shell, there are no material differences with IFRS as issued by the International Accounting Standards Board (IASB), therefore the Consolidated Financial Statements have been prepared in accordance with IFRS as issued by the IASB.
Excerpt from NOTE 2: ACCOUNTING POLICIES
Financial liabilities
Debt and accounts payable are recognized initially at fair value based on amounts exchanged and subsequently at amortized cost, except for fixed rate debt subject to fair value hedging, which is remeasured for the hedged risk (see “Derivative contracts”).
Interest on debt is accounted for using the effective interest method and, other than interest capitalized, is recognized in income.
Where fair value is not applied subsequent to initial recognition but is required for disclosure purposes, it is based on market prices where available, otherwise it is calculated as the net present value of expected future cash flows.
Excerpt from NOTE 18: DEBT AND LEASE ARRANGEMENTS
[A] DEBT ($ in millions)
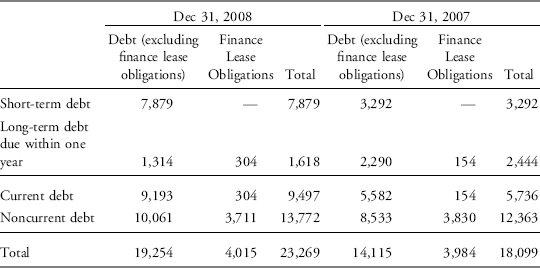
The fair value of debt approximates the carrying amount.
[B] DEBT (EXCLUDING FINANCE LEASE OBLIGATIONS)
The following tables compare contractual cash flows for debt (excluding finance lease obligations) owed by subsidiaries at December 31, by year of maturity, with the carrying amount in the Consolidated Balance Sheet. The carrying amount reflects the effects of discounting, premiums and fair value adjustments where hedging is applied.
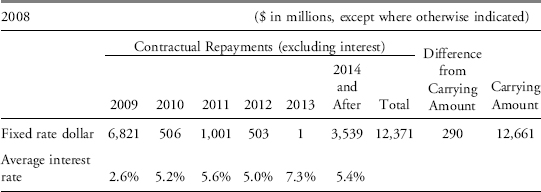
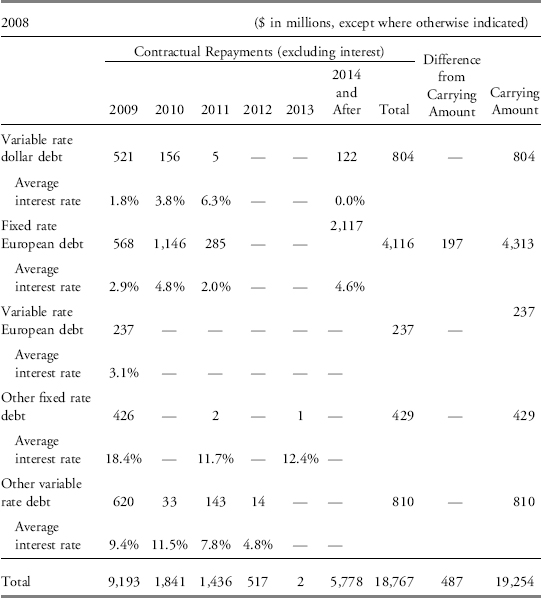
This table excludes interest estimated to be $827 million in 2009, $480 million in 2010, $389 million in 2011, $316 million in 2012, $290 million in 2013 and $290 million in 2014 and after (assuming interest rates with respect to variable rate debt remain constant and there is no change in aggregate principal amount of debt other than repayment at scheduled maturity as reflected in the table).
The weighted average interest rate on short-term debt excluding the short-term portion of long-term debt at December 31, 2008, was 4% (2007: 7%).
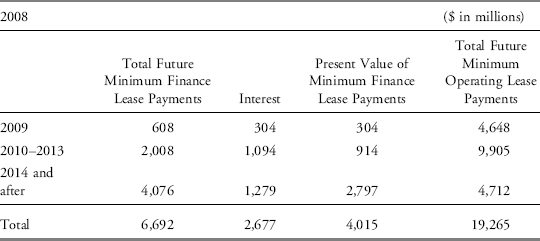
[C] LEASE ARRANGEMENTS
The future minimum lease payments for finance and operating leases and the present value of minimum finance lease payments at December 31, by maturity date are as follows:
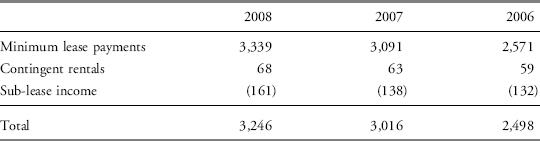
Operating lease expenses were as follows ($ in millions):
Use this information to answer the following questions:
1. How does Royal Dutch Shell initially value its debt on the balance sheet? How is debt subsequently measured on the balance sheet?
2. What method does Shell use to calculate interest expense on its debt?
3. What is the total amount of debt appearing within current liabilities on the balance sheet at 31 December 2008, and what does it include?
4. What is the total amount of debt due after one year appearing on the balance sheet at 31 December 2008, and what does it include?
5. How does the interest rate in 2008 on short-term debt (excluding finance lease obligations and the short-term portion of long-term debt) compare to that in 2007?
6. What is the fair value of Royal Dutch Shell’s debt at 31 December 2008?
7. What was Royal Dutch Shell’s rent expense in fiscal year 2008 related to operating leases?
8. Comment on the relative magnitude of operating leases compared to finance leases?
9. What are Shell’s debt-to-equity ratios for 2008 and 2007? Comment on year-to-year changes.
Solution to 1: From Note 2, debt is initially reported at fair value based on amounts exchanged. After issuance, debt is reported at amortized cost except for certain fixed rate debt that is subject to fair value hedging. That debt is remeasured to fair value.
Solution to 2: Note 2 indicates that Shell uses the effective interest rate method to calculate interest expense.
Solution to 3: The total amount of debt included in current liabilities on the balance sheet is $9,497. Note 18[A] shows that this amount comprises $7,879 short-term debt (excluding finance lease obligations), $1,314 long-term debt due within one year (excluding finance lease obligations), and $304 finance lease obligations. The finance lease obligations are those due within one year.
Solution to 4: The total amount of debt due after next year (noncurrent debt) is $13,722. Note 18[A] shows that this amount comprises $10,061 debt (excluding finance lease obligations) and $3,711 finance lease obligations.
Solution to 5: In Note 18 [B], Shell indicates that the interest rate on short-term debt has declined significantly. The weighted average interest rate at 31 December on short-term debt was 4 percent in 2008 and 7 percent in 2007.
Solution to 6: From Note 18 [A], Shell reports that the fair value of debt approximates its carrying amount. The carrying amount is $23,269.
Solution to 7: From Note 18 [C], rent expense on operating leases was $3,246 in 2008.
Solution to 8: Although operating and finance leases are accounted for differently, we can compare the undiscounted future minimum lease payments under operating leases and finance leases reported in Note 18 [C] to gain an initial understanding of their relative magnitude. The total future minimum lease payments under operating leases of $19,265 are more than two and one-half times the $6,692 under finance leases.
Solution to 9: Debt-to-equity ratios are calculated as follows ($ in millions):
| 2008 | 2007 | |
| Debt (included in noncurrent liabilities) | 13,772 | 12,363 |
| Debt (included in current liabilities) | 9,497 | 5,736 |
| Total current and noncurrent debt | 23,269 | 18,099 |
| Total equity | 128,866 | 125,966 |
| Debt-to-equity | 18.06% | 14.37% |
The debt-to-equity ratio increased to 18.06 percent in 2008 from 14.37 percent in 2007. This increase is primarily attributable to an increase in short-term debt. From Note 18 [A] disclosures, short-term debt increased by $4,587 million (from $3,292 million in 2007 to $7,879 million in 2008), while the current portion of long-term debt decreased by $826 million (from $2,444 million to $1,618 million) and the noncurrent portion of debt increased by only $1,409 million (from $12,363 million to $13,772 million). The financing section excerpt of the statement of cash flows discloses that Shell issued $4,161 million in short-term debt in 2008, compared with repaying short-term debt in 2007.
3.2.2. Accounting and Reporting by the Lessor
Similar to accounting and reporting on the lessee side, the lessor also must determine whether a lease is classified as operating or finance. Under IFRS, the determination of a finance lease on the lessor’s side mirrors that of the lessee’s. That is, in a finance lease the lessor transfers substantially all the risks and rewards incidental to legal ownership.12 Under U.S. GAAP, the lessor determines whether a lease is a capital or operating lease using the same four identifying criteria as a lessee, plus the additional revenue recognition criteria. That is, the lessor must be reasonably assured of cash collection and has performed substantially under the lease. From the lessor’s perspective, U.S. GAAP distinguishes between types of capital leases. There are two main types of capital leases from a lessor’s perspective: (1) direct financing leases, and (2) sales-type leases.13
Under IFRS and U.S. GAAP, if a lessor enters into an operating lease, the lessor records any lease revenue when earned. The lessor also continues to report the leased asset on the balance sheet and the asset’s associated depreciation expense on the income statement.
Under IFRS, if a lessor enters into a finance lease, the lessor reports a receivable at an amount equal to the net investment in the lease (the present value of the minimum lease payments receivable and any estimated unguaranteed residual value accruing to the lessor).14 The leased asset is derecognized; assets are reduced by the carrying amount of the leased asset. Initial direct costs incurred by a lessor, other than a manufacturer or dealer lessor, are added to the receivable and reduce the amount of income recognized over the lease term. The lease payment is treated as repayment of principal (reduces lease receivable) and finance income. The recognition of finance income should reflect a constant periodic rate of return on the lessor’s net investment in the lease.
For lessors that are manufacturers or dealers, the initial direct costs are treated as an expense when the selling profit is recognized; typically, selling profit is recognized at the beginning of the lease term. Sales revenue equals the lower of the fair value of the asset or the present value of the minimum lease payments. The cost of sale is the carrying amount of the leased asset less the present value of the estimated unguaranteed residual value.
Under U.S. GAAP, a direct financing lease results when the present value of lease payments (and thus the amount recorded as a lease receivable) equals the carrying value of the leased asset. Because there is no “profit” on the asset itself, the lessor is essentially providing financing to the lessee and the revenues earned by the lessor are financing in nature (i.e., interest revenue). If, however, the present value of lease payments (and thus the amount recorded as a lease receivable) exceeds the carrying amount of the leased asset, the lease is treated as a sales-type lease.
Both types of capital leases have similar effects on the balance sheet: The lessor reports a lease receivable based on the present value of future lease payments and derecognizes the leased asset. The carrying value of the leased asset relative to the present value of lease payments distinguishes a direct financing lease from a sales-type lease. A direct financing lease is reported when the present value of lease payment is equal to the value of the leased asset to the lessor. When the present value of lease payments is greater than the value of the leased asset, the lease is a sales-type lease. The income statement effect will thus differ based on the type of lease.
In a direct financing lease, the lessor exchanges a lease receivable for the leased asset, no longer reporting the leased asset on its books. The lessor’s revenue is derived from interest on the lease receivable. In a sales-type lease, the lessor “sells” the asset to the lessee and also provides financing on the sale. Therefore, in a sales-type lease, a lessor reports revenue from the sale, cost of goods sold (i.e., the carrying amount of the asset leased), profit on the sale, and interest revenue earned from financing the sale. The lessor will show a profit on the transaction in the year of inception and interest revenue over the life of the lease.
EXAMPLE 12-13 Determining Initial Recognition and Measurement and Subsequent Measurement of a Finance Lease When the Present Value of Lease Payments Equals the Value of the Leased Asset
DIRFIN Inc. owns a piece of machinery and plans to lease the machine on 1 January 2010. In the lease contract, DIRFIN requires four annual payments of €28,679 starting on 1 January 2010. DIRFIN is confident that the payments will be received. The useful life of the machine is four years, and its salvage value is zero. The present value of the lease payments and the fair value of the machine are each €100,000. The carrying amount for the machine also is €100,000. DIRFIN’s discount rate is 10 percent.
1. Comment on the appropriateness of DIRFIN’s treating the lease as a finance lease under IFRS and a capital lease under U.S. GAAP.
2. What is the amount of the lease receivable reported on the balance sheet on 1 January 2010? What is interest revenue reported in fiscal year 2010?
3. What is the carrying amount of the machine reported on the balance sheet on 1 January 2010?
4. What is the amount of the lease receivable reported on the balance sheet on 31 December 2010? What is interest income reported in fiscal year 2011?
5. If DIRFIN had determined the lease was an operating lease, what amount of income would be reported on the income statement in fiscal year 2010?
Solution to 1: Treating this lease as a finance lease under IFRS and a capital lease under U.S. GAAP is appropriate. Under IFRS, the lease meets at least two of the suggested criteria for a finance lease: (1) The lease term is for the major part of the economic life of the asset, and (2) at inception of the lease, the present value of the minimum lease payments amounts to at least substantially all of the fair value of the leased asset. Under U.S. GAAP, the lease meets more than one of the required criteria for a capital lease: (1) The lease term is 75 percent or more of the useful life of the leased asset (the lease term and useful life are both four years), and (2) the present value is 90 percent or more of the fair value of the leased asset (the present value of lease payments approximately equals the fair value of the machine). The revenue recognition requirement also is met. Under U.S. GAAP, this capital lease is classified as a direct financing lease because the present value of lease payment is equal to the value of the leased asset.
Solution to 2: DIRFIN removes the leased asset from its records and records a lease receivable. On its income statement, DIRFIN reports interest revenues earned from financing the lease. The table following shows DIRFIN’s interest revenue and carrying amounts for the lease receivable.
On 1 January 2010, the lease receivable is initially recorded at €100,000. Immediately after the first lease payment is received on 1 January 2010, the carrying amount of the lease receivable decreases to €71,321 and remains at this amount through 31 December 2010. Interest revenue for 2010 is €7,132 (10 percent interest rate times the loan receivable balance of €71,321 throughout 2010).
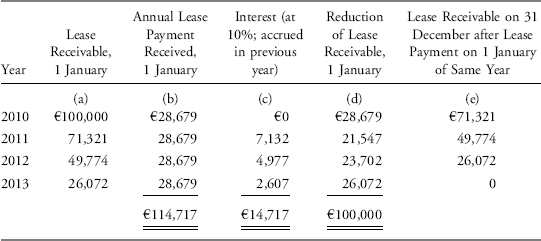
- Column (a) is the lease receivable at the beginning of the year.
- Column (b) is the annual lease payment received at the beginning of the year, which is allocated to interest and reduction of the lease receivable.
- Column (c) is interest for the year calculated as the lease receivable outstanding for the year multiplied by the interest rate.
- Column (d) is the reduction of the lease receivable, which is the difference between the annual lease payments received and interest. Because the lease payment is due on 1 January, this amount of interest is a receivable at the end of the prior year and interest revenue of the prior year.
- Column (e) is the lease receivable after the lease payment is received and at the end of the year. It is the lease receivable at 1 January (column a) less the reduction of the lease receivable (column d).
Solution to 3: DIRFIN effectively sells the machine through the finance lease and so reports no carrying amount for the machine.
Solution to 4: The lease receivable is €71,321 at 31 December 2010. At 1 January 2011, the lease receivable decreases to €49,774 after the second lease payment is received on 1 January 2011. Interest revenue for 2011 is €4,977 (10 percent interest rate times the loan receivable balance of €49,774 throughout 2011).
Solution to 5: As an operating lease, rent income of €28,679 would be reported on the income statement.
When a lessor enters into a sales-type lease (a lease agreement where the present value of the future lease payments is greater than the value of the leased asset to the lessor), it will show a profit on the transaction in the year of lease inception and interest revenue over the life of the lease.
EXAMPLE 12-14 Determining the Financial Statement Impact of a Finance Lease by the Lessor when the Present Value of Lease Payments Is Greater than the Value of the Leased Asset
Assume a (hypothetical) company, Selnow, manufactures machinery and enters into an agreement to lease a machine on 1 January 2010. Under the lease, the company is to receive four annual payments of €28,679 starting on 1 January 2010. Selnow is confident that the payments will be received. The fair value of the machine and present value of the lease payments (using a 10 percent discount rate) are each €100,000, and the carrying amount of the machine is €90,000. The useful life of the machine is four years, and its salvage value is zero.
1. Comment on the appropriateness of Selnow’s treatment of the lease agreement as a finance lease under IFRS and a capital lease under U.S. GAAP.
2. What is Selnow’s income related to the lease in 2010? In 2011? Ignore taxes.
Solution to 1: Treating this lease as a finance lease under IFRS and a capital lease under U.S. GAAP is appropriate.
Under IFRS, the lease meets at least two of the suggested criteria for a finance lease: (1) The lease term is for the major part of the economic life of the asset (the lease term and useful life of the machine are both four years), and (2) at inception of the lease the present value of the minimum lease payments amounts to at least substantially all of the fair value of the leased asset (the present value of lease payments equals the fair value of the machine).
Under U.S. GAAP, the lease meets more than one of the required capital lease criteria, including the following: (1) The lease term is 75 percent or more of the useful life of the leased asset (the lease term and useful life of the machine are both four years), and (2) the present value is 90 percent or more of the fair value of the leased asset. The revenue recognition requirement also is met (Selnow is confident that the payments will be received). Further, under U.S. GAAP this lease is classified as a sales-type lease because the present value of the lease payments is greater than the carrying amount of the leased asset.
There is no difference, however, in accounting between IFRS and U.S. GAAP as a result of this additional classification under U.S. GAAP. The present value of the future lease payments is more than the lessor’s carrying amount for the machine, and the difference is the lessor’s profit from selling the machine. The lessor will record a profit of €10,000 on the sale of the machine in 2010 (€100,000 present value of lease payments receivable less €90,000 value of the machine).
Solution to 2: In 2010, Selnow shows income of €17,132 related to the lease. One part of this income is the €10,000 gain on the sale of the machine (sales revenues of €100,000 less costs of goods sold of €90,000). Selnow also shows interest revenue of €7,132 on its financing of the lease (lease receivable of €71,321 after the initial lease payment is received times the 10 percent discount rate). In 2011, Selnow reports only the interest revenue of €4,977 (lease receivable of €49,774 after the 1 January lease payment is received times the 10 percent discount rate). The table following shows lease payments received, interest revenue, and reduction of the lease receivable for Selnow’s sales-type lease. Note that this table is the same as DIRFIN’s table in Example 12-13 with the direct financing lease. They are the same because the present value of the lease payments in both cases is the same. It is the carrying amount of the machine that differs between the two examples.
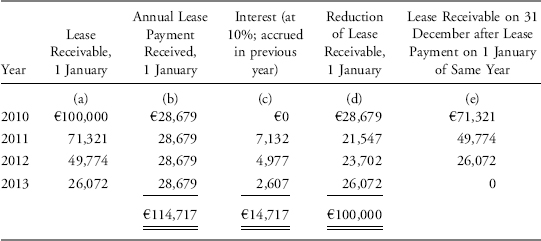
Exhibit 12-2 summarizes the financial statement impact of operating and financing leases on the lessee and lessor.
EXHIBIT 12-2 Summary of Financial Statement Impact of Operating and Financing Leases on the Lessee and Lessor
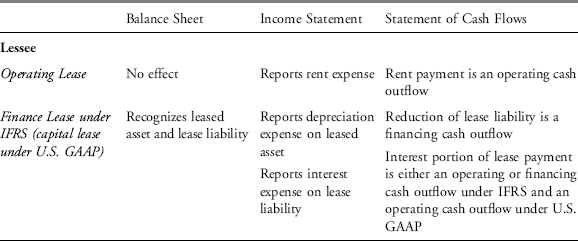
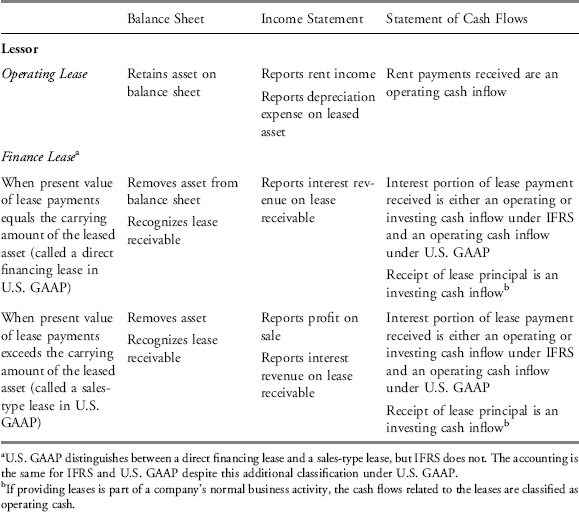
4. INTRODUCTION TO PENSIONS AND OTHER POSTEMPLOYMENT BENEFITS
Pensions and other postemployment benefits are noncurrent liabilities reported by many companies. Companies may offer various types of benefits to their employees following retirement, such as pension plans, health care plans, medical insurance, and life insurance. Pension plans often are the most significant postemployment benefits provided to retired employees.
The accounting and reporting depends on the type of pension plan offered. Two common pension plans are the defined contribution plan and the defined benefit plan. Under a defined contribution plan, a company contributes an agreed-upon (defined) amount into the plan. The agreed-upon amount is the pension expense. The only impact on the balance sheet is a decrease in cash; however, if some portion of the agreed-upon amount has not been paid by fiscal year-end, a liability would be recognized on the balance sheet. The amount paid (contributed to the plan) is treated as an operating cash outflow. Because the amount of the contribution is defined and the company has no further obligation once the contribution has been made, accounting for a defined contribution plan is fairly straightforward.
Accounting for a defined benefit plan is more complicated. Under a defined benefit plan, a company makes promises of future benefits to be paid to the employee during retirement. For example, a company could promise an employee annual pension payments of 70 percent of his final salary at retirement until death. To determine the amount of the obligation for the promise to pay the employee the pension during retirement, many assumptions have to be made, such as the employee’s expected salary at retirement and the number of years the employee is expected to live beyond retirement. The future amounts the company will pay out are estimated and discounted to a present value to determine the pension obligation. The pension obligation is allocated over the employee’s employment as part of pension expense.
The company’s reported pension expense includes five common components: (a) employees’ service costs incurred during the period; (b) interest expense accrued on the beginning pension obligation; (c) actuarial gains and losses; (d) changes to the terms of a pension plan that increase the benefit obligation applicable to employees’ service during previous periods (past service costs); and (e) expected return on plan assets.
The service cost during the period for an employee is the present value of the increase in the pension benefit earned by the employee as a result of providing one more year of service. Interest costs are included in pension expense because a defined benefit pension plan can be considered a long-term borrowing from employees. Instead of paying employees for the services they provide this year, a company is deferring payment until future periods. Because the employees have provided the service to earn their pensions, the company has an obligation to them. Like other borrowings, interest accrues on the amount of the pension obligation outstanding.
Most defined benefit pension plans are funded through a separate legal entity, typically a pension trust fund. A company makes payments into the pension fund, and retirees are paid from the fund. The payments the company makes into the fund are invested until they are needed to pay the retirees. Expected earnings on the investments are subtracted from other pension costs to get the reported pension expense. Because of year-to-year fluctuations in market returns, standard setters allow companies to use an expected rather an actual return to reduce the volatility of reported pension expense. Pension plan assets are intended as long-term investments; if the expected returns are accurately estimated, differences between the actual return and the expected return should offset over the long run. If the difference between the expected return and actual return becomes large, however, companies are required to amortize a portion into pension expense.
Actuarial gains and losses can occur when changes are made to the assumptions on which a company’s estimated pension obligation has been based (e.g., employee turnover, mortality rates, retirement ages, compensation increases). Prior service costs arise because of changes in benefits promised. Some actuarial gains and losses, and past service costs, might not yet be recognized in pension expense or the pension obligation because IFRS and U.S. GAAP allow companies to “smooth” the effects of these two items over time rather than immediately reflect the total amount of the effect as income or expense.
Similar to other forms of employee compensation for a manufacturing company, the pension expense related to production employees is added to inventory and expensed through cost of sales (cost of goods sold). For employees not involved directly in the production process, the pension expense is included with salaries and other administrative expenses. Therefore, pension expense is not directly reported on the income statement. Rather, extensive disclosures are included in the notes to the financial statements.
Under IFRS, companies can choose how to measure the net pension obligation (or asset) reported on the balance sheet. Companies can choose to measure the net pension obligation (or asset) as the pension obligation less plan assets. If the pension obligation is greater than plan assets, a net pension obligation is shown and the pension fund is underfunded. If the plan assets are greater than the plan liabilities, a net pension asset is reported. Alternatively, companies can choose to exclude the unrecognized smoothed amounts of actuarial gains or losses or past service costs from the balance sheet. Under U.S. GAAP, companies are required to measure the net pension obligation (or asset) as the pension obligation less plan assets.
Example 12-15 presents excerpts of pension-related disclosures from Novo Nordisk’s 2008 Annual Report.
EXAMPLE 12-15 Pension-Related Disclosures
The following are excerpts of pension-related disclosures from Novo Nordisk’s (NYSE: NVO) 2008 Annual Report:
NOTE 1 SUMMARY OF SIGNIFICANT ACCOUNTING POLICIES
Pensions
The Group operates a number of defined contribution plans throughout the world. In a few countries the group still operates defined benefit plans. The costs for the year for defined benefit plans are determined using the projected unit credit method. This reflects services rendered by employees to the dates of valuation and is based on actuarial assumptions primarily regarding discount rates used in determining the present value of benefits, projected rates of remuneration growth and long-term expected rates of return for plan assets. Discount rates are based on the market yields of high-rated corporate bonds in the country concerned.
Actuarial gains and losses are recognized as income or expense when the net cumulative unrecognized actuarial gains and losses for each individual plan at the end of the previous reporting period exceeded 10% of the higher of the defined benefit obligation and the fair value of plan assets at that date. These gains or losses are recognized over the expected average remaining working lives of the employees participating in the plans. Past service costs are allocated over the average period until the benefits become vested.
NOTE 6 EMPLOYEE COSTS
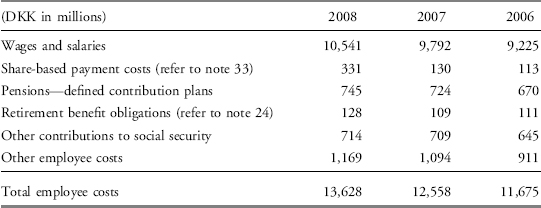
NOTE 24 RETIREMENT BENEFIT OBLIGATIONS
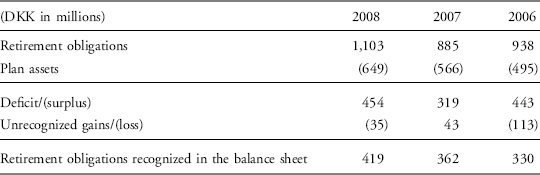
AMOUNTS RECOGNIZED IN THE INCOME STATEMENT FOR THE YEAR
| Current service cost | 112 | 91 |
| Interest cost on pension obligation | 41 | 32 |
| Expected return on plan assets | (24) | (18) |
| Actuarial (gains)/losses recognized in the year | (2) | 1 |
| Past service cost | 1 | 3 |
| Total income statement charge | 128 | 109 |
Use information in the excerpts to answer the following questions:
1. What type(s) of pension plans does Novo Nordisk have?
2. What amount of pension expense did Novo Nordisk report in 2008?
3. What is reported on Novo Nordisk’s 2008 balance sheet with respect to pensions?
4. If Novo Nordisk had chosen the pension reporting alternative consistent with U.S. GAAP, what would have been reported on Novo Nordisk’s 2008 balance sheet with respect to pensions?
Solution to 1: Note 1 “Summary of significant accounting policies” indicates that the company has both defined contribution and defined benefit pension plans. The note indicates that the company continues to operate defined benefit plans in only a few countries.
Solution to 2: Note 6 “Employee costs” shows that the pension expense related to the defined contribution pension plans was DKK745 million and that related to the retirement benefit obligations of the defined benefit plans was DKK128 million. Details of the DKK128 million pension expense (income statement charge) of the defined benefit plans are shown in Note 24 under “Amounts recognized in the income statement for the year.” The total pension expense reported for 2008 was DKK873 million.
Solution to 3: Note 24 “Retirement benefit obligations” shows the net pension obligation recognized in the balance sheet for fiscal year 2008 to be DKK419 million. This amount is the retirement obligation less plan assets, after adjusting for the unrecognized gain or loss related to the smoothed items. By subtracting unrecognized losses, Novo Nordisk uses the alternative treatment allowed under IFRS.
Solution to 4: If Novo Nordisk chose the treatment consistent with U.S. GAAP, its net pension obligation would have been DKK454 million:
| (DKK in millions) | 2008 |
| Retirement obligations | 1,103 |
| Plan assets | (649) |
| Deficit/(surplus) | 454 |
5. EVALUATING SOLVENCY: LEVERAGE AND COVERAGE RATIOS
Solvency refers to a company’s ability to meet its long-term debt obligations, including both principal and interest payments. In evaluating a company’s solvency, ratio analyses can provide information about the relative amount of debt in the company’s capital structure and the adequacy of earnings and cash flow to cover interest expense and other fixed charges (such as lease or rental payments) as they come due. Ratios are useful to evaluate a company’s performance over time compared to the performance of other companies and industry norms. Ratio analysis has the advantage of allowing the comparison of companies regardless of their size and reporting currency.
The two primary types of solvency ratios are leverage ratios and coverage ratios. Leverage ratios focus on the balance sheet and measure the extent to which a company uses liabilities rather than equity to finance its assets. Coverage ratios focus on the income statement and cash flows and measure the ability of a company to cover its debt-related payments.
Exhibit 12-3 describes the two types of commonly used solvency ratios. The first three leverage ratios use total debt in the numerator.15 The debt-to-assets ratio expresses the percentage of total assets financed with debt. Generally, the higher the ratio, the higher the financial risk and thus the weaker the solvency. The debt-to-capital ratio measures the percentage of a company’s total capital (debt plus equity) financed through debt. The debt-to-equity ratio measures the amount of debt financing relative to equity financing. A debt-to-equity ratio of 1.0 indicates equal amounts of debt and equity, which is the same as a debt-to-capital ratio of 50 percent. Interpretations of these ratios are similar. Higher debt-to-capital or debt-to-equity ratios imply weaker solvency. A caveat must be made when comparing debt ratios of companies in different countries. Within certain countries, companies historically have obtained more capital from debt than equity financing, so debt ratios tend to be higher for companies in these countries.
EXHIBIT 12-3 Definitions of Commonly Used Solvency Ratios
| Solvency Ratios | Numerator | Denominator |
| Leverage ratios | ||
| Debt-to-assets ratio | Total debta | Total assets |
| Debt-to-capital ratio | Total debta | Total debta+Total shareholders’ equity |
| Debt-to-equity ratio | Total debta | Total shareholders’ equity |
| Financial leverage ratio | Average total assets | Average shareholders’ equity |
| Coverage ratios | ||
| Interest coverage ratio | EBITb | Interest payments |
| Fixed charge coverage ratio | EBITb+lease payments | Interest payments+lease payments |
aIn this chapter, debt is defined as the sum of interest-bearing short-term and long-term debt.
bEBIT is earnings before interest and taxes.
The financial leverage ratio (also called the “leverage ratio” or “equity multiplier”) measures the amount of total assets supported by one money unit of equity. For example, a value of 4 for this ratio means that each €1 of equity supports €4 of total assets. The higher the financial leverage ratio, the more leveraged the company in the sense of using debt and other liabilities to finance assets. This ratio often is defined in terms of average total assets and average total equity and plays an important role in the DuPont decomposition of return on equity.16
The interest coverage ratio measures the number of times a company’s EBIT could cover its interest payments. A higher interest coverage ratio indicates stronger solvency, offering greater assurance that the company can service its debt from operating earnings. The fixed charge coverage ratio relates fixed financing charges, or obligations, to the cash flow generated by the company. It measures the number of times a company’s earnings (before interest, taxes, and lease payments) can cover the company’s interest and lease payments.
Example 12-16 demonstrates the use of solvency ratios in evaluating the creditworthiness of a company.
EXAMPLE 12-16 Evaluating Solvency Ratios
A credit analyst is evaluating and comparing the solvency of two companies—Nokia Corporation (NYSE: NOK) and LM Ericsson Telephone Company (NYSE: ERIC)—at the beginning of 2009. The following data are gathered from the companies’ 2008 annual reports and 20-F filings:
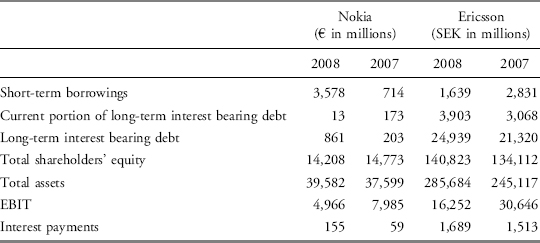
Use this information to answer the following questions:
1.
A. What are each company’s debt-to-assets, debt-to-capital, and debt-to-equity ratios for 2008 and 2007?
B. Comment on any changes in the calculated leverage ratios from year-to-year for both companies.
C. Comment on the calculated leverage ratios of Nokia compared to Ericsson.
2.
A. What is each company’s interest coverage ratio for 2008 and 2007?
B. Comment on any changes in the interest coverage ratio from year to year for both companies.
C. Comment on the interest coverage ratio of Nokia compared to Ericsson.
Solution to 1:
A. For Nokia
Debt-to-assets for 2008: 11.2% = (3,578+13+861)/39,582
Debt-to-assets for 2007: 2.9% = (714+173+203)/37,599
Debt-to-capital for 2008: 23.9% = (3,578+13+861)/(3,578+13+861+ 14,208)
Debt-to-capital for 2007: 6.9% = (714+173+203)/(714+173+203+ 14,773)
Debt-to-equity for 2008: 31.3% = (3,578+13+861)/(14,208)
Debt-to-equity for 2007: 7.4% = (714+173+203)/(14,773)
For Ericsson
Debt-to-assets for 2008: 10.7% = (1,639+3,903+24,939)/(285,684)
Debt-to-assets for 2007: 11.1% = (2,831+3,068+21,320)/(245,117)
Debt-to-capital for 2008: 17.8% = (1,639+3,903+24,939)/(1,639+3,903+ 24,939+140,823)
Debt-to-capital for 2007: 16.9% = (2,831+3,068+21,320)/(2,831+3,068+ 21,320+134,112)
Debt-to-equity for 2008: 21.6% = (1,639+3,903+24,939)/(140,823)
Debt-to-equity for 2007: 20.3% = (2,831+3,068+21,320)/(134,112)
B. Nokia’s leverage ratios all increased from 2007 to 2008, suggesting weakening solvency. Comparing debt year to year, we observe that leverage ratios increased because of a significant increase in short-term borrowings and an increase in long-term interest bearing debt without a similar increase in shareholders’ equity. In fact, shareholders’ equity declined.
On the other hand, Ericsson’s leverage ratios appear fairly similar for 2007 and 2008. During 2008, it appears as though Ericsson shifted away from short borrowings to long-term debt.
C. In 2007, all three of Nokia’s leverage ratios were lower than Ericsson’s. In 2008, the opposite was true. Ericsson’s capital structure seems fairly constant over the two years, whereas Nokia’s capital structure has shifted toward more debt.
Solution to 2:
A. For Nokia
Interest coverage ratio for 2008: 32.0 = (4,966/155)
Interest coverage ratio for 2007: 135.3 = (7,985/59)
For Ericsson
Interest coverage ratio for 2008: 9.6 = (16,252/1,689)
Interest coverage ratio for 2007: 20.3 = (30,646/1,513)
B. Nokia’s interest coverage ratio decreased from 2007 to 2008 because of a decrease in EBIT and an increase in interest payments. Even with the decrease, Nokia appears to have sufficient operating earnings to cover interest payments. Similarly, Ericsson’s interest coverage ratio decreased from 2007 to 2008, primarily because of a decrease in EBIT. Ericsson also appears to have sufficient operating earnings to cover interest payments.
C. Nokia’s ability to cover interest payments is greater than Ericsson’s, although both companies appear to have sufficient operating earnings to cover interest payments.
Noncurrent liabilities arise from different sources of financing and different types of creditors. Bonds are a common source of financing from debt markets. Bonds are initially valued at fair value when issued, and then companies have the choice of whether to subsequently measure bonds at fair value or amortized cost.
Leases are related to the use of specific assets. In a finance lease, the lessee assumes substantially all the risks and benefits of ownership of the leased asset so the lessee reports an asset and related obligation. Typically, the lessor will report a lease receivable and derecognize the asset. In an operating lease, the lessee secures the right to use the leased asset but substantially all the risk and rewards of ownership are not transferred. The lessor does not derecognize the asset and reports lease (rent) income, and the lessee reports lease (rent) expense.
Pensions and other postemployment benefits are additional forms of compensation. Employees work currently to earn benefits for retirement or postemployment as well as to earn current salaries and wages. Companies with defined contribution plans report the agreed upon contribution paid into a plan as an expense. Defined benefit plans provide for agreed-upon future benefits. Understanding the reporting of noncurrent liabilities when they arise and how they are subsequently valued is important in assessing a company’s solvency and potential changes in its solvency.
Key points in accounting and reporting of noncurrent liabilities include the following:
- The sales proceeds of a bond issue are determined by discounting future cash payments using the market rate of interest at the time of issuance (effective interest rate). The reported interest expense on bonds is based on the effective interest rate.
- Future cash payments on bonds usually include periodic interest payments (made at the stated interest rate or coupon rate) and the principal amount at maturity.
- When the market rate of interest equals the coupon rate for the bonds, the bonds will sell at par (i.e., at a price equal to the face value). When the market rate of interest is higher than the bonds’ coupon rate, the bonds will sell at a discount. When the market rate of interest is lower than the bonds’ coupon rate, the bonds will sell at a premium.
- An issuer amortizes any issuance discount or premium on bonds over the life of the bonds.
- If a company redeems bonds before maturity, it reports a gain or loss on debt extinguishment computed as the net carrying amount of the bonds (including bond issuance costs under IFRS) less the amount required to redeem the bonds.
- Debt covenants impose restrictions on borrowers, such as limitations on future borrowing or requirements to maintain a minimum debt-to-equity ratio.
- The carrying amount of bonds is typically amortized historical cost, which can differ from their fair value.
- Companies are required to disclose the fair value of financial liabilities, including debt. Although permitted to do so, few companies opt to report debt at fair values on the balance sheet.
- Accounting standards require leases to be classified as either operating leases or finance (capital) leases. Leases are classified as finance leases when substantially all the risks and rewards of legal ownership are transferred to the lessee.
- When a lessee reports a lease as an operating lease rather than a finance lease, the lessee usually appears more profitable in the early years of the lease and less so later, and it appears more solvent over the whole period.
- When a lessor reports a lease as a finance lease rather than an operating lease, the lessor usually appears more profitable in the early years of the lease.
- In a finance lease where the present value of lease payments equals the carrying amount of the leased asset, a lessor earns only interest revenue. In a finance lease where the present value of lease payments exceeds the carrying amount of the leased asset, a lessor earns both interest revenue and a profit (or loss) on the sale of the leased asset.
- Two types of pension plans are defined contribution plans and defined benefits plans. Under a defined contribution plan, the cash payment made into the plan is recognized as pension expense. Pension expense under the defined benefit plan typically includes five components: (a) service costs incurred during the period; (b) interest expense accrued on the beginning pension obligation; (c) actuarial gains and losses; (d) changes to the terms of a pension plan that increase the benefit obligation applicable to employees’ service during previous periods (past service cost); and (e) expected return on plan assets.
- Under IFRS, companies have a choice between reporting the net pension liability (or asset) as either the full amount of the pension obligation less plan assets or excluding any cumulative actuarial gains or losses or past service costs from the balance sheet. Under U.S. GAAP, companies must report the difference between the pension obligation and the pension assets as an asset or liability on the balance sheet.
- Solvency refers to a company’s ability to meet its long-term debt obligations.
- In evaluating solvency, leverage ratios focus on the balance sheet and measure the amount of debt financing relative to equity financing.
- In evaluating solvency, coverage ratios focus on the income statement and cash flows and measure the ability of a company to cover its interest payments.
1. A company issues €1 million of bonds at face value. When the bonds are issued, the company will record a:
A. cash inflow from investing activities.
B. cash inflow from financing activities.
C. cash inflow from operating activities.
2. At the time of issue of 4.50% coupon bonds, the effective interest rate was 5.00%. The bonds were most likely issued at:
A. par.
B. a discount.
C. a premium.
3. Oil Exploration LLC paid $45,000 in printing, legal fees, commissions, and other costs associated with its recent bond issue. It is most likely to record these costs on its financial statements as:
A. an asset under U.S. GAAP and reduction of the carrying value of the debt under IFRS.
B. a liability under U.S. GAAP and reduction of the carrying value of the debt under IFRS.
C. a cash outflow from investing activities under both U.S. GAAP and IFRS.
4. On 1 January 2010, Elegant Fragrances Company issues £1,000,000 face value, five-year bonds with annual interest payments of £55,000 to be paid each 31 December. The market interest rate is 6.0 percent. Using the effective interest rate method of amortization, Elegant Fragrances is most likely to record:
A. an interest expense of £55,000 on its 2010 income statement.
B. a liability of £982,674 on the 31 December 2010 balance sheet.
C. a £58,736 cash outflow from operating activity on the 2010 statement of cash flows.
5. Consolidated Enterprises issues €10 million face value, five-year bonds with a coupon rate of 6.5 percent. At the time of issuance, the market interest rate is 6.0 percent. Using the effective interest rate method of amortization, the carrying value after one year will be closest to:
A. €10.17 million.
B. €10.21 million.
C. €10.28 million.
6. The management of Bank EZ repurchases its own bonds in the open market. They pay €6.5 million for bonds with a face value of €10.0 million and a carrying value of €9.8 million. The bank will most likely report:
A. other comprehensive income of €3.3 million.
B. other comprehensive income of €3.5 million.
C. a gain of €3.3 million on the income statement.
7. Innovative Inventions, Inc. needs to raise €10 million. If the company chooses to issue zero-coupon bonds, its debt-to-equity ratio will most likely:
A. rise as the maturity date approaches.
B. decline as the maturity date approaches.
C. remain constant throughout the life of the bond.
8. Fairmont Golf issued fixed rate debt when interest rates were 6 percent. Rates have since risen to 7 percent. Using only the carrying amount (based on historical cost) reported on the balance sheet to analyze the company’s financial position would most likely cause an analyst to:
A. overestimate Fairmont’s economic liabilities.
B. underestimate Fairmont’s economic liabilities.
C. underestimate Fairmont’s interest coverage ratio.
9. Debt covenants are least likely to place restrictions on the issuer’s ability to:
A. pay dividends.
B. issue additional debt.
C. issue additional equity.
10. Compared to using a finance lease, a lessee that makes use of an operating lease will most likely report higher:
A. debt.
B. rent expense.
C. cash flow from operating activity.
11. Which of the following is most likely a lessee’s disclosure about operating leases?
A. Lease liabilities
B. Future obligations by maturity
C. Net carrying amounts of leased assets
12. For a lessor, the leased asset appears on the balance sheet and continues to be depreciated when the lease is classified as:
A. a sales-type lease.
B. an operating lease.
C. a financing lease.
13. Under U.S. GAAP, a lessor’s reported revenues at lease inception will be highest if the lease is classified as:
A. a sales-type lease.
B. an operating lease.
C. a direct financing lease.
14. A lessor will record interest income if a lease is classified as:
A. a capital lease.
B. an operating lease.
C. either a capital or an operating lease.
15. Cavalier Copper Mines has $840 million in total liabilities and $520 million in shareholders’ equity. It discloses operating lease commitments over the next five years with a present value of $100 million. If the lease commitments are treated as debt, the debt-to-total-capital ratio is closest to:
A. 0.58.
B. 0.62.
C. 0.64.
16. Penben Corporation has a defined benefit pension plan. At 31 December, its pension obligation is €10 million and pension assets are €9 million. If Penben chooses to report under a method consistent with both IFRS and U.S. GAAP, the reporting on the balance sheet would be closest to which of the following?
A. €10 million is shown as a liability, and €9 million appears as an asset.
B. €1 million is shown as a net pension obligation.
C. There is no choice that reports pension assets and obligations on the balance sheet consistently under IFRS and U.S. GAAP.
1Interest rates are stated on an annual basis regardless of the frequency of payment.
2Alternative ways to calculate the present value include (1) to treat the five annual interest payments as an annuity and use the formula for finding the present value of an annuity and then add the present value of the principal payment, or (2) to use a financial calculator to calculate the total present value.
3The Financial Accounting Standards Board (FASB), as part of the convergence project with the International Accounting Standards Board (IASB), has proposed that the treatment of issuance costs be amended to that under IFRS.
4If a company reports debt at fair value, rather than amortized cost, the carrying value may change.
5IFRS (IAS 32, IAS 39, and IFRS 7) and U.S. GAAP (FASB ASC 820 and 825).
6We use the term MD&A generally to refer to any management commentary provided on a company’s financial condition, changes in financial condition, and results of operations. In the United States, the Securities and Exchange Commission (SEC) requires a management discussion and analysis for companies listed on U.S. public markets. Reporting requirements for such a commentary as the SEC-required MD&A vary across exchanges, but some are similar to the SEC requirements. Currently, the IASB is developing a standard for a management commentary that would be consistent for all companies reporting under IFRS.
7“Finance lease” is IFRS terminology and “capital lease” is U.S. GAAP terminology.
8IAS 17 [Leases].
9Examples are from IAS 17, paragraph 10, and do not include all indicators that would lead to a lease being classified as a finance lease.
10FASB ASC Topic 840 [Leases].
11The computations included throughout the example were made using an Excel worksheet; small apparent discrepancies in the calculations are because of rounding.
12IAS 17, paragraph 36.
13A leveraged lease is a third type of capital lease from the lessor’s perspective under U.S. GAAP. FASB ASC paragraph 840-3—05-4.
14Some lease contracts specify minimum lease payments with the potential for additional payments based upon some criteria.
15For calculations in this chapter, total debt is the sum of interest-bearing short-term and long-term debt, excluding noninterest-bearing liabilities, such as accrued expenses, accounts payable, and deferred income taxes. This definition of total debt differs from other definitions that are more inclusive (e.g., all liabilities) or more restrictive (e.g., long-term debt only). If the use of different definitions of total debt materially changes conclusions about a company’s solvency, the reasons for the discrepancies should be further investigated.
16The basic DuPont decomposition is: Return on Equity = Net income/Average shareholders’ equity = (Sales/Average total assets) × (Net income/Sales) × (Average total assets/Average shareholders’ equity).